
New Home Sales April 2025: Waiting Game Does Not Help
New Home Sales weighed in with decent numbers as spring approaches summer, but higher rates are worrisome.


New homes sales for April 2025 posted +10.9% MoM and +3.3% YoY with the critical South region at +11.7% MoM and +6.5% YoY.
Completed homes for sale in inventory at +117K was flat with recent months but +31% YoY. Rising mortgage rates and cyclical concerns could start pushing lower prices to get more pace for more builders. New home sales of houses under construction hit a high for the LTM period at +268K.
Stubbornly high mortgage rates and the fear of a bear UST steepening that keeps mortgage rates high is not helping the builders’ or buyers’ confidence. The 7% line seems more than 100 bps above 6% to many potential buyers and notably at the entry level.
The CPI fallout from tariffs will remain a case study in semantics (inflation vs. decline in purchasing power), but the homebuyer will vote on the definition based on their income vs. expense lines and not discussions of monetary theory. A shift in M1/M2/M3 will not change the immediate price of lumber or gypsum facing high tariffs/duties.
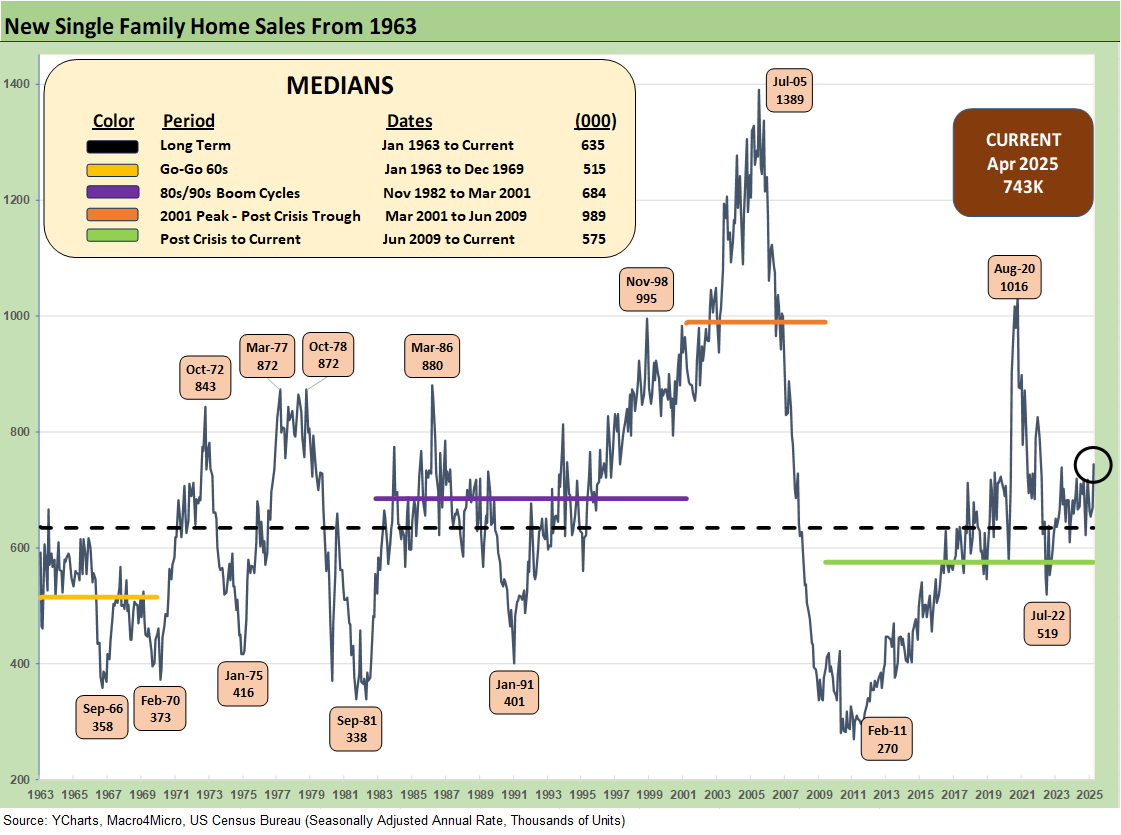
The above chart updates the new single family sales time series from 1963, and the current 743K includes a major wave of revisions in the data. The mortgage rates last night were just over the 7% line using the Mortgage News Daily survey, so this is not a friendly market as we approach the summer.
The tariff noise is staying high (and got higher today with the 50% EU Trump move and 25% for iPhones). Confusion around what is next means the “economics of life” are anything but clear as the reciprocal tariff process drags on. The 50% on the screen today set against the EU, the #1 trade partner of the US, seems very clear.
How they “stack” those tariffs vs. autos, steel, aluminum and soon pharma will keep the potential for trade war high, and that in turn will impact homebuyers and homebuilder confidence. The bulls on the tariff issue might see home buyers embracing the idea of “move now before rates rise” and the bear view will be “I better sit tight. This could get ugly, and I might lose my job.”
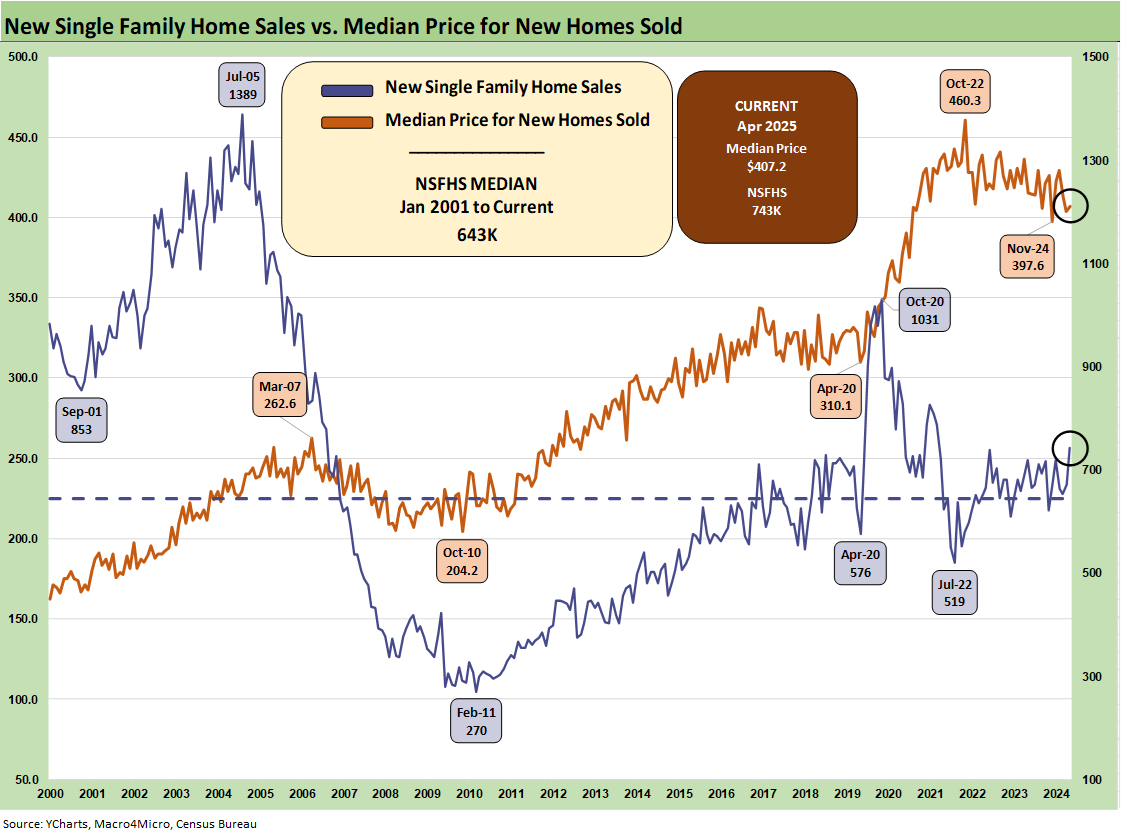
The above two-sided chart shows the sales pattern for the new home sales line since 2000 vs. the median prices. The fact that prices had trended materially higher across the post-COVID cycle is old news, but the sensitivity of monthly payments is married to mortgage rates. Mortgage rates remain the primary driver of weaker volume in the lower price tiers in both new and in existing home sales (see Existing Home Sales April 2025: Soft but Steady 5-22-25).
For the sweet spot in the mid-price tiers, the combination of lower prices in some cases and sustained incentives is part of a pattern of gross margin erosion into 2025. We looked at a number of those trends in our single name coverage (see links at the bottom).
The current $407.2K price ticked higher sequentially. That is below the calendar 2024 median of $420.3 and 2023 median of $428.6. While prices always come with a very big asterisk of regional mix and product tier shifts, we are starting to get more color from builders on the mixed challenges of cost creep and the sustained need to discount prices or offer incentives. That means margin squeeze. We are seeing numerous major builders post declining orders and lower backlogs in earnings reports. The “pace vs. price” topic has been hot again.
We also hear more often that the mortgage buydowns don’t work as well as they used to even when the market was seeing higher mortgage rates. Consumers are doing more than monthly payment math as sentiment weighs in. The 200 bps range since the fall 2023 period has shifted the relative focus to an increase of “specs” inventory strategies during 2024 and into 2025, but some builders are gradually pulling back on that mix in a sign of cyclical defensiveness.
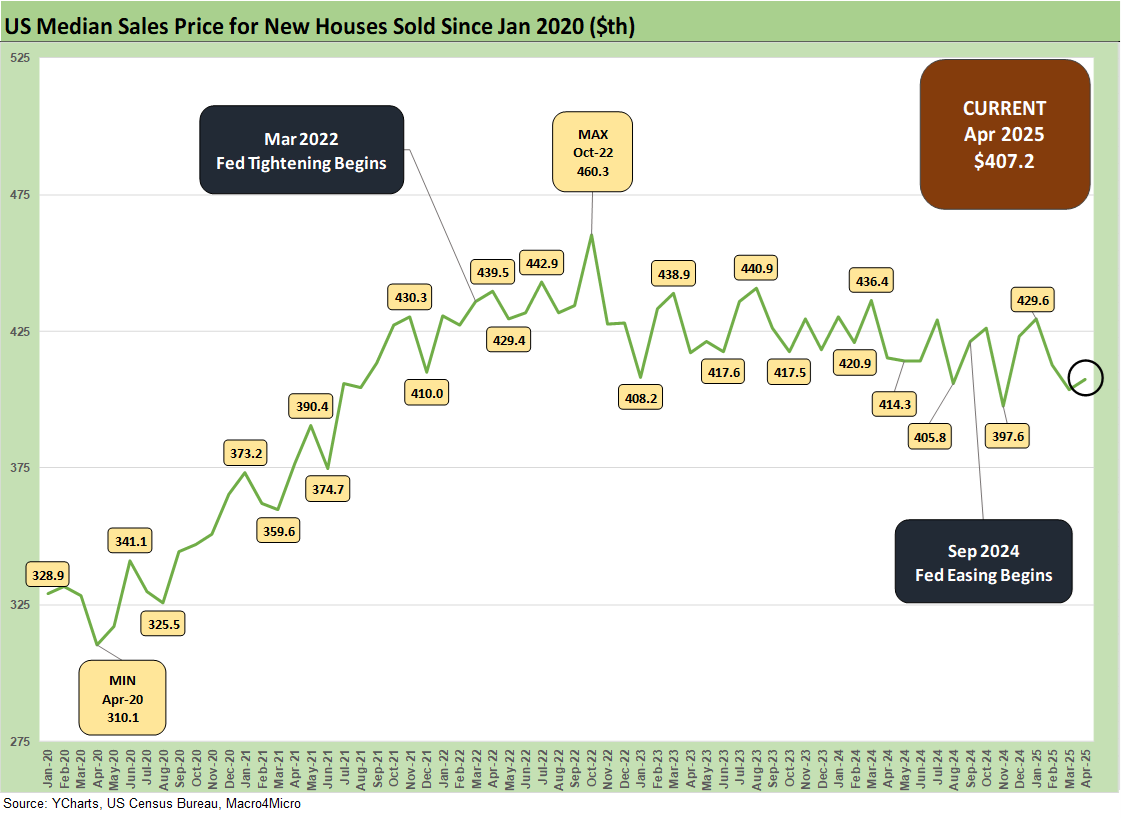
The modest uptick of the median home price last month to $407.2K is still in an overall trend of lower prices with the South’s increased share also a reason at 64% of April new home sales.
Builder fears of higher materials and supplier chain costs are not going to do much to relieve homebuilders in their pricing strategies with gross margins softening in 2025. That said, most are still above pre-COVID levels even if down from margin peaks in 2022.
The builders need to frame how they can get into a gross margin zone that works, and they know that the expectation of costs can get wagged meaningfully by tariffs. The NAHB has put out some numbers for the average home cost from recent tariffs (over $9K per average home). We have commented on the NAHB view on tariff distortions in the past. They will be very busy in the coming months sorting out what is next subject to “the pause” and what comes out the other side. Canada is the big swing factor.
Lumber is in the Section 232 process with duties already quite high with brutal (and rising) tariffs on Canada. The same is true for Mexico on its tariffs and building-related supplies such as gypsum. The NAHB published an updated commentary on tariffs last month (see NAHB: How Tariffs Impact the Home Building Industry March 2025, NAHB Members Cite Impact of Tariff Uncertainty on Home Building 5-22-25). That news was not good.
The homebuilders downplay the problem on earnings calls and let the NAHB trade group do their talking for them to avoid the “Wrath of Con.” The bottom line is lumber, material, appliances, etc., will bring lower margins or higher prices or both.
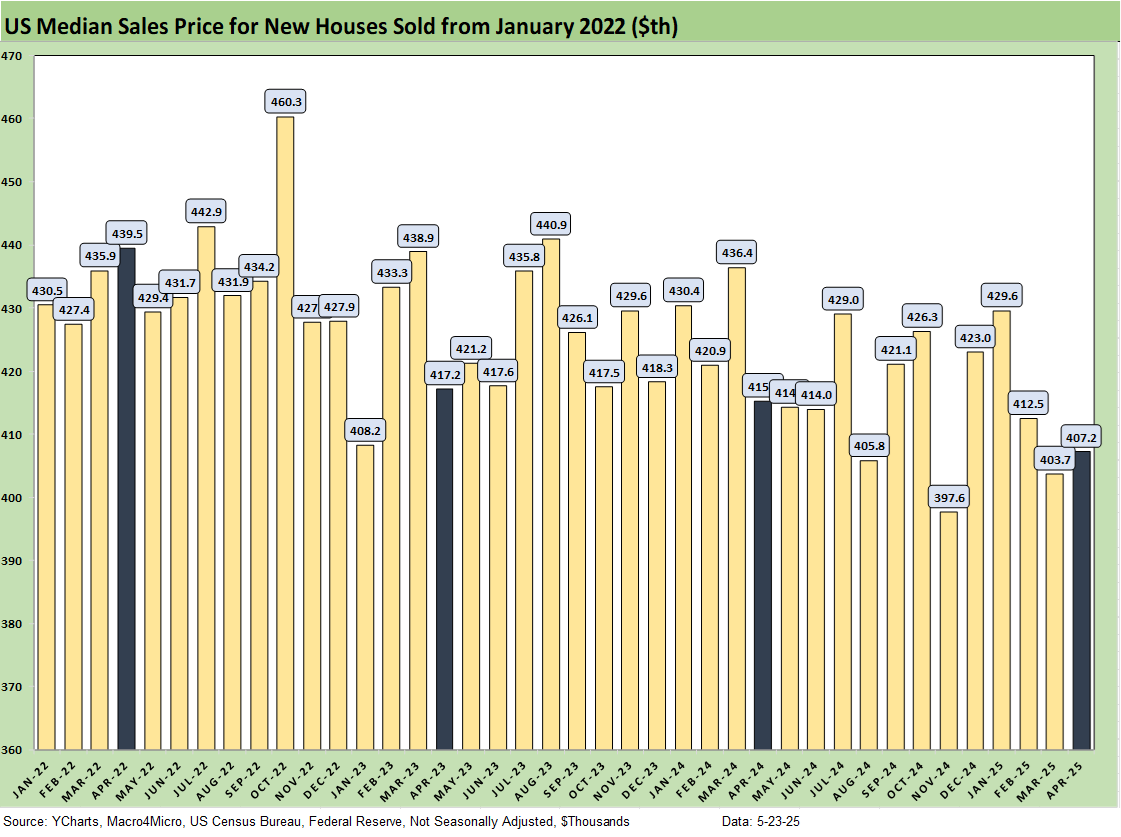
The above chart gives a different visual angle on the median home prices from early 2022. That is a lot of $400K handles with one outlier in Nov 2024. The current $407.2K is now in the lower range of the timeline.
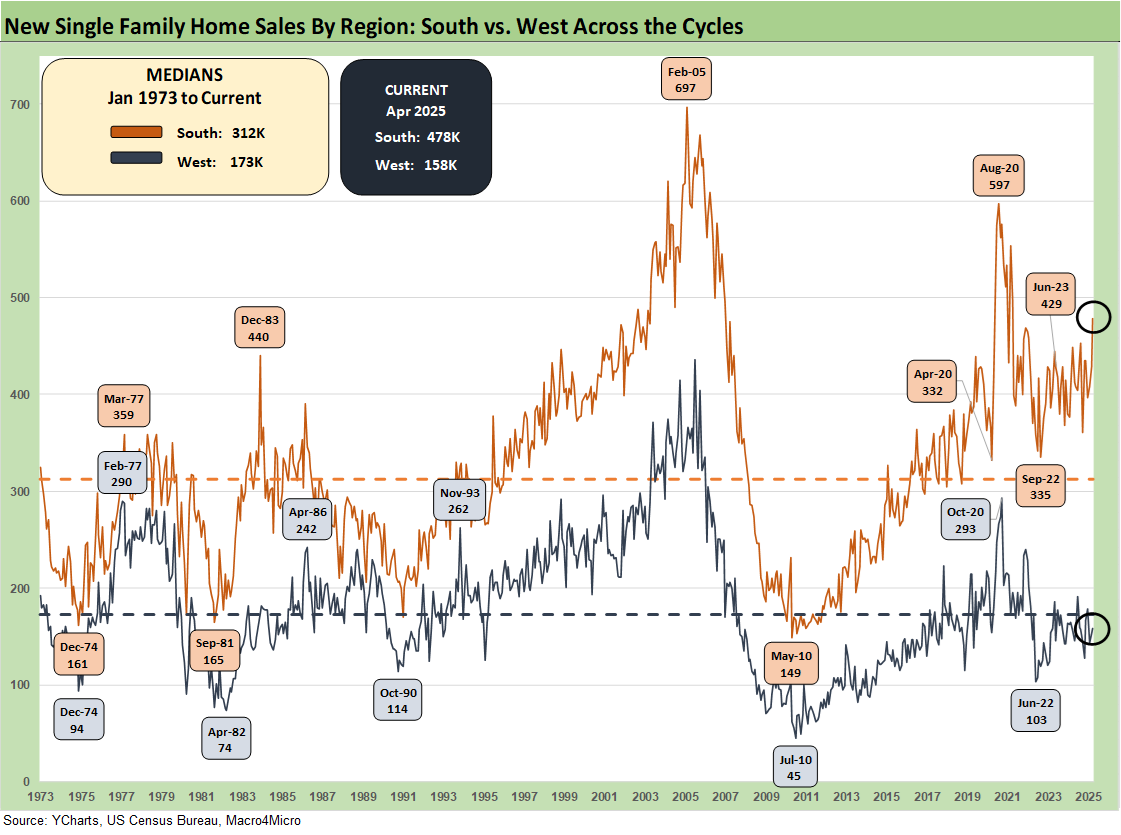
The time series above updates the new single family home sales across the cycles since 1973 for the #1 and #2 regions of the South and the West. The 478K for the South is around 64% of the total of all single family new home sales (SAAR) while the West at 158K is 21% of the total. For the month, the South was +11.7% sequentially and +6.5% YoY. The West was +3.3% sequentially and +1.3% YoY.
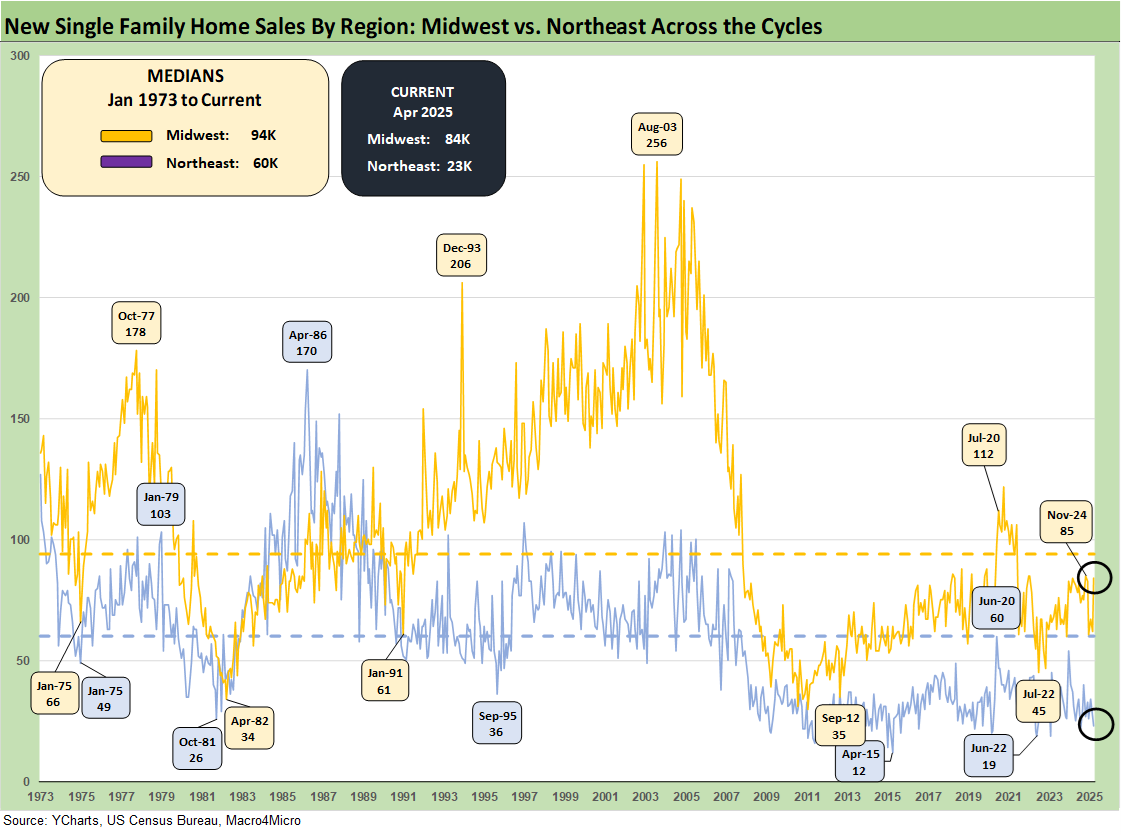
The timeline for new home sales for the smaller Midwest and much smaller Northeast market is detailed above. The Midwest (11% of total) was +35.5% sequentially and +1.2% YoY. The Northeast market (4% of total) was -14.8% sequentially and -25.8% YoY.
See also:
Footnotes & Flashbacks: Credit Markets 5-19-25
Footnotes & Flashbacks: State of Yields 5-18-25
Footnotes & Flashbacks: Asset Returns 5-18-25
Mini Market Lookback: Tricky Ingredients, Shifting Moods 5-18-25
Industrial Production April 2025: CapUte Mixed but Time Will Tell 5-15-25
Retail Sales April 25: Shopping Spree Hangover 5-15-25
Credit Spreads: The Bounce is Back 5-13-25
Housing:
Existing Home Sales April 2025: Soft but Steady 5-22-25
Home Starts April 2025: Metrics Show Wear and Tear 5-19-25
New Home Sales March 2025: A Good News Sighting? 4-23-25
Homebuilders:
Credit Snapshot: PulteGroup (PHM) 5-7-25
Credit Snapshot: Toll Brothers 5-5-25
Credit Snapshot: D.R. Horton (DHI) 4-28-25
Credit Snapshot: Lennar (LEN) 4-15-25
Credit Snapshot: Taylor Morrison Home Corp (TMHC) 4-2-25
KB Home 1Q25: The Consumer Theme Piles On 3-25-25
Toll Brothers 1Q25: Performing with a Net 2-20-25
Credit Crib Note: Lennar Corp (LEN) 1-30-25
D.R. Horton: #1 Homebuilder as a Sector Proxy 1-28-25
KB Home 4Q24: Strong Finish Despite Mortgage Rates 1-14-25
Toll Brothers: Rich Get Richer 12-12-24
PulteGroup 3Q24: Pushing through Rate Challenges 10-23-24
KB Home: Steady Growth, Slower Motion 9-26-24
Lennar: Bulletproof Credit Despite Margin Squeeze 9-23-24
Credit Crib Note: PulteGroup (PHM) 8-11-24
Credit Crib Note: D.R. Horton (DHI) 8-8-24
Homebuilders: Updating Equity Performance and Size Rankings 7-11-24
Credit Crib Note: KB Home 7-9-24
Lennar: Key Metrics Still Tell a Positive Macro Story 6-20-24
Credit Crib Note: NVR, Inc. 5-28-24
Toll Brothers: A Rising Tide Lifts Big Boats 5-23-24
Credit Crib Note: Taylor Morrison 5-20-24
PulteGroup: Strong Volumes, Stable Pricing 4-24-24
D.R. Horton: Ramping Up in 2024 Despite Mortgages 4-19-24
D.R. Horton: Credit Profile 4-4-23