
Footnotes & Flashbacks: Credit Markets 5-19-25
China-US truce news to start last week pushed credit spreads back near past cyclical lows as the market celebrated disaster avoidance.


Can I get another 90 day pause on these tariffs?
The week seemed relatively uneventful after credit spreads saw an impressive one day rally after the US-China truce that hit the screen at the end of last weekend. The immediate -38 bps tightening in US HY to +315 bps was most of the action with the week ending at +316 bps. US IG saw a slower grind tighter back into double digits across the week with an immediate reaction of -5 bps in the Monday aftermath and another -4 bps for a weekly delta on the week of -9 bps.
Spread tightening drove a return to positive excess returns YTD for US HY but with BBs the only positive credit tier at +53 bps YTD. The other credit tiers made progress but still are wider on the year on the tariff and trade chaos.
The macro picture painted by econ data this week still shows a benign response relative to the tariff headline. CPI, Retail Sales, and Industrial Production showed mixed effects but the real action is ahead as transactions feel the effects and companies need to restock with higher cost inventory.
The quieter economic release headlines are quite different from some of the troubling sea level industry commentary as companies scramble to mitigate the tariff cost and fears along the supplier chain. With the consumer particularly sensitive to inflation effects, how tariff costs are managed will remain a key risk driver in the coming weeks and months.
The risks of still material tariff increases rolling in will haunt goods pricing and supply-demand balances across the many trade “deals” that still need to be made down the line. Retaliation is still a risk and notably with the largest trade partners. The “deals” exclude the many reciprocal tariffs that Trump will simply assign without negotiations. He indicated during his global tour that those assigned tariffs (negotiation free) would be coming in a few weeks.

The risk rally continued from the peak post-Liberation Day levels with a major sigh of relief as the worst scenario spinning and empty shelf fears were abated. The 1-month tally for US IG at -20 bps and -100 bps for US HY would be a very good month in a vacuum but instead represents a painful walk-back from the initial disastrous reciprocal tariff rollout (see Reciprocal Tariff Math: Hocus Pocus 4-3-25, Reciprocal Tariffs: Weird Science Blows up the Lab 4-2-25). There is little to celebrate about such strong trailing results when the initial pain was self-inflicted.
The China truce spurred another bout of tightening back down to the prior Oct 2018 cyclical low (see Credit Spreads: The Bounce is Back 5-13-25). The rest of the week was quiet in comparison, ending at -37 bps for US HY and -9 bps for US IG. After such a chaotic year, the move this week leaves YTD spread widening at only +11 bps for US IG and +24 for US HY. We entered the year at compressed levels, and further tightening would be too exuberant given the tariff items still needing resolution.

The above chart covers total and excess returns across HY, IG, and the credit tiers. The post US-China tightening of spreads was paired with another week of rising UST yields. The magnitude of compression this week was more than enough to offset rising yields with improving total return metrics across the board but with BBB and below winning out. Such a good week means improving excess returns, but only US HY overall and BB narrowly both eked back into positive territory.
The volatility this month has been a real-life stress test of market risk aversion, and the market put April behind it quickly as headline-driven moves calmed. The real tests still come when the tariffs are finalized and the trade partner responses are clear. China, EU, and Canada are where the most “induced ill will” resides on trade. Mexico has been relatively quiet, and Canada is unclear on their game plan. Japan and South Korea are struggling to get to a deal.
Trade stress is not off the table yet even if the most recent actions have walked back most of the worst outcomes. Kicking the can down the road with temporary 90-day measures still leaves a lot of undue uncertainty for business planning. The certainty of a more precise and thorough trade policy approach would go a long way in bolstering activity and enable risk taking that the Trump team would love to brag about. Instead, the challenges faced in digesting the recent changes are met by derision in Truth Social posts.
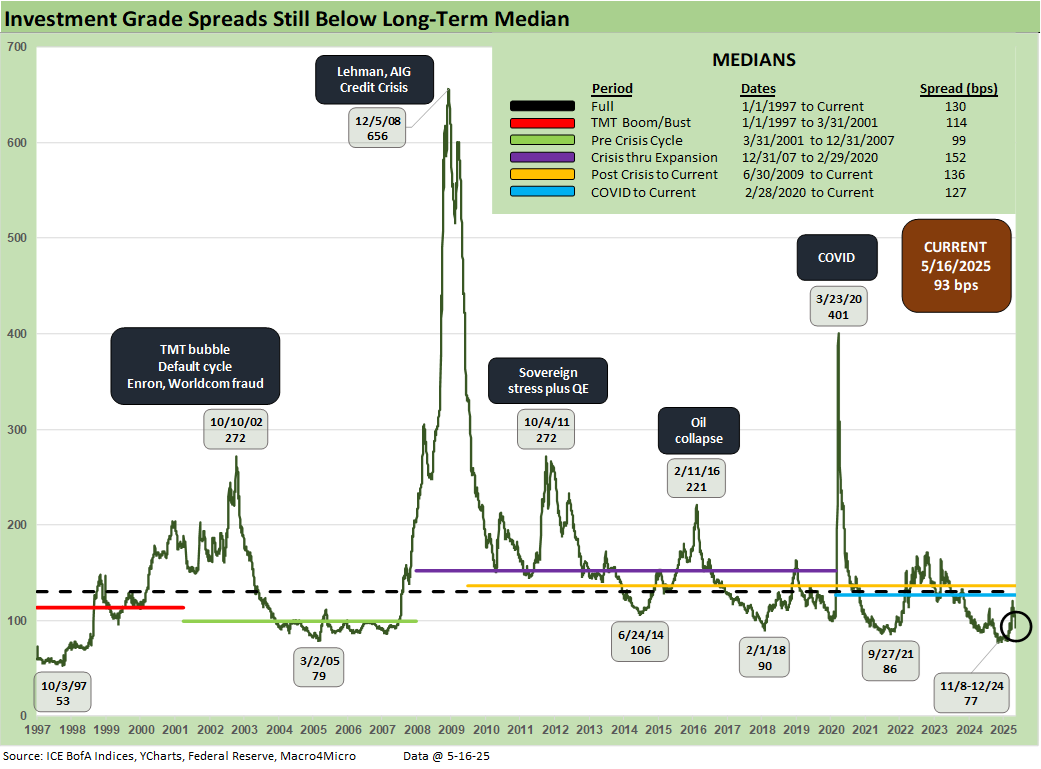
IG spreads ended the week -9 bps tighter in double-digit territory at +93 bps, returning to near prior cycle lows. Spreads overall remain comfortably below the longer-term medians, but this is an IG OAS level that will be a challenge to sustain as we look back across time with so many risks still in play.
The risk symmetry is beginning to skew again after the most recent bout of tightening still sees outstanding deals to be made with all our top trade partners. The necessary relief for US and China last weekend averted the near-term disaster but a lot must continue to go right in trade given how much retracement there has been since Liberation Day.

The week saw -37 bps in spread tightening to +316 bps and ended the week matching the Oct 2018 low right before spreads spiked in Trump 1.0 when CCCs unraveled in Dec 2018 and risky assets turned in a terrible year (see Histories: Asset Return Journey from 2016 to 2023 1-21-24).
With a higher-quality index now vs. past cycles, the recent history includes a stretch below the 300 bps mark with the recent January low of +259 bps very close to the June 2007 lows. Like US IG spreads, we struggle to see the resolution of outstanding trade issues without further hiccups and US HY spreads remain vulnerable to more volatility even if they continue to grind tighter until the headlines come.
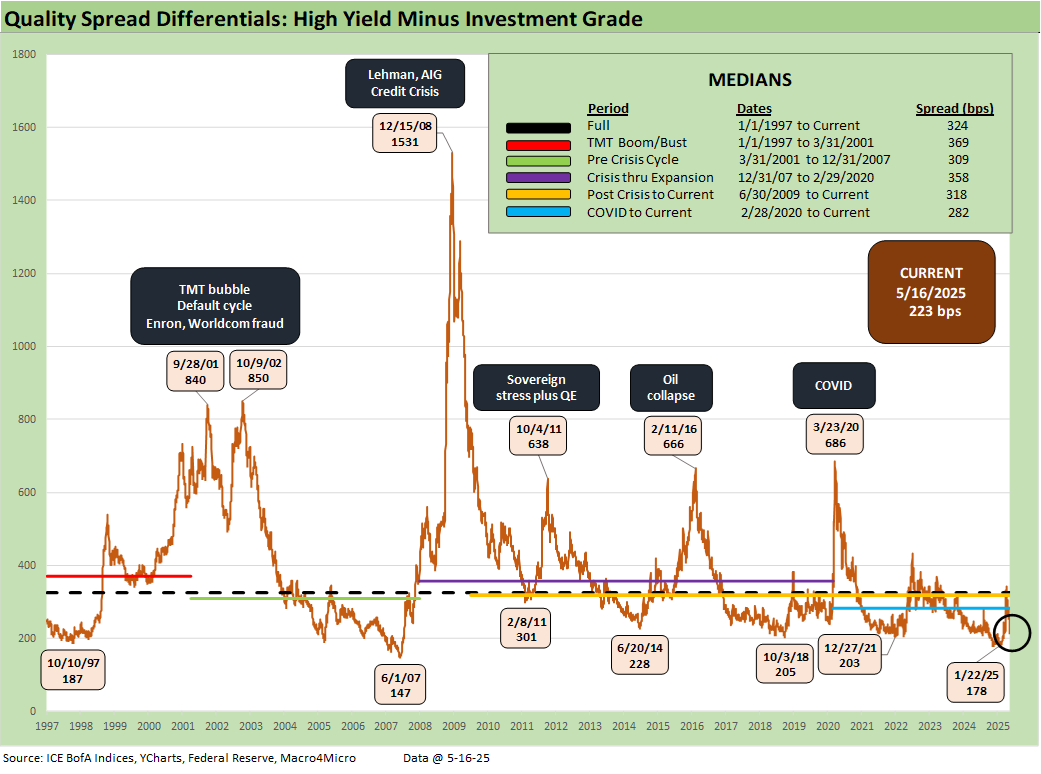
The differential between HY OAS and IG OAS (quality spreads) moved -18 bps this week on the large spread moves. The recent history has been towards a tighter relationship between these two measures as IG quality shifts towards BBB and HY quality skews towards BB. This most recent compression brings us back below the June 2014 low of +228 bps and well below the long-term medians listed above.
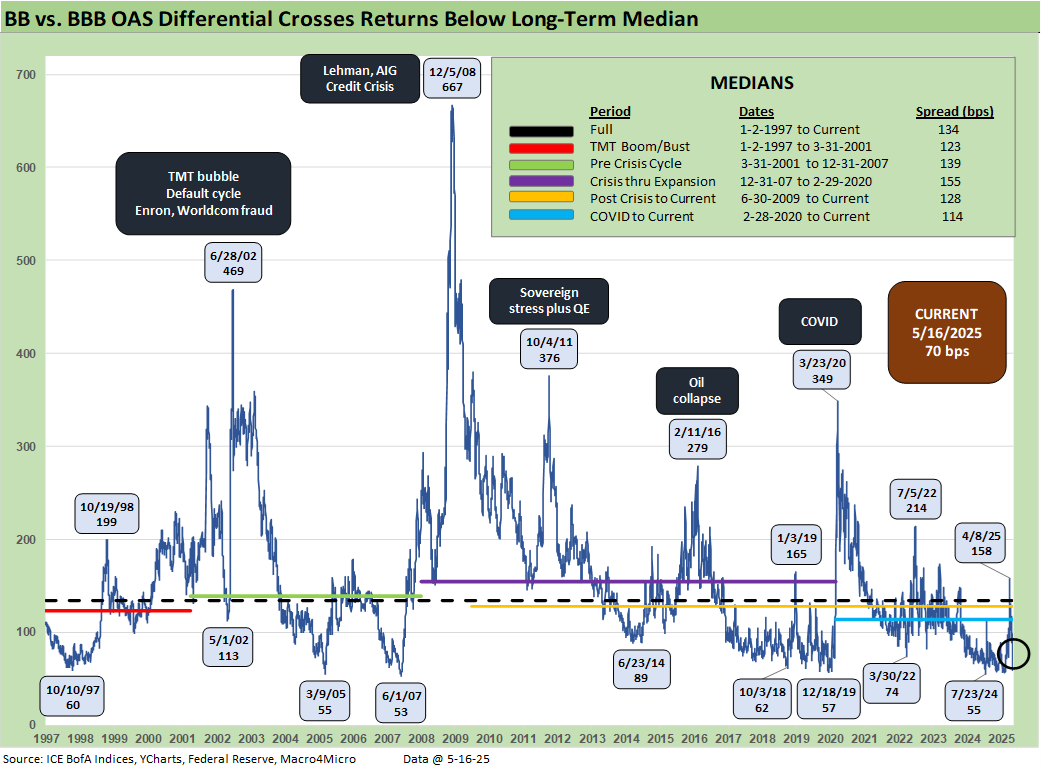
The “BB OAS minus BBB OAS” quality spread differential moved -19 bps this week in the US-China post-truce rally. The current levels are comfortably below all the longer-term medians and relatively compressed in historical terms. This metric has stayed lower in recent history given some convergence in credit quality of the tiers and the core investor base. This level still has a modest gap vs. the low reached last year at +55 bps. We saw the early April 2025 spike to +158 bps after Liberation Day.

The BB tier compressed -31 bps since last week to +187 bps and is back to well below the long-term median. The most recent moves leave BB spreads right at the pre-Covid low and only +30 bps away from the rare +157 bps level seen last November.

The B tier compressed -41 bps this week down to +330 bps. The whipsaw this month saw spreads briefly touch above the long-term median at +486 bps, tightening by -156 bps since then. This level brings the B tier close to the June 2014 and October 2018 lows though still a far stretch from the +254 bps seen last November.

The B vs. CCC tier OAS time series is plotted above. The timeline for B and CCC spreads highlights the points of major divergence along the way (see The B vs. CCC Battle: Tough Neighborhood, Rough Players 7-7-24).
The current CCC tier OAS at +879 bps tightened by -54 bps the past week and back under the long-term median of +954 bps. The recent volatility was a brief reminder of the kind of B vs. CCC divergence that can happen in a hurry as markets reprice. Further tariff chaos still has the potential to repeat that volatility, but the recent US-China truce has calmed the markets for now.
The potential economic damage that comes in 2Q25 or 3Q25 is still coming with the wide array of tariffs, but the scale of the China shutdown was more immediate and far more serious. That hit to prices and expense lines is mitigated (for now).
China as an outsized importer that was embargoed was going to lead to inventory crisis, shutdowns, bankruptcies, and fallout in trade credit. The new China tariffs still point at margin pressure and inflation price impacts, but that is a very different set of risks than widespread financial stress and layoffs.
The CCC YTW moved below the 13% line to 12.92% after being above 14% just last month, but the underlying constituents are widely dispersed across an 81.60 composite dollar price. The CCC tier is still in the pricing zone of equity risk-returns with such yields.
CCC investing at this point demands careful capital structure analysis and rigorous issuer-level relative value research. Subject to how the tariff policies play out and how the stagflation wildcard unfolds, the distressed players are warming up. China just took a swath of companies off the list for near term collapse and notably for working capital intensive operations who would see inventory evaporate. Costs will still be rising even at the new tariff levels. Small business was clearly at risk with the China trade war but tends not to get as much focus from Trump in his “unique” form of game theory.
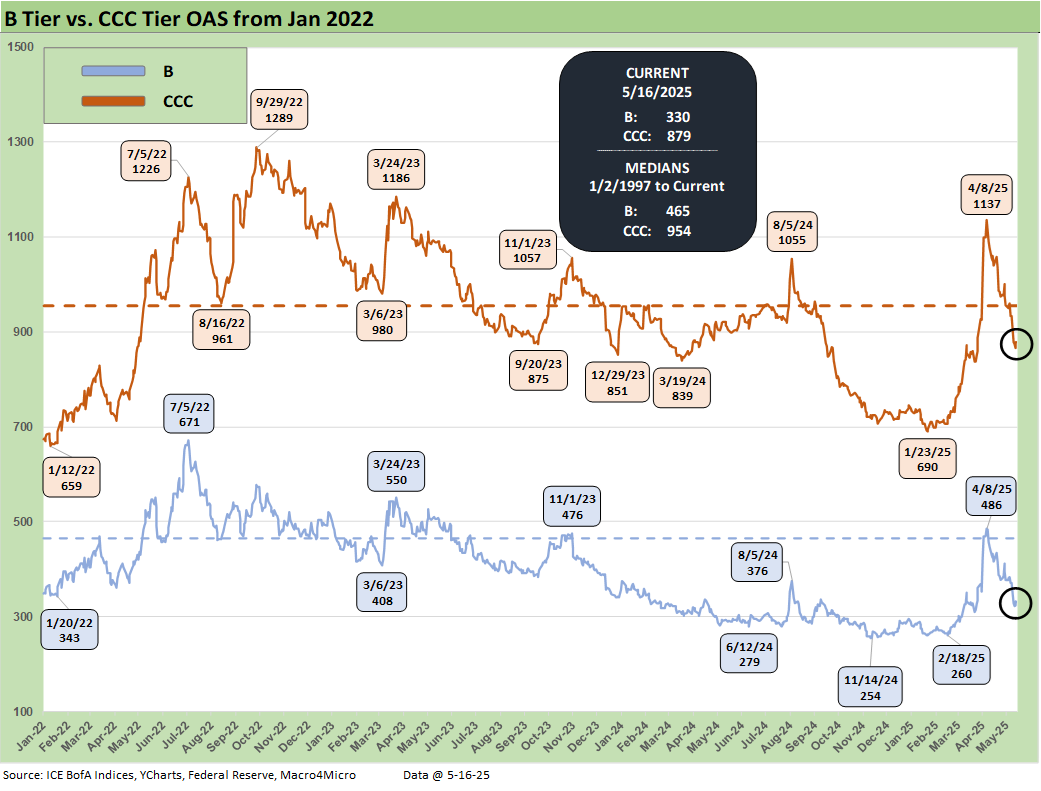
The shorter timeline from Jan 2022 just ahead of the end of ZIRP and start of the tightening cycle gives better granularity on the movements from a low for CCCs of +659 bps in Jan 2022 to a peak of +1226 bps in July 2022 and +1289 bps to end Sept 2022. Then spreads came down to the Jan 2025 tights of +690 bps ahead of the recent spike and whipsaw to current levels.

The B vs. CCC tier differential is broken out with the current +549 bps still higher than the long-term median and above the distinct market time horizons with the exception of the TMT HY credit cycle with its +702 bps median.

The above chart frames the “B vs. CCC tier” quality spread differential across the short timeline for better granularity. Spreads widened with a vengeance since the low of Feb 2025 at +428 bps even if quality spreads recovered from the early April spike to +651 bps on April 8.
A look at yields…

Moving away from spreads, which are well below long-term medians this week, yields for both IG and HY have a more complex story in historical context given the post-crisis distortions of ZIRP and “normalization.” The normalization period of Dec 2015 to Dec 2018 never really got on track with the economic weakness and Fed easing of 2019 followed by a COVID crisis and return to ZIRP in Mar 2020 (ZIRP ended March 2022).
The current IG YTW at 5.29% (vs. 5.31% last week) remained largely in place with an upward UST curve offset by spread tightening and remains below the 6.1% pre-ZIRP median on YTD UST curve moves.
The HY YTW decreased to 7.48% (from 7.77%) vs. a pre-ZIRP 9.3% median. We consider the pre-ZIRP years the most rational frame of reference in light of the post-crisis ZIRP and QE as well as the COVID Fed reactions.
Spreads will remain a key swing factor for reaching those yield medians of pre-ZIRP years, and we just saw material volatility in credit risk pricing in HY the past five weeks. UST yields are a tougher call with the tariff backdrop that still threatens stagflation as well as the potential for a technically driven upward shift on the supply-demand fears. The China truce eases the scale and immediacy of the risks, but stagflation risks are not gone by any stretch. After all, China is the #4 trade partner. That means there are three bigger trade partners to address.
In theory, old fashioned recession risk would pressure UST rates lower and credit spreads higher, but this is no ordinary cyclical turn. We cover the UST shapeshifting in our separate Footnotes publication on yields as the UST curve saw another minor selloff this week.

The above frames current IG index yields vs. previous credit peaks along with their respective UST curves. We include both prior credit peaks in June 2007 and Dec 1997 for context as prior peak credit cycles when high risk appetites saw investors chasing yields. Those 1997 and 2000 markets saw poor risk symmetry and low spreads.
Today’s curve is still low in those historical credit peak contexts. With stagflation risks back in the mix and the current market beyond the credit cycle peak after the tariffs, the next stretch could see long yields rising as spreads widen out for renewed return pain.
The downgrade of the US credit ratings as the US lost its only remaining Aaa set off a slight case of nerves that briefly sent the 30Y back above 5.0%. There was nothing new in the ratings action, but the headline likely prompted the markets to revisit their checklist of worries. That worry list cuts across the systemic, fundamental economic and industry trends in a post-tariff world, technical concerns around the UST market dynamics, record deficits, UST supply-demand imbalances, executive branch governance quality (Cabinet experience and skills), Washinton political dysfunction, policy coherence, volatility of the dollar, and increasingly strained relations with nations that are critical as buyers of UST (i.e. funding the UST deficits). That is only the short list (We did not bother with geopolitics).
The short to intermediate IG market is still the safest bond game for now. The funds that are asset class constrained to HY can take refuge in the higher quality layers, but overall corporate default risks in HY bonds remain in check.

The final chart does the same 1997 and 2007 drill but for HY index yields. This week’s UST move leaves current HY index yields now below prior peak credit cycles at 7.48% vs. 7.96% in June 2007 and 8.60% in Dec 1997. The recent spread widening had moved HY index yields higher, but the recent reversal and rolling UST moves leave the current HY index YTW below both the 2007 peak and 1997 HY index levels.
The widening early this month gave flashbacks to the volatility and major spread moves of the 1997-98 and 2007-08 periods that also posted triple-digit widening months. The sheer speed of risk repricing has happened in earlier cycles even if those moves were for very different reasons.
The challenge is identifying a fundamental transmission mechanism to more trouble for financial metrics and relative risks of default. Identifying a catalyst for pain now is easy with tariffs hitting the macro drivers (the consumer) and micro drivers (“buyer pays” hits margins or requires higher prices). Avoiding a China-US trade shutdown is important. Tariff retaliation clashes can be navigated.
The recent tariff shock is unprecedented in modern capital markets, but at least the banks are much healthier. The China truce eases the immediate threat, but the threat still looms large even if it is not the near-term cliff for many borrowers faced with China risk.
We also see higher quality levels in the HY bond index as a starting point vs. 2007 and the late 1990s TMT bubble years. The reality is the tariff impacts and supply-side disruptions are only now just beginning in substance. It is hard to reflect forward-looking risks when so few know (including the White House) what those risks will be. Trade war risk with the EU, Canada, and Mexico are not zero. China has a 90-day clock that can be terminated or extended with ease.
The bad old days…
Looking back even more, the turn in the credit cycle always comes at some point and often with an external trigger or “assist” that can set it off. During 1990, securities firms started to collapse including Drexel’s Chapter 11 in Feb 1990 and bridge loan related bailouts of Shearson Lehman, First Boston, and Kidder Peabody. We do not face that type of financial intermediary meltdown risk here (at least not yet!). In a protracted stagflation bout, eyes will return to the regional banks.
The summer of 2007 was the start of major problems in the credit markets with asset risk and leveraged counterparty exposure and bank/broker interconnectedness risk soaring. Despite that backdrop that worsened in August 2007, the equity markets and S&P 500 and NASDAQ kept on rallying into Oct 2007. Later in the turmoil and well after the fact, the start of the recession was tagged as Dec 2007 (see Business Cycles: The Recession Dating Game 10-10-22).
The 2007 experience reminded the market that credit leads the cycle and equity lags. The same was true in 1999 with the HY default cycle underway and NASDAQ at +86% that year. This time around, the credit markets did not expect the tariff insanity and is still making up its mind. The real economic effects are more geared to the periods ahead in late 2Q25 and 3Q25 when tariffs will be rolling in at the transaction level. That will be the reality point. We expect HY to stay unhappy and spreads to average wider as the tariffs roll into actual corporate fundamentals.
There are no frictionless wheels in high tariffs. The buyer pays the tariff at customs. How that gets spread around the seller to buyer to customer chain has a lot of moving parts. The “seller pays” and “selling country pays” has been a clear lie from the Trump camp and he admitted as much when he demanded that Walmart eat the tariff cost. Why would there be anything to eat if the seller pays? Shady and misleading discourse is never new to Washington.
See also:
Footnotes & Flashbacks: State of Yields 5-18-25
Footnotes & Flashbacks: Asset Returns 5-18-25
Mini Market Lookback: Tricky Ingredients, Shifting Moods 5-18-25
Industrial Production April 2025: CapUte Mixed but Time Will Tell 5-15-25
Retail Sales April 25: Shopping Spree Hangover 5-15-25
Credit Spreads: The Bounce is Back 5-13-25
Footnotes & Flashbacks: Credit Markets 5-12-25
Footnotes & Flashbacks: State of Yields 5-11-25
Mini Market Lookback: When in Doubt, Get Forcefully Ambiguous 5-11-25
US-UK Trade: Small Progress, Big Extrapolation 5-8-25
Tariffs: A Painful Bessent Moment on “Buyer Pays” 5-7-25
Credit Snapshot: PulteGroup (PHM) 5-7-25
Trade: Uphill Battle for Facts and Concepts 5-6-25
Credit Snapshot: Toll Brothers 5-5-25
Mini Market Lookback: Inflated Worry or Slow Train Wreck? 5-3-25
Payrolls April 2025: Into the Weeds 5-2-25
Payroll April 2025: Moods and Time Horizons 5-2-25
Construction: Singing the Blues or Tuning Up for Reshoring? 5-1-25
Employment Cost Index 1Q25: Labor is Not the Main Worry 5-1-25
1Q25 GDP: Into the Investment Weeds 4-30-25