
Industrial Production April 2025: CapUte Mixed but Time Will Tell
Industrial Production showed total manufacturing CapUte ticking down but steady with declines in Durables and Nondurables offset by an increase in Utilities. The waiting game continues.


Total Manufacturing capacity utilization remained essentially flat in April, declining -0.4% with mixed results in Durables, Nondurables down, and Utilities up.
Activity this month represents activity in the worst of the trade anxiety and how best to plan in such an environment. We know that some of the previous uptick in industrial activity was tied to getting ahead of tariff implementations for low-cost inventory and this month sees some pullback from that elevated level.
Moving forward, how does the pre-loading and spike in inventory levels change the next leg of planning given the recent deals, truces, and negotiations on trade. The lowered tariffs do provide some leeway to sustain higher CapUte levels with the economic outlook improving as the worst of the trade scenarios are now off the table.
The trade war with China has cooled from embargo levels and the recent CPI print shows inflation at bay, but it is hard to ignore that the impact of tariffs still loom large for industries across the board and the clock is still ticking on the original 90-day pause for rest-of-world.

The above chart plots the long-term trend line for total manufacturing utilization where we see a slight downtick this month after expanding in Feb and March. The downtick this month is driven by decreases in almost all Nondurables categories and mixed but negatively biased decreases in Durables. March increases left a lot of questions about which industries might have been reacting to the tariff threats, with April’s numbers providing some partial answers.
“Solving for X” is a challenge in terms of the motives behind production rate trends, but working capital management planning has more clarity this month than last with some clarity on trade deals. Having at least a 90-day pause on China with more friendly positioning is a big piece of the puzzle. That is still a 90-day pause and with a similar timer on reciprocal and Section 232 tariffs on the table, with the outlook remaining murky.
Whether raw materials, supplier chain output, or finished products facing tariffs now (steel, aluminum, lumber, gypsum, etc.) or soon (more tariffs on copper, lumber, pharma, semis, strategic metals), with more coming after the resolution of reciprocal negotiations, there were plenty of reasons to largely maintain expanded production where possible in April.
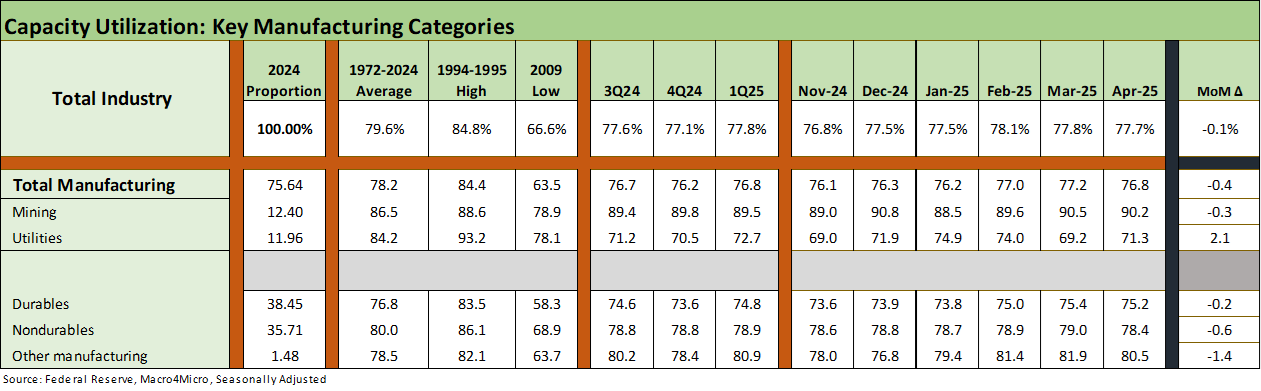
The above table gives the high-level buckets. We include total industry, which was largely flat given Utilities offsetting declines in Manufacturing and Mining. Total manufacturing declined but still remains above levels from late last year with a tick lower to 76.8% from 77.2%. That level now reverses course against the long-term median of 78.7% from 1967 and the post-COVID median of 77.5%. The post-crisis to COVID median was +75.6%, so April levels are still comfortably above that dismal period.

The above table details the largest industry groups we monitor each month with this release. We see all 2 Durables lines lower and 3 higher with both of the major Nondurables lines lower. The mixed results in Durables, especially with some sector specific Autos variances are not signaling major supply chain disruptions yet but the volatility points to where tariff ground effects are being sorted out.

The above table updates the capacity utilization history for expansions and recessions. The ability of more companies to generate solid profits at lower capacity utilization in today’s markets is tied in part to automation and in part to the development of low-cost supplier chains. Low-cost supplier chains are still in the crosshairs as tariffs are here to stay and many will get taken off life support as cost structures get sorted.
Supply chains that had comprised the risk mitigating structural advantages of global sourcing will be rearranging again as of 2025. The good news is that the policy architects blinked in the face of the worst of the US-China scenarios and the starting level for the next 90 days will “just” be 30% tariffs. That was a necessary step back from massive self-inflicted pain though not a full reprieve and will still add up to pain as effects are felt at the transaction level, more tariffs come into effect, and more retaliation actions are taken as trade partners (EU, Canada, Mexico) exhaust all hope and feel the pain.

The above chart details expansion and recession averages and lines them up by height as a frame of reference. We see the current level on the left.
See also:
Retail Sales April 25: Shopping Spree Hangover 5-15-25
CPI April 2025: 1st Inning for Tariffs and CPI 5-13-25
Credit Spreads: The Bounce is Back 5-13-25
Footnotes & Flashbacks: Credit Markets 5-12-25
Footnotes & Flashbacks: State of Yields 5-11-25
Footnotes & Flashbacks: Asset Returns 5-11-25
Mini Market Lookback: When in Doubt, Get Forcefully Ambiguous 5-11-25
Credit Snapshot: PulteGroup (PHM) 5-7-25
Credit Snapshot: Toll Brothers 5-5-25
Mini Market Lookback: Inflated Worry or Slow Train Wreck? 5-3-25
Payrolls April 2025: Into the Weeds 5-2-25
Payroll April 2025: Moods and Time Horizons 5-2-25
Construction: Singing the Blues or Tuning Up for Reshoring? 5-1-25\
Employment Cost Index 1Q25: Labor is Not the Main Worry 5-1-25
1Q25 GDP: Into the Investment Weeds 4-30-25
PCE March 2025: Personal Income and Outlays 4-30-25
1Q25 GDP Advance Estimate: Roll Your Own Distortions 4-30-25