
Existing Home Sales April 2025: Soft but Steady
Existing home sales continue the strange relationship of higher inventory with weaker demand and higher prices.


Will the UST steepener tighten these yet again?
Many of the same trends for existing home sales keep signaling the affordability challenges with low price tiers weak and high price tiers outperforming in % volume deltas.
The MoM -0.5% sequential decline from March for total existing sales and -2.0% YoY will not shake up any directional conclusions, but the sharply higher inventory (+9.0% MoM, +20.8% YoY) alongside higher MoM and YoY prices on Total Existing and Single Family make for a strange combination of factors.
While swinging in a 200-bps range since fall 2023, 30Y mortgage rates have worked against the potential homebuyer of late. The Mortgage News Daily survey cracked above the 7% line this week (7.08% close last night) with the Freddie Mac 30Y benchmark at 6.86% (up 5 bps on the week).
The sales volume deltas continue to hit the lower price tiers with the two sub-$250K tiers declining and the top 4 tiers rising with the strongest performances in the $750-$1 million and $1million+ range.
The above chart shows the sales deltas by price tier with the 4 highest price tiers increasing and the 2 lowest price tiers posting negative volumes. The $250K to $500K tier accounts for just under 45% of the market, and that showed minimal growth of +1.1% with the $500K to $750K tier (over 18% of the market) at only +0.8%.
That trend line is not out of the ordinary with the volumes rising in the price tiers where buyers are less likely to get squeezed out based on mortgage qualifications and monthly payment stress. That is a pattern we have seen frequently over the past year and seems likely to remain a factor with mortgage rates getting back into the high 6% and low 7% zone. The price trends are not helping the monthly payment affordability challenge, but mortgage rates are the more important variable for monthly payments.
The barriers to selling to “move up,” downsize, and/or make an empty nester change still face the “locked in” problem and “Golden Handcuffs” headwind to sell a 3% mortgage house and take on a mid-6% to 7% mortgage on the other side of the trade. That is not a new problem, but it gets harder for sellers/buyers to capitulate and transact when the mortgage market creeps back to 7%. Diminished cyclical confidence along with consumer sentiment is a factor.

The above chart shows the geographic mix of volumes and details on price mix by region. The South is the main event in single family volumes whether new or used at almost 45% of volumes for existing single family.
For the bar chart, we break out the mix for each region by price tier. For example, the South shows almost 52% of its existing home sales volume in the $250k to $500K and around 16% of its sales in the $500 to $750K bucket. The bars for each region add up to 100% (occasionally a rounding miss!). The high cost of homes in the West (notably California) is clear enough in the West price mix just by glancing at the bar chart with 21% at prices over $1 million. The second highest in the $1 million club is the Northeast at over 10%.
We see a big concentration in the $250K to $500K bracket for all regions at almost 45% of the total and a heavy weighting in the $100K to $250K bracket for the Midwest at over 32%. The map explains what states are in each Census region. There is a very wide range of home price profiles in the West and Midwest.

Inventory rose on the month by +9.0% sequentially to 1.45 million for total existing homes. The YoY increase is +20.8%. The existing home inventory trend is back to climbing off the sub-1 million lows of 2022-2023. Inventory had risen into the 1.3 million handle range in 2024 before dipping back down to a recent low of 1.14 million to close out 2024. We see the Feb 2022 lows at 850K above when demand was very high just before the tightening cycle kicked into gear in March 2022. Separately, single family home inventory is up by +21.2% YoY and +9.6% sequentially.
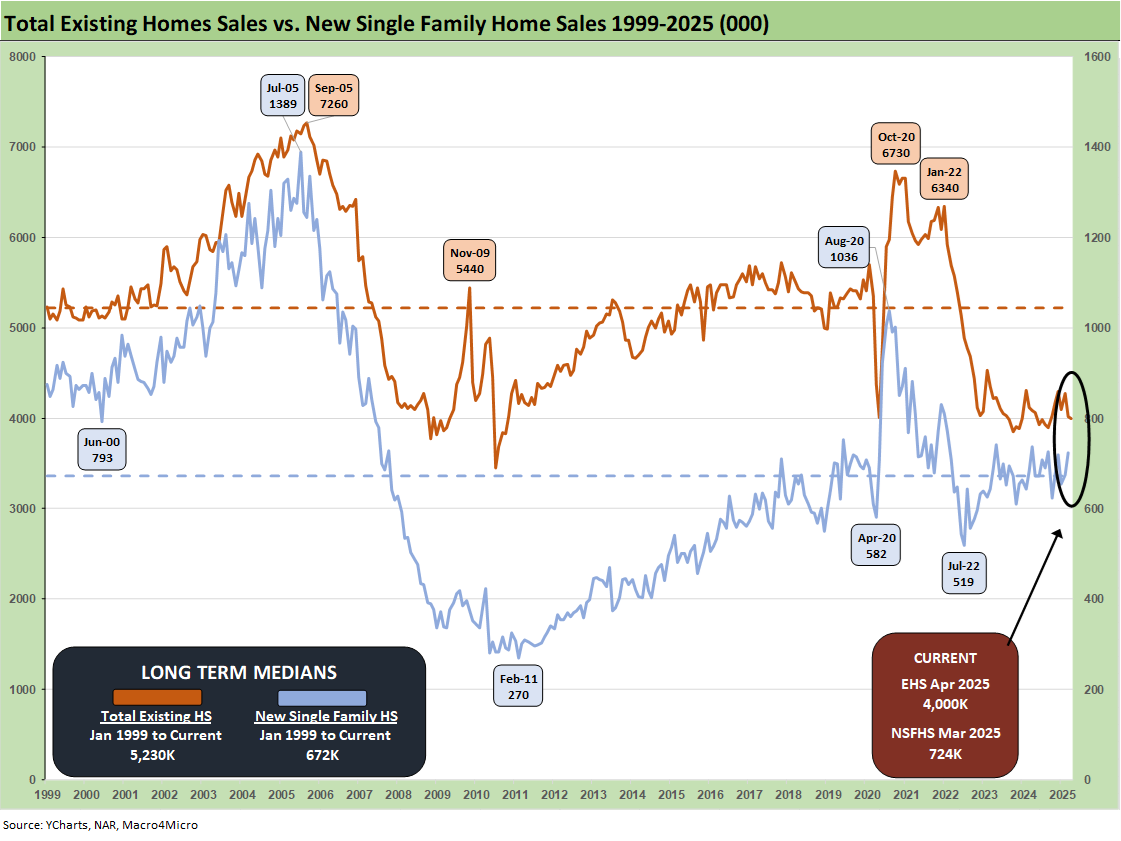
The above two-sided chart updates the trend line in total existing home sales vs. new single family homes. We get the new home sales number for April tomorrow, so we include the March 2025 number above. With mortgage rates in the high 6% to 7% range again and Freddie Mac’s benchmark set at 6.86% at noon today, the affordability headwinds remain alive.
Color from the homebuilders in some recent earnings reports signal that the mortgage buydowns and incentives have not been as effective in the new home sales market even as the existing home sales markets are still seeing a gap between what the seller wants and how the buyer sees the world. That in turn continues to undermine transaction volume. We see a continued rise in inventory and higher median prices, which shows that the existing home sales market remains in somewhat of a state of dysfunction.

The above chart breaks out the timeline for single family alone of 3.63 million vs. total existing home sales of 4.00 million, which is well below the long-term median (from Jan 1999) of 5.23 million for total existing homes. Single family was +10.9% sequentially and -2.2% YoY. The lower line is ex-condo/ex-co-ops. We saw 370K in condos and co-ops in April 2025, down from 400K in April 2024 (revised) and down from 380K in March 2025.

The above chart updates the median price for existing single family homes at $418.0K. Though down from the June 2024 high of $432.9K, the median price remains well above the $308K back in Jan 2021 and $277K in Dec 2019 when mortgage rates were in a different zip code.
Potential sellers and buyers had some recent mortgage relief in the low 6% range in late Sept and early Oct before mortgage rates pushed back to the 7% area. We saw 6.86% posted by Freddie Mac’s benchmark earlier today. Mortgage News Daily survey was above 7.0%.

The above chart updates the monthly existing home sales across the timeline from Jan 2022 through April 2025. The market is a long way from the mid-6 and high 5 million handles of 2021 and then into early 2022 when many homeowners refinanced, and new buyers locked in low mortgages. ZIRP ended in March 2022 and then the UST migration began.
The April 2025 total of 4.00 million is below the May 2020 COVID trough of 4.07, so there are not too many bragging rights in current run rates. We had a few more sub-4 million handles along the way as noted in the chart, so this has been a brutal period for real estate brokers.
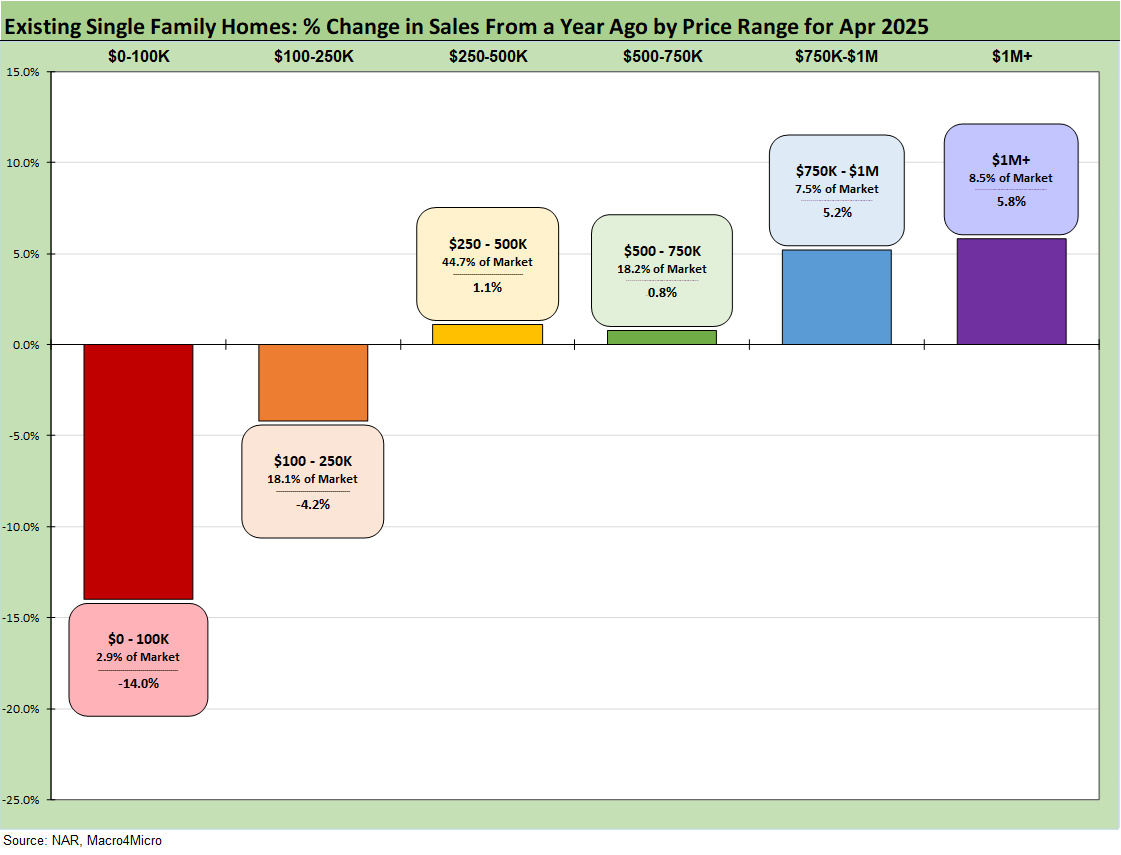
The above chart revisits the topical area addressed earlier on the existing home sales deltas by price tier. The largest tier is the $250K to $500K at almost 45% of sales volumes, and that was up slightly at +1.1% in a month that is supposed to mark the uptick expected in the spring selling season.
April 2025 existing home sales caught headlines such as what we saw in March 2025 with the “lowest since spring 2009” tag. March 2009 was when the S&P 500 hit a low and GE Capital was trading in the credit markets like a high-risk name with major bankruptcies soon arriving in autos as the spring unfolded.
The challenge for the lower tier buyer is evident in the decline of -4.2% in the $100K to $250K tier that comprises 18.1 % of volume. The $500K to $750K tier is over 18% of the market and rose by a muted +0.8% this month. We saw the $1+ million market rise by just under 6% this month in a sign of the times. The highest price tier is 8.5% of the market.
See also:
Footnotes & Flashbacks: Credit Markets 5-19-25
Footnotes & Flashbacks: State of Yields 5-18-25
Footnotes & Flashbacks: Asset Returns 5-18-25
Mini Market Lookback: Tricky Ingredients, Shifting Moods 5-18-25
Industrial Production April 2025: CapUte Mixed but Time Will Tell 5-15-25
Retail Sales April 25: Shopping Spree Hangover 5-15-25
Credit Spreads: The Bounce is Back 5-13-25
Housing:
Home Starts April 2025: Metrics Show Wear and Tear 5-19-25
Existing Home Sales March 2025: Inventory and Prices Higher, Sales Lower 4-24-25
New Home Sales March 2025: A Good News Sighting? 4-23-25
Homebuilders:
Credit Snapshot: PulteGroup (PHM) 5-7-25
Credit Snapshot: Toll Brothers 5-5-25
Credit Snapshot: D.R. Horton (DHI) 4-28-25
Credit Snapshot: Lennar (LEN) 4-15-25
Credit Snapshot: Taylor Morrison Home Corp (TMHC) 4-2-25
KB Home 1Q25: The Consumer Theme Piles On 3-25-25
Toll Brothers 1Q25: Performing with a Net 2-20-25
Credit Crib Note: Lennar Corp (LEN) 1-30-25
D.R. Horton: #1 Homebuilder as a Sector Proxy 1-28-25
KB Home 4Q24: Strong Finish Despite Mortgage Rates 1-14-25
Toll Brothers: Rich Get Richer 12-12-24
PulteGroup 3Q24: Pushing through Rate Challenges 10-23-24
KB Home: Steady Growth, Slower Motion 9-26-24
Lennar: Bulletproof Credit Despite Margin Squeeze 9-23-24
Credit Crib Note: PulteGroup (PHM) 8-11-24
Credit Crib Note: D.R. Horton (DHI) 8-8-24
Homebuilders: Updating Equity Performance and Size Rankings 7-11-24
Credit Crib Note: KB Home 7-9-24
Lennar: Key Metrics Still Tell a Positive Macro Story 6-20-24
Credit Crib Note: NVR, Inc. 5-28-24
Toll Brothers: A Rising Tide Lifts Big Boats 5-23-24
Credit Crib Note: Taylor Morrison 5-20-24
PulteGroup: Strong Volumes, Stable Pricing 4-24-24
D.R. Horton: Ramping Up in 2024 Despite Mortgages 4-19-24
D.R. Horton: Credit Profile 4-4-23