
Footnotes & Flashbacks: Asset Returns 5-18-25
A big rally off the reciprocal tariff lows is tied to post-China relief, but we see some tense tariff variables on the front burner.


Smoke’em if you got’em. The next wave is coming.
The China truce was clearly a big deal as a very draconian outcome was avoided for both nations. The outcome for the US would have been a wake-up call on tariff inflation impact, and the truth about tariffs would have been very much in evidence (the importer pays the tariff to customs despite the litany of lies).
Equity and credit have had a mixed and volatile 2025 with the rolling 1 month a home run for equities but still in the red for the running 3 months (see Mini Market Lookback: Tricky Ingredients, Shifting Moods 5-18-25).
Credit has had quite a ride in spreads while the UST remains well above the Sept 2024 lows with mortgage rates stubborn and the housing sector somewhat faltering in 2025 (Footnotes & Flashbacks: Credit Markets 5-12-25, Credit Spreads: The Bounce is Back 5-13-25).
The returns highlight which sectors remain under a cloud with Health Care (XLV) and Transports (XTN) among the notable ETFs facing recurring pressures from tariffs. For pharma, retaliation and relocation risks now are joined by potential price controls. Bond ETFs have been mixed with 6 of the 7 we track positive YTD and over 3 months.

We see the massive equity rebound in the 1-month timeline while the 3-months period remains all negative and the 6-months showing 3 of the 6 lines negative. Looking back across the 1-year horizon, the divergence of the tech-wagged broad market benchmarks and Growth vs. Russell 2000 small caps is a notable gap.
Debt has also been a struggle in 2025 with a wavering UST curve that has seen swings since the Sept 2024 UST lows. All except the 1-month UST are at least positive looking back across the time horizons, including 1 year, 2 years and 3 years until we hit the ZIRP years. HY has been the clear winner looking back a year in debt and the same is true for 2 years with the big Nov-Dec 2023 rallies in the time horizon.
The rolling return visual
In the next section, we get into the details of the 32 ETFs and benchmarks for a mix of trailing periods. Below we offer a condensed 4-chart view for an easy visual on how the mix of positive vs. negative returns shape up. This is a useful exercise we do each week looking for signals across industry groups and asset classes.
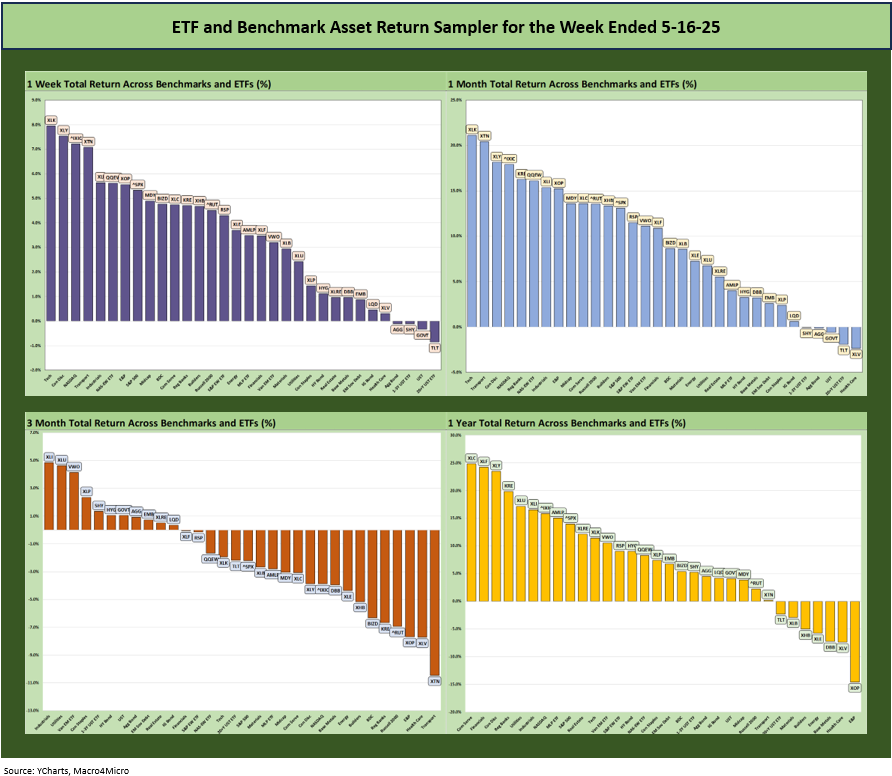
The symmetry of returns is looking good for 1-week and 1 month, but the struggle over 3 months tells a story on the tariff worries and how that is flowing into a range of sectors. We look at the mix in more detail below. We also have a YTD version below (not shown above) at a 20-12 score for negative vs. positive.
The Magnificent 7 heavy ETFs…
Some of the benchmarks and industry ETFs we include have issuer concentration elements that leave them wagged by a few names. When looking across some of the bellwether industry and subsector ETFs in the rankings, it is good to keep in mind which narrow ETFs (vs. broad market benchmarks) get wagged more by the “Magnificent 7” including Consumer Discretionary (XLY) with Amazon and Tesla, Tech (XLK) with Microsoft, Apple, and NVIDIA, and Communications Services (XLC) with Alphabet and Meta.

We looked at the tech bellwethers in the Mini Market Lookback: Tricky Ingredients, Shifting Moods (5-18-25). The material differential between the bullish week and month vs. the negative 3 months has been the story of 2025 volatility and the threats direct and indirect from tariff and China clashes.

We already looked at the 1-week mix in Mini Market Lookback: Tricky Ingredients, Shifting Moods 5-18-25. 11 of 11 of the S&P 500 sectors were in positive range. That about sums it up as does the reality that you needed 5.3% for the week to make the top quartile in the chart above. That top quartile also showed a healthy industry mix even if tech was heavy. We also had Transports (XTN), Industrials (XLI), and E&P (XOP) in the mix with the NASDAQ and the S&P 500.

The 27-5 score for the 1-month period included 4 bond ETFs in the 5 lines in negative range. We see a very strong bounce in numerous Mag 7 heavy and tech-centric lines including Tech (XLK), Consumer Discretionary (XLY), NASDAQ (IXIC) and the Equal Weight NASDAQ 100 ETF (QQEW). Transports (XTN), Regional Banks (KRE), Industrials (XLI), and E&P (XOP) rounded out the top quartile.
We keep seeing the Health Care ETF (XLV) in the bottom quartiles across the time horizons. Health care has enough problems with RFK Jr but has the added problem of Trump having pharma on the tariff-in-process list. Pharma is the #2 import into the US from “the world” behind autos, but the #1 and #2 are close (see US Trade with the World: Import and Export Mix 2-6-25). Also, while XLV is pharma heavy, UnitedHealth (UNH) is in the mix with its own set of problems.
The pharma multinationals that have operations in Ireland could be in for a tough time while the potential for a pharma trade war with the EU will be looming. Pharma is the #1 import from the EU by far (see US-EU Trade: The Final Import/Export Mix 2024 2-11-25, Tariffs: The EU Meets the New World…Again…Maybe10-29-24) but also is the #1 export to the EU from the US just ahead of crude oil. The EU pharma trade balance in pharma shows a major trade deficit for the U.S., so there could be room for a clash there. We also see significant imports from China in pharma, medicine, and intermediate ingredients that could be a source of tension in the next round.

The 3-month returns weighed in at 11-21 with the bottom half of the top quartile comprised of 4 bond ETFs. We see Industrials (XLI) at #1, Utilities (XLU) at #2, EM Equities (VWO) at #3, and the defensive Consumer Staples ETF (XLP) at #4.
In the bottom rankings, we see the suffering in Transports (XTN) at -10.5% as freight and logistics was in a meltdown plus the recurring trouble in the pharma-heavy Health Care ETF (XLV). Energy ETFs (XOP, XLE) had a struggle as cyclical worries hit oil demand and oil prices weakened until the China truce. Cyclical fears in the US hit small caps (RUT) and Regional Banks (KRE) with some Russell 2000 (RUT) and Midcap (MDY) anxiety spilling into some credit fears showing in BDC ETFs (BIZD). Homebuilders (XHB) also continue to struggle since the early fall peaks.

The YTD scoresheet of 20-12 included a decent start to the year before the tariff trouble started. The top quartile is a diverse mix with the #1 at +9.5% with Industrials (XLI) followed by Utilities (XLU) at #2, EM Equities (VWO) at #3, Financials(XLF) at #4, and the top 5 rounded out by income-heavy Midstream Energy (AMLP).
The bottom included a beating for Transports (XTN) at -8.5%, Russell 2000 (RUT) in second to last at -4.8%, E&P (XOP) -4.7%, Homebuilders (XHB) at -3.1%, and Health Care (XLV) rounding out the bottom 5 at -2.9%.
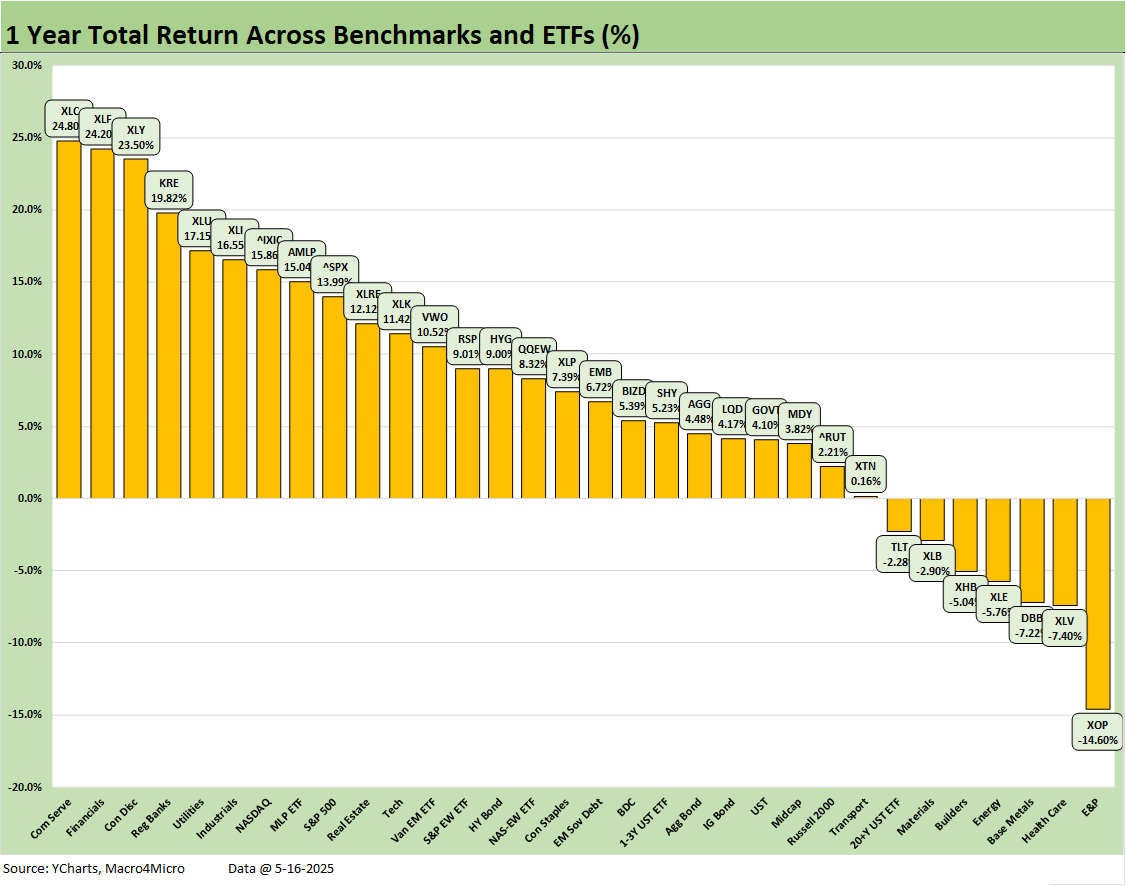
The 1-year time horizon is shifting to the left with the 30-handle positive numbers seen in 2024 now in the rear-view mirror. The 25-7 for the LTM period is respectable with the 20-12 YTD only a small drag to this point. However, that contrasts sharply with the 30-2 for the calendar 2024 LTM return and the 31-1 over the trailing 2 years.
The two banner years for broad equity benchmarks in 2023-2024 are a simple fact now even if not brought up in semi-polite Washington conversation these days (see Footnotes & Flashbacks: Asset Returns for 2024 1-2-25). During 2024, the median returns across the 32 lines was around 10% while the trailing 2-year period median return was over 20%. The current LTM median asset return is 7%. That won’t come up in the current White House briefings.
See also:
Mini Market Lookback: Tricky Ingredients, Shifting Moods 5-18-25
Industrial Production April 2025: CapUte Mixed but Time Will Tell 5-15-25
Retail Sales April 25: Shopping Spree Hangover 5-15-25
Credit Spreads: The Bounce is Back 5-13-25
Footnotes & Flashbacks: Credit Markets 5-12-25
Footnotes & Flashbacks: State of Yields 5-11-25
Footnotes & Flashbacks: Asset Returns 5-11-25
Mini Market Lookback: When in Doubt, Get Forcefully Ambiguous 5-11-25
US-UK Trade: Small Progress, Big Extrapolation 5-8-25
Tariffs: A Painful Bessent Moment on “Buyer Pays” 5-7-25
Credit Snapshot: PulteGroup (PHM) 5-7-25
Trade: Uphill Battle for Facts and Concepts 5-6-25
Credit Snapshot: Toll Brothers 5-5-25
Mini Market Lookback: Inflated Worry or Slow Train Wreck? 5-3-25
Payrolls April 2025: Into the Weeds 5-2-25
Payroll April 2025: Moods and Time Horizons 5-2-25
Construction: Singing the Blues or Tuning Up for Reshoring? 5-1-25
Employment Cost Index 1Q25: Labor is Not the Main Worry 5-1-25
1Q25 GDP: Into the Investment Weeds 4-30-25
PCE March 2025: Personal Income and Outlays 4-30-25
1Q25 GDP Advance Estimate: Roll Your Own Distortions 4-30-25