
Footnotes & Flashbacks: State of Yields 5-18-25
The UST saw a modest bear flattening from 2Y to 10Y the past week as the China panic eased and hope for trade sanity rose.


Reciprocal tariff methodology nears completion.
The week saw a mild upward move in the UST curve with the 2Y rise outpacing the 5Y and 10Y for the week. We look at the 3M to 2Y UST slope history this week.
Reciprocal tariffs from Team Trump are due to be delivered to many trade partners over the next few weeks, so life will get interesting again. What remains unclear is the timeline for some major trade partners with both Japan and South Korea in limbo for now.
The EU deal is making minimal progress and getting a late start, so there is ample reason to be concerned that a take-it-or-leave-it tariff could get trade tensions on the rise again. None of these delays will help the Fed be more confident in the balance of risks.
The lack of focus on the major trade partners while Trump was on a world tour will not sit well without more focus, time, and consideration given the largest trade partners who are also allies.
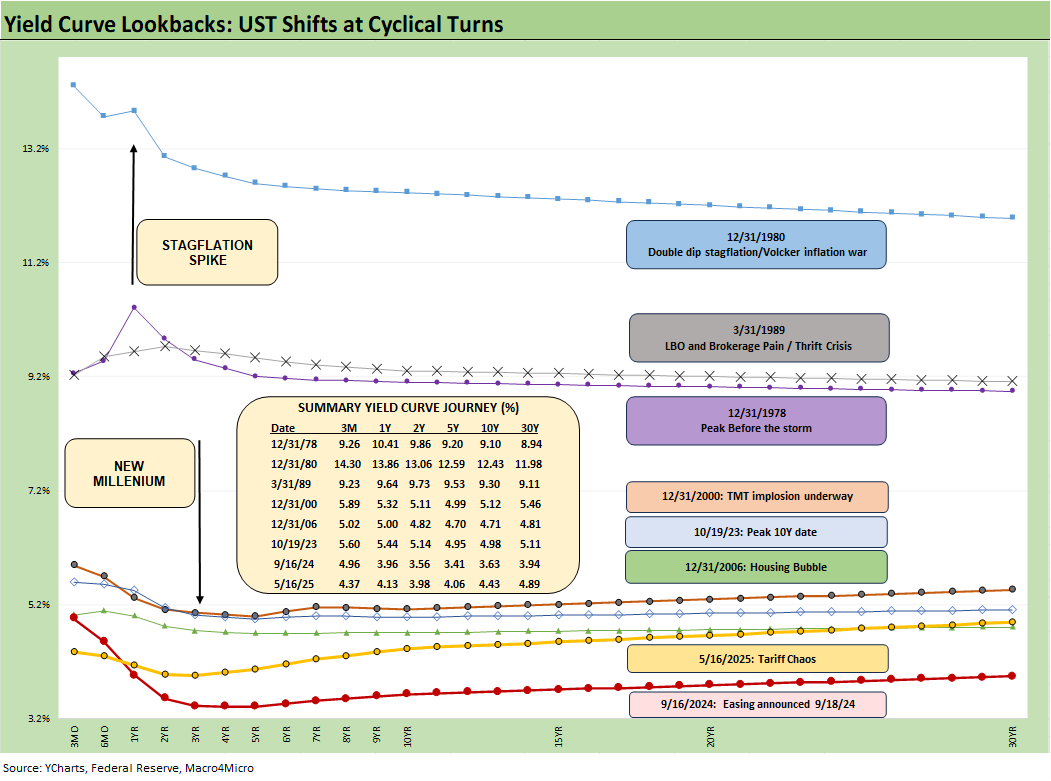
The above chart plots some key cyclical transition periods from the Carter inversion of 1978 across the Volcker years, the credit cycle peak in 1989, the TMT cycle in 2000, and the housing bubble in 2006. The chart then jumps from 2006 to 2023 beyond the crisis period and the ZIRP years when the market saw QE and normalization distortions.
We use the Oct 2023 UST peak date on the 10Y UST as a key frame of reference. The UST rates now are very low by any historical standard but well above the Sept 2024 lows as we lifted off from the initial easing into another steepener.
The adjectives used to describe the UST curve and “high” rates can seem perplexing looking back across time when you look across the lines in the box. Once you get outside the post-crisis ZIRP years, the UST rates are extremely low. The debate usually then moves on to “real rates” and that is one of the problems for the Fed right now since the tariff risks are more likely to reprice goods at a pace that is very hard to predict.
The moving parts means the Fed needs to take its time despite the policy makers axes (read Trump) for the Fed to move right away. That would help Trump blur the accountability and performance attribution when the tariff strategy does not work as planned. Trump can blame Powell either way. The risk to the Fed of moving too soon would be contributing to a stagflation spiral and joining the Fed Hall of Shame with Burns and Miller and their 1970s failures before Volcker took the helm.

The above replays our weekly chart detailing the migration of the UST curve from 12-31-21 with memory boxes detailing the tightening dates and magnitude and more recently the easing. The UST curve seems to intermittently mix bear steepening patterns and flattening rallies since the Sept 2024 lows, but market fear was creeping into the shapeshifting after Liberation Day before calming down with the pause.
The China truce for now creates a relatively rational backdrop, but the odds of Fed action remain very low for June. The recurring pauses mean the Fed needs to wait since it is the tariff inflation fallout that needs to see a final plan and an assessment of real data on the other side. There are a range of unknowns such as the final tariffs, retaliation risk, the success of any new China terms, consumer responses, corporate investment reactions, payroll impacts, and much more (final budget plan, OPEC and Russian oil supply wildcard, etc.). It is not hard to understand why the Fed would be careful here.

The above chart details the material move from the peak UST curve of 10-19-23 down into the UST bull rally of Nov-Dec 2023 and then eventually into the lows of Sept 2024. The Sept 2024 low tick only came after a bear steepener hit the curve through the summer of 2024. We then moved back into the bear steepener mode until the tariffs roiled the UST markets and initially sent 2Y to 30Y lower on cyclical fears.
The above chart shows the shift higher from the Sept 2024 lows and the steepening from the low point at the end of 2023. We see the 10Y and 30Y notably higher and looking somewhat more normal from 2Y out to 30Y. The challenge is still that front end inversion from 3M. This week we look at the 3M to 2Y UST history further below.
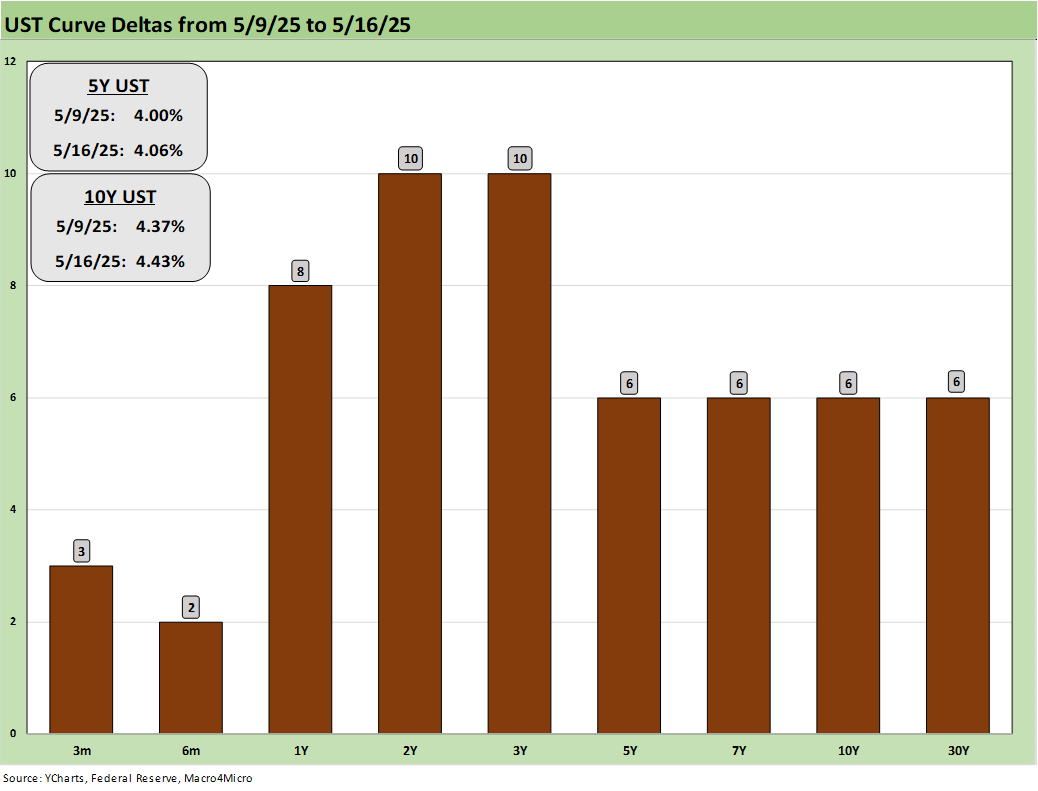
The above updates the UST deltas for the past week. The disaster avoidance that comes with a China truce had pushed the UST curve modestly higher with the 2Y and 3Y moving more on the lower potential for easing.
The constructive CPI reading the past week is not the main focal point given the lag times for these tariffs to be effective and they start rolling into shipments and transactions. Inventory built up ahead of tariffs, and the working capital management cycle can vary widely by industry and companies.
While tariff advocates have pitched everything from “seller pays” (pure fiction) to cost sharing as a mitigating factor (varies by industry), the tariff flowing into the system will be the empirical gut check from here for the Fed and the markets. The handicapping for CPI is complex. As an example, anyone who tells you how the auto chain will react overall ignores some basic realities that there are numerous competing interests even among industry allies (materials, components across multiple tiers of suppliers, OEMs, dealers).
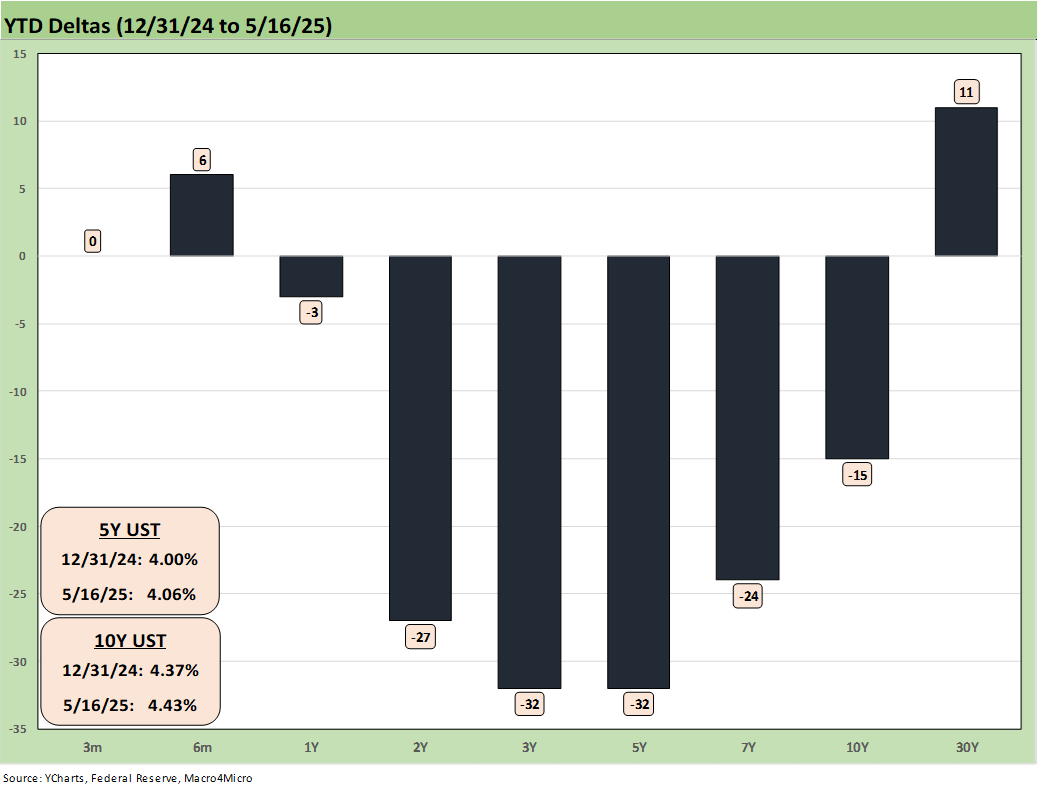
The YTD UST deltas are updated above. The bull steepener pattern has given a modest lift to bond returns and in credit. IG and HY have seen UST impacts partially offset by modest YTD spread widening in IG (+11 bps) and HY (+24 bps). We looked at asset returns separately (see Footnotes & Flashbacks: Asset Returns 5-18-25).

The above chart updates the UST deltas since the 9-16-24 lows that came alongside the easing. That has not worked as many market watchers predicted on the shape of the UST curve and number and pace of easing that was supposed to follow. While Trump rails at the Fed and Powell, the FOMC would likely be easing if it was not for Trump’s over-the-top and unprecedented tariff game plan.
The risks of an early move without clarity on the final tariff plan and some market-based data could be very costly by compounding the problem and leaving the Fed facing inflation and stagnant growth. The politics of tariffs is one challenge, but the fact remains that this tariff strategy has never been tried in the postwar era or in modern capital markets. That leaves confidence low and market risks high.
The rollout and conceptual foundation of the tariff program (Trump with his recurring “selling country pays the tariff” pitch) has only added to the uncertainty by leaving policy makers and legislators catering (pandering?) to a false foundation for the entire economic plan. That is how the dollar tanked as bond yields went higher even in the face of lower inflation so far in 2025. The Fed is the only party playing it straight at this point.

The above chart updates the UST deltas from the end of 2023 after a massive rally in rates and risk in Nov-Dec 2023. The follow-on in 2024 expected by the consensus mildly disappointed the UST bulls in the number of FOMC cuts but was well off relative to the expectation of a material bull flattening during 2024 when a bear steepener prevailed by the end of the year.
The 2025 battle has been an ebb-and-flow pattern, but bonds have been reasonable performers in multiasset class context – which is not saying much YTD 2025. With the volatility and surprises around reciprocal tariffs to date, the market is now gearing up for what Trump has essentially stated will be fill-or-kill tariff decisions after talking about negotiations. The trade partners can take it and like it or retaliate. That does not sound like favorable symmetry for inflation risk. There will either be tariff costs to be paid by the buyer at the border or there will be less product and supply-demand imbalances. That ends up as a product by product and nation by nation analysis.
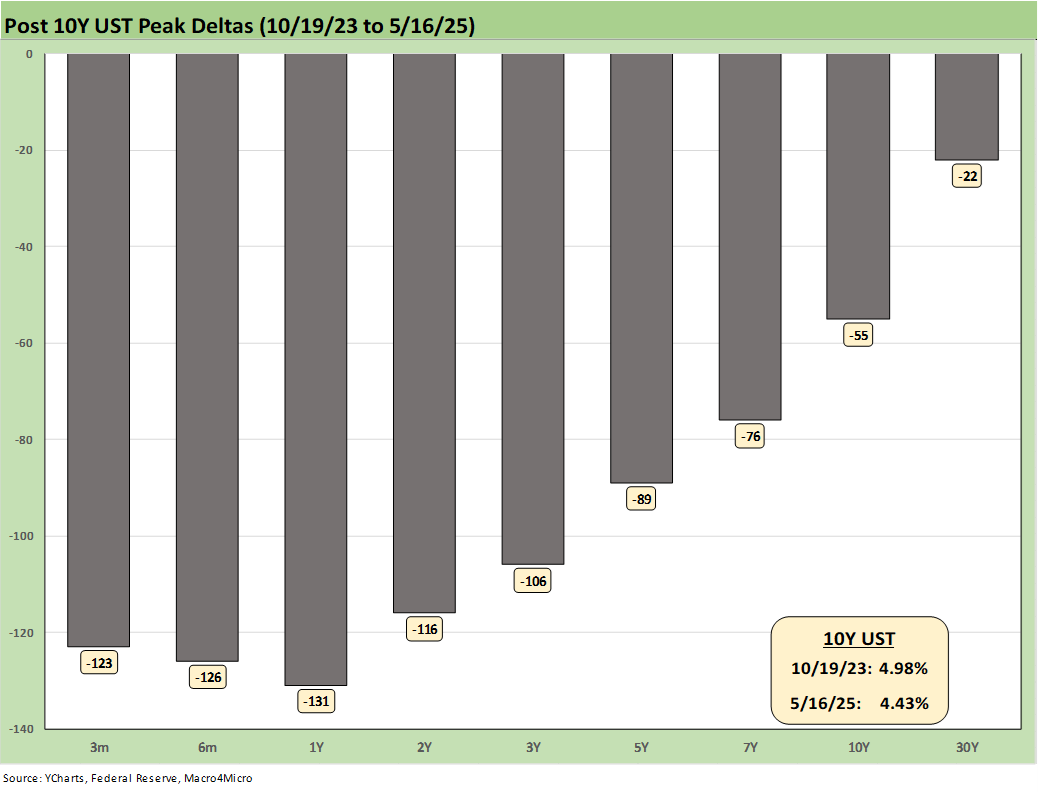
The above chart updates the running UST deltas from the 10-19-23 peak date of the UST 10Y when it barely missed the 5.0% line. For those looking for a frame of reference on what a bad move in inflation metrics might mean, these deltas at least offer a recent set of data points during an inflation fighting year. That is why we keep revisiting that timeline.
Losing a rally of over -55 bps in the 10Y UST would not help the mortgage market and would lead to a material valuation headache in equities and M&A economics. Mortgages have been a drag on housing (new and existing home sales). Inflation heading the wrong way would do more damage.

The above chart updates the UST curve for this past Friday and the Freddie Mac 30Y Mortgage benchmark rate (noon Thursday release). We include two useful historical periods including the peak homebuilder year end of 2005 and mid-2006 when RMBS quality concerns were catching headlines as the housing bubble was peaking. We post UST curves for each period in the chart. The past week saw the rate move higher to 6.81% (from 6.76%) for Freddie’s noon Thursday pricing.
We recently added a column above detailing the differential between the Freddie Mac 30Y and the 10Y UST. That differential moved slightly lower this week to +238 bps from +239 bps. The year 2005 posted a differential of +100 bps and makes a statement on what the mortgage market was like in 2005. Risk senses were dulled as the mortgage market soared during that peak homebuilding year. RMBS had run wild, and the history of that era is one for the record books and time stamped with a consumer credit meltdown and systemic crisis.

We added a new UST curve slope segment this week with a history since 1984 on the 3M to 2Y slope. With so much speculation on when the FOMC will ease and the 2Y UST being a major focal point, we thought it was worth adding to the collection. We see the recent slope at -39 bps vs. the long-term median of +57 bps. The front end of the UST curve is where the anomalous distortions remain since the tightening cycle began. We still see inversions for 3M to 5Y and 3M to 2Y.
For many in the market, that unusual front-end inversion will be enough reason for the FOMC to ease in the direction of “normal.” The counter is that the 2.0% PCE inflation target has not been reached. There is also the matter of what many see as inflationary risks of higher prices from tariffs. That is the tariff debate we have already discussed at length in our tariff commentaries (see Trade: Uphill Battle for Facts and Concepts 5-6-25).

The above chart shortens the timeline for a more granular look at moves in 3M to 2Y during the period from ZIRP across the tightening cycle and into the recent start of FOMC easing. The move to a peak slope of +191 bps in April 2022 then saw the plunge to -151 bps before the move to the current -39 bps. The 3M to 2Y hit +4 bps in January before the sharp drop in 2Y along the way to a YTD decline of -32 bps.

We wrap this week’s State of Yields with an update of the running UST deltas since March 1, 2022 just ahead of the end of ZIRP (effective 3-17-22). We include the 12-31-20 UST curve and 10-19-23 peak UST curve as frames of reference.
See also:
Footnotes & Flashbacks: Asset Returns 5-18-25
Mini Market Lookback: Tricky Ingredients, Shifting Moods 5-18-25
Industrial Production April 2025: CapUte Mixed but Time Will Tell 5-15-25
Retail Sales April 25: Shopping Spree Hangover 5-15-25
Credit Spreads: The Bounce is Back 5-13-25
Footnotes & Flashbacks: Credit Markets 5-12-25
Footnotes & Flashbacks: State of Yields 5-11-25
Mini Market Lookback: When in Doubt, Get Forcefully Ambiguous 5-11-25
US-UK Trade: Small Progress, Big Extrapolation 5-8-25
Tariffs: A Painful Bessent Moment on “Buyer Pays” 5-7-25
Credit Snapshot: PulteGroup (PHM) 5-7-25
Trade: Uphill Battle for Facts and Concepts 5-6-25
Credit Snapshot: Toll Brothers 5-5-25
Mini Market Lookback: Inflated Worry or Slow Train Wreck? 5-3-25
Payrolls April 2025: Into the Weeds 5-2-25
Payroll April 2025: Moods and Time Horizons 5-2-25
Construction: Singing the Blues or Tuning Up for Reshoring? 5-1-25
Employment Cost Index 1Q25: Labor is Not the Main Worry 5-1-25
1Q25 GDP: Into the Investment Weeds 4-30-25
PCE March 2025: Personal Income and Outlays 4-30-25
1Q25 GDP Advance Estimate: Roll Your Own Distortions 4-30-25