
Mini Market Lookback: Tricky Ingredients, Shifting Moods
The China-US truce amped up the market, but it ended with the last Aaa rating exiting stage left. On to the reciprocal tariff wild finish?


Sovereign ratings remind us that ingredient lists are not recipes.
The week started off with a bang on the China-US truce, so that was a tough act to follow in lining up moving parts for the week. The smoke cleared with materially tighter HY spreads and 11 of 11 S&P 500 sectors with positive returns (Footnotes & Flashbacks: Credit Markets 5-12-25, Credit Spreads: The Bounce is Back 5-13-25). In the S&P 500 sectors, Info Technology (+8.1%), Consumer Discretionary (+7.7%) and Telecom (+6.6%) stood out.
Even if the massive market relief is only tied to a pause, the China truce allowed the near-term disaster avoidance to take over the market for a few days. The concerns around freight and logistics meltdowns that would take months to fix, fear of empty shelves and supply-demand imbalances inflaming price action even more, and worries of potential supply retaliation from China (think generic drugs and pharma ingredients) can be set aside for a while as the market awaits the unilateral decisions from Team Trump on the other nations’ reciprocal tariffs where “negotiations” rarely took place.
The loss of the last US Aaa tier rating on the Moody’s downgrade struck us as anticlimactic given the obscenely adverse direction of sovereign metrics and dysfunctional governance that is much worse today than in 2011 (August) with the first downgrade. The question of “where do you go for risk free assets” is not as clear today as in the post-downgrade 2011 period when investors still piled into UST.
The macro picture today remains tenuous (see CPI April 2025: 1st Inning for Tariffs and CPI 5-13-25) as the color from industry trade commentary is telling an unfavorable story for what lies ahead in product and services pricing and cost trends. The April CPI release was favorable but comes with a big asterisk to “avoid extrapolation.” The final tariff numbers are not in the results yet and transaction effects take a while to work into the product chain.
After a pre-tariff buying binge, the question around industrial production rates into the summer are under a tariff cloud with some cost or pricing shocks lurking for many buyers. We saw some mild sequential weakness for April in manufacturing capacity utilization, and the variable of how supplier chains could rattle industrial production will get more interesting very quickly this summer (see Industrial Production April 2025: CapUte Mixed but Time Will Tell 5-15-25).
Consumer sentiment took a fresh headline beating this week with the UMich sentiment survey turning in the second lowest number (50.8, down sequentially from 52.2) and just above the all-time lows of June 2022. The survey included a fresh rise in short-term inflation expectations (next year) to 7.3% from 6.5% and long-term (next 5 years) to 4.6% from 4.4%. The survey inflation seems to reflect neuroses more than economics, but they hammer home the hypersensitivity of the consumer to inflation right now with 2022 a fresh memory compounded then by Russia invading Ukraine. Getting to 7.3% would entail horrible policy “misfires.” To this point, the run rate of household consumption reflects the traditional propensity to spend (see Retail Sales April 25: Shopping Spree Hangover 5-25-25).
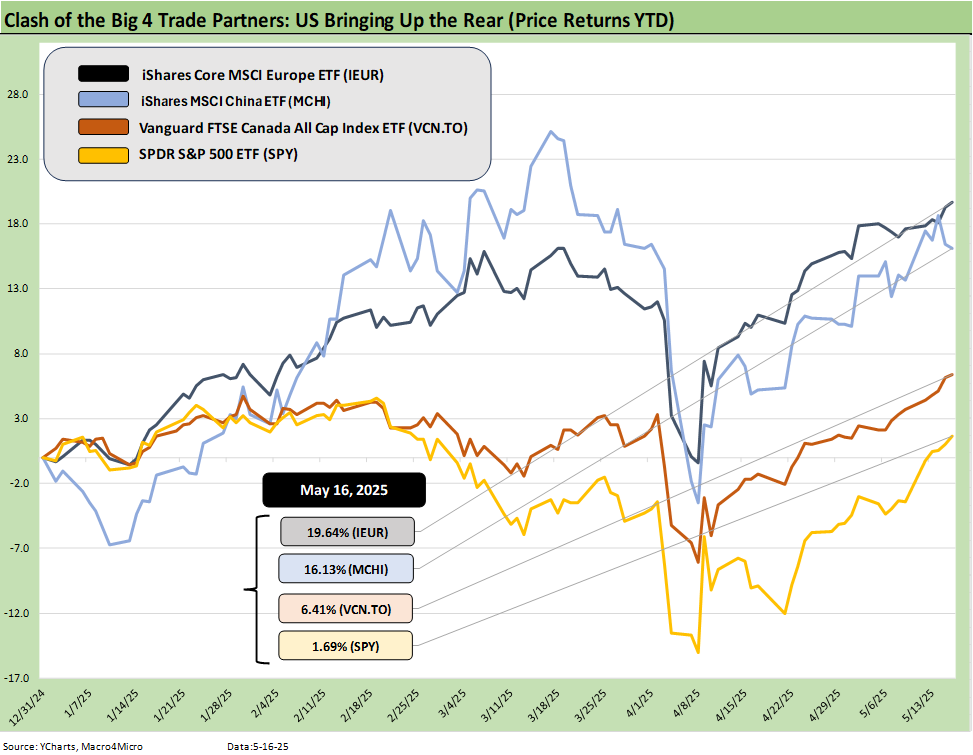
The above recurring chart shows the YTD 2025 returns for 4 equity market ETF benchmarks across 4 developed market trade partners who are currently clashing over tariffs. We plot benchmarks for the US, China, Europe, and Canada. As an emerging market, we thought Mexico did not fit into the framework.
The situation unfolding with China was a trade war while the others are trade battles for now. The US-China relationship could in theory return to a full trade war as the pause and negotiations unfold. The chart shows the S&P 500 ETF (SPY) breaking back into positive range but well behind Europe and China and modestly behind Canada.
For the week, the big rally after the China truce ended with the last event being the loss of the last Aaa tier ratings for the US. The agencies can politely reference systemic borrowing metrics and budget shortfalls and borrowing demands, but a safe assumption is that the problems in the headlines every day are what usually tip rating agencies to move (deny as they may). That is a topic for another day, but the latest round of turmoil gave Moody’s the opportunity to finally act. Bessent called Moody’s action a lagging indicator. We would agree since it was long overdue. All the sovereign debt metrics will be worse a year from now.
Sovereign ratings on high income countries still less about real default history…
Sovereign rating criteria of high-GDP countries in substance lack a true actuarial history in the “modern world” even if when to start the “modern capital markets” can set off a debate without end (Post asset management deregulation and rise of mutual funds? Postwar (WWII)? Post-Depression? Post-revolution after colonials went hat in hand to Europe for loans?).
Sovereign debt sustainability and credit analysis got very busy when the US bank system was way over its skis in Latin America in the 1980s. Borrowing in dollars to reinvest in local currency economies (or Swiss bank accounts) had a very different set of trigger points that led to considerable rescheduling and haircuts along the way. Currency mismatches can also be a death knell. We got tastes of that in the 1997-1998 Asian debt crisis.
We picked over a lot of these topics in earlier pieces and prior lives when May 2010 (Greece) to July 2012 Draghi “whatever it takes” saw some wild rides that spilled into USD risk assets. It is notable that those risk variables were being evaluated against the backdrop of a recent systemic panic in late 2008 and growing awareness of unbridled derivative counterparty risk exposure during the structured credit excess.
Back in 2011 in the first US downgrade (S&P), anything sovereign would be seen as jumping the road to set the banks on fire. That would in turn blow up credit markets periodically and drive spread waves (June 2010 pain, Oct 2011 HY OAS peak, etc.). It was always a short walk to credit contraction fears.
The eurozone sovereign crisis and the US initial downgrade set off quite a stir, but we see the effects of those events as well digested and analyzed to death over the cycles since then. The awareness is high that systemic debt levels just using UST borrowing have gone from bad to worse since the bipartisan balanced budget of the Clinton years. What is new is a trade war, record borrowing needs, dollar fears, and stagflation risk not seen since the 1980-1982 double dip. We did not face that in 2011-2012.

After a while, updating the history gets boring since it keeps ending up as a recurring sovereign debt version of “WTF” (see US Debt % GDP: Raiders of the Lost Treasury 5-29-23). Debt to GDP over 100% eventually dulls the senses, but the interest expense meter is running.
Trump still holds the 2Q20 record at 132%, but he had to absorb the massive stress of COVID in 2020 and resulting haircut to the denominator (GDP) in 2Q20. That came over 2 years after his record tax cut was flowing into the fiscal shortfall in 2018-2019. The heavy spending on relief sent debt much higher (Trump had two relief plans signed in 2020, Biden had one in 2021).
Biden went off the rails in stimulus (he at the very least overreached) and had his tax increase plan shot down. The initial Biden tax plan that he was trying to get in place before the final version was watered down bordered on utterly value destructive and anti-growth (in the eyes of this lifelong Democrat and someone who started, ran, and sold a small business). The early version of the Biden plan included eliminating capital gains tax and making it ordinary income. There was also talk of taxing unrealized gains among other disincentives. With the step up in spending (some very positive for the economy), the Debt % GDP rise kicked back into gear as stimulus was rolling along.
We don’t need to revisit all that history, but the most aggressive tightening cycle since the early 1980s came in 2022 (see UST Moves 1978-1982: The Inflation and Stagflation Years 10-18-23). We highlight that 1994 was no picnic as a bear flattening and upward shift did some damage (see Bear Flattener: Today vs. 1994 and Aftermath 10-18-22), but 2022 was ugly even if it brought no recession with low unemployment and high consumption on the PCE line (see Unemployment, Recessions, and the Potter Stewart Rule 10-7-22).
We now enter an all-new period where stagflation is a real risk for the first time since I got off the train in NYC in June 1980 (22% Misery Index that month). The bottom line is that the systemic debt levels would be easier to rationalize by the rating agencies if the country was not facing what we all have been sorting through for weeks. Without the excesses of the tariff plan and threats to payrolls and pricing structures at the same time, the Fed would have a lot more clarity and ability to act. Similarly, companies could plan with confidence in the underlying economics of projects whether it be capex-driven expansion or strategic M&A.
With a reliable view of where tariffs are headed, small businesses could take more risk (expansion of capacity, hiring, growing IT budgets more aggressively, etc.). What we get instead is Trump yelling at the Fed and yelling at Walmart for handling the challenges that thousands of small businesses also face. What Trump needed to do is more due diligence on his tariff plans that from the beginning lacked tactical targeting and a rational economic framework (e.g. buy pays customs the tariff, not seller). We’ve been covering those topics in ongoing tariff commentaries (see Mini Market Lookback: When in Doubt, Get Forcefully Ambiguous 5-11-25).

The above chart updates the 1-week and 1-month credit spread deltas for IG and HY and the credit tiers from BBB to CCC. Celebration was justified on the China news (see Credit Spreads: The Bounce is Back 5-13-25), but in sports terms, there are a lot more games ahead to work through the tariff game theory challenges.
The above chart certainly shows a very impressive 1-month run in spreads to bring HY OAS levels back to the early Oct 2018 cyclical lows. That is still well above the June 2007 lows the HY market had been approaching before the tariff chaos (Spread Walk: Pace vs. Direction 12-28-24). The reciprocal tariff damage was material (see Tariffs: Diminished Capacity…for Trade Volume that is… 4-3-25), and a China truce was critical. Getting back under the 300 bps line would be over the top exuberance given the mix of risks ahead. That said, we were below this recently.
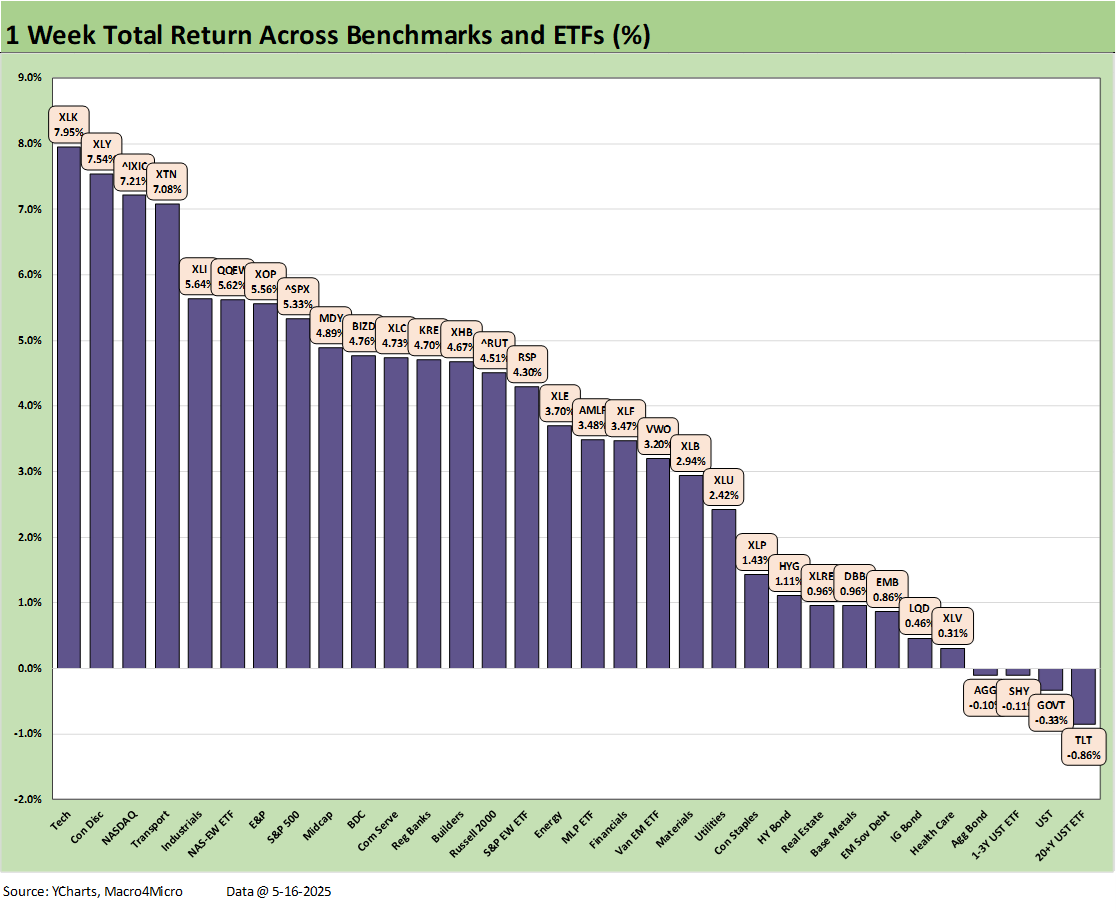
The 28-4 score the past week makes a clear statement on the China reaction. It took almost a +5.3% return on the week to make it into the top quartile in the above chart. The UST move saw 4 bond ETFs make up the small number of negative return lines.
The top 3 winners were tech-centric and #4 was the long-suffering Transport ETF (XTN), which rallied for obvious reasons. We see the Industrials ETF (XLI) at #5 as many supplier chains serving the US industrial base will not be decimated just yet.
The simplicity of the political themes often neglects how many suppliers to the US have “suppliers to the suppliers” based in China and thus have China content. A relative handful of component shortages along the Tier 1, 2, and 3 chain can disrupt entire finished goods production lines. A Tier 1 supplier can be very vulnerable to a Tier 2 or Tier 3 supplier that faces financial stress.
Someone should ask Navarro if he ever read The Machine that Changed the World or any publications from the groups that gave rise to the term “Lean Manufacturing.” If not, he should. It is good to learn from experts in manufacturing as you try to blow them up. The Lean Enterprise Institute started up in the 1990s and has been training companies and managers for years. You would think some of those delivering unilateral tariffs would study the discipline first. If the Trump Team Tariff crew read any of it, they ignored it or failed to learn anything.
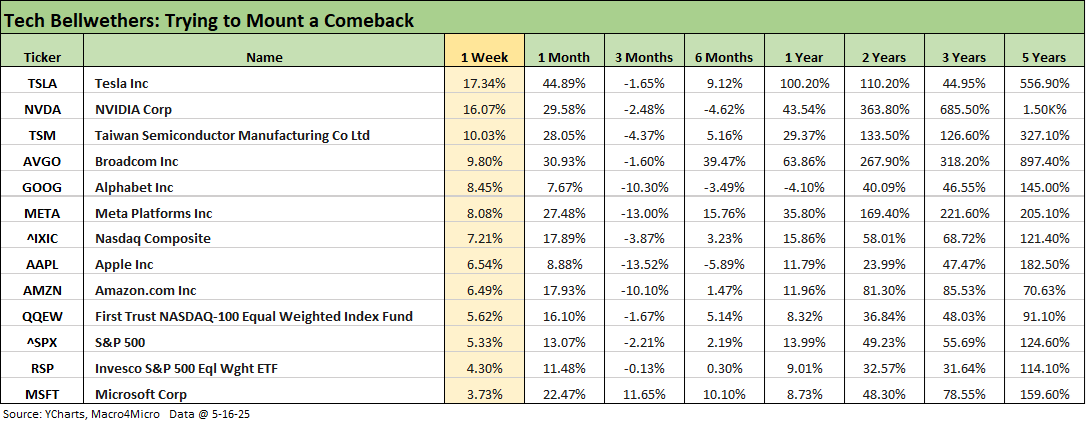
The above table updates the past week’s performance and a range of time horizons for the tech bellwethers in descending order of total return for the past week. The above shows a major rebound week. That said, we still see 6 of the Mag 7 in the red for the rolling 3 months and 3 of the Mag 7 in negative range for the rolling 6 months. MSFT is the winner for 3 months and Meta over 6 months.

The UST deltas for the past week are broken out above. The market seems to be giving up on a short- term Fed ease and we see that flowing into the shift higher in 1Y to 3Y. As of this latest print, the market is only around an 8% chance of a Fed easing in June with July at 34% per CME. If the China truce does not hold, the Fed will face some very tough decisions.

The above YTD UST deltas show the bull steepener that have put 6 of 7 bond ETFs in positive return range as we cover in the separate asset return Footnotes publication to be posted later.

The above chart updates the time series for the 10Y UST vs. the Freddie Mac 30Y mortgage benchmark that is updated weekly on Thursday at noon. The 6.81% (up from 6.76% on the week) reflects stubborn mortgage rates that have made life a challenge for homebuilders and the existing home sales market as we cover in our housing work. As of Friday close, we saw the separate Mortgage News Daily survey at over 6.9%.

The post-China-truce rally took HY OAS from +353 bps to +316 bps on the week for 37 bps tighter.

The “HY OAS minus IG OAS” quality spread differential compressed to +223 bps this week from +251 bps last week.

The “BB OAS minus BBB OAS” quality spread differential compressed from +89 bps last week to +70 bps this week.
See also:
Industrial Production April 2025: CapUte Mixed but Time Will Tell 5-15-25
Retail Sales April 25: Shopping Spree Hangover 5-15-25
Credit Spreads: The Bounce is Back 5-13-25
Footnotes & Flashbacks: Credit Markets 5-12-25
Footnotes & Flashbacks: State of Yields 5-11-25
Footnotes & Flashbacks: Asset Returns 5-11-25
Mini Market Lookback: When in Doubt, Get Forcefully Ambiguous 5-11-25
Credit Snapshot: PulteGroup (PHM) 5-7-25
Credit Snapshot: Toll Brothers 5-5-25
Mini Market Lookback: Inflated Worry or Slow Train Wreck? 5-3-25
Payrolls April 2025: Into the Weeds 5-2-25
Payroll April 2025: Moods and Time Horizons 5-2-25
Construction: Singing the Blues or Tuning Up for Reshoring? 5-1-25
Employment Cost Index 1Q25: Labor is Not the Main Worry 5-1-25
1Q25 GDP: Into the Investment Weeds 4-30-25
PCE March 2025: Personal Income and Outlays 4-30-25
1Q25 GDP Advance Estimate: Roll Your Own Distortions 4-30-25