
Credit Markets: Will the Heat Matter?
We saw limited repricing activity ahead of Labor Day, but tariff headlines should shake up scenario spinning as the FOMC meeting gets closer.

Note to readers: We recently made some format changes to our rolling credit market commentary. We wanted to streamline the chart count and text volume. For more of the history, please see Footnotes & Flashbacks: Credit Markets (8-18-25).
Another quiet week for credit spreads saw a modest move tighter for HY and a slight widening in IG set against a modestly weaker equity performance (see Footnotes & Flashbacks: Asset Returns 8-31-25, Mini Market Lookback: Tariffs Back on Front Burner 8-30-25). Quality spreads compressed modestly in the B and CCC tiers.
Overall the macro releases were balanced with PCE inflation manageable with a slight uptick in core and the income and outlays numbers constructive (see PCE July 2025: Prices, Income and Outlays 8-29-25). The second estimate of 2Q25 GDP showed a heavy weighting of favorable upward revisions even with the consumer sector still weak – but stronger than 1Q25 (see 2Q25 GDP: Second Estimate, Updated Distortion Lines 8-28-25).
As reviewed in earlier commentaries this weekend, the major setback for the Trump tariff game plan came with a 7-4 vote declaring them essentially illegal based on the fact that such actions are part of the constitutional duties of Congress (that Article 1 thing Trump tends to ignore). The decision would upend the Trump economic plan unless either SCOTUS overrules the Appeals Court or a blank check is legislated by Congress. The latter is more complicated than it sounds given the need to go nuclear on the filibuster. Furthermore, some GOP members are very uncomfortable with the scale of the tariff strategy.
The tariff news is good for many industries that face radical upheaval of their supplier chains and cost structures, and the FOMC can downgrade an inflation threat factor that had held them back and generated some easing anxiety. Many small businesses can breathe a sigh of relief. The challenge comes down to SCOTUS making their call and breaking the tradition of giving Trump whatever he wants.
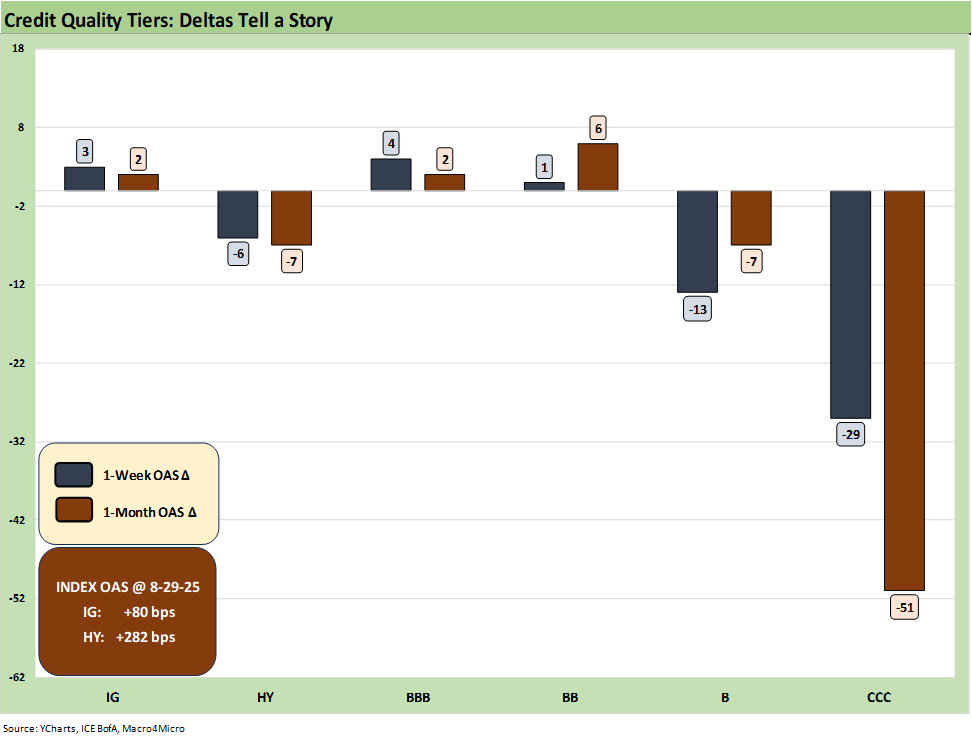
The above chart updates the 1-week and trailing 1-month spread deltas for IG and HY and from the BBB to CCC tiers. The risk pricing action was low on the week with quality spreads tightening from the B and CCC tier. As we cover below, HY OAS remains in the June 2007 credit bubble zone for spreads.
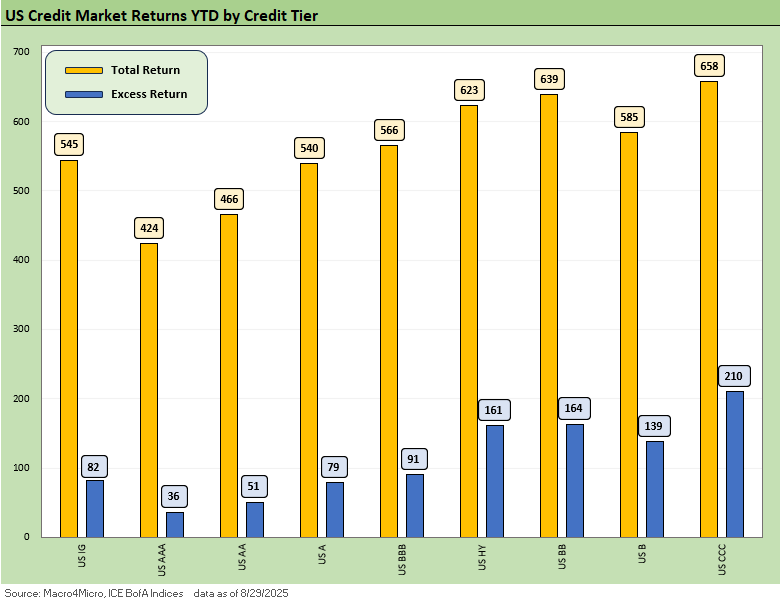
The above chart updates the YTD 2025 excess returns and total returns across IG and HY and the credit tiers. The support of the UST curve and spread compression is clearly reflected in the returns with the BB tier still the best positioned of the lot in the balance of credit risk and duration risk.
The CCC tier with its mix of coupons and shorter duration have framed up well in the bar chart but then that begs the question of how much better the excess returns in the CCC and weak B range should be given the magnitude of the risks relative to the BBB and BB tiers. The risk-adjusted debate tends to get obscured by the discussion of what is the right metric to make that assessment.
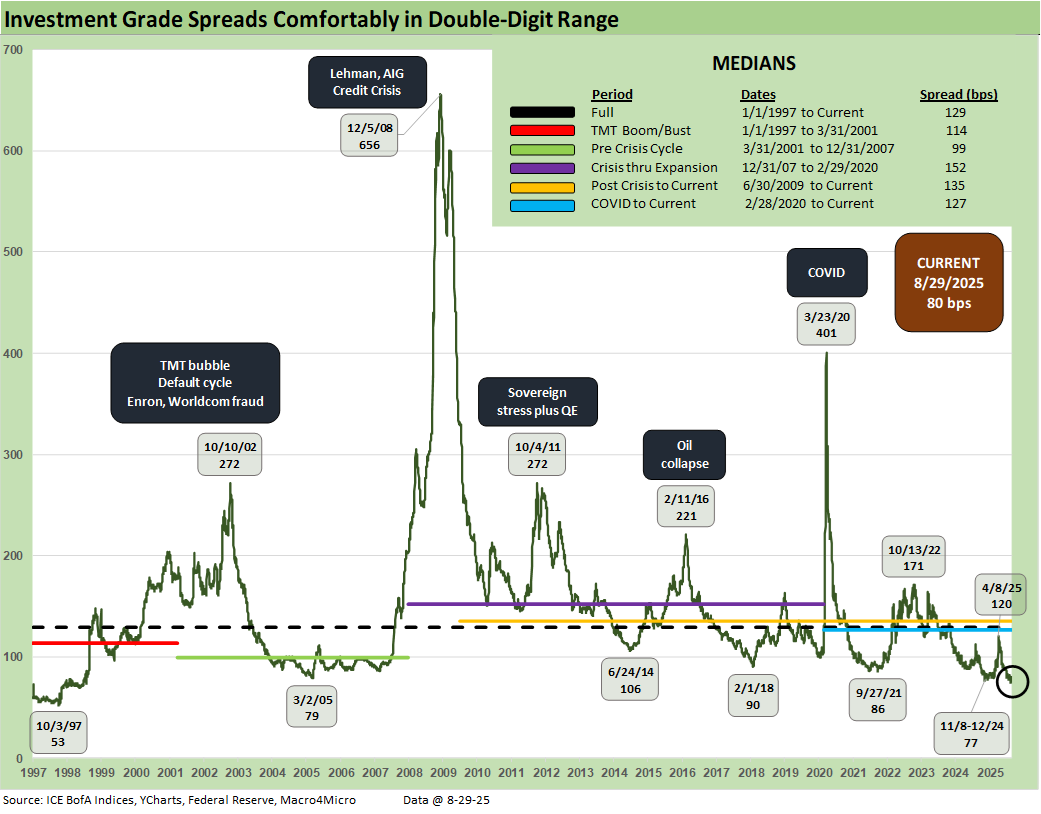
The above updates the multi-cycle spread history for IG as we see the wild swings across time when the banks were in harm’s way in 2008 and the heavy exposure to energy names whipsawed BBB energy in 2015 and early 2016.
The current +80 bps is just above the lows of late 2024 and the March 2005 levels just before the auto OEMs started taking a lot of heat with a GM warning in mid-March 2005. The record lows since 1997 were seen in early Oct 1997 just before the Asian Yankee bond market started to implode and the broader regional Asian crisis unfolded. Spreads in 1998 were infected and it had spread to other markets as 1998 saw a contagion effect hitting EM credit late in the year that also hit US HY valuations. That was the summer and fall of LTCM after the Russian default of Aug 1998.
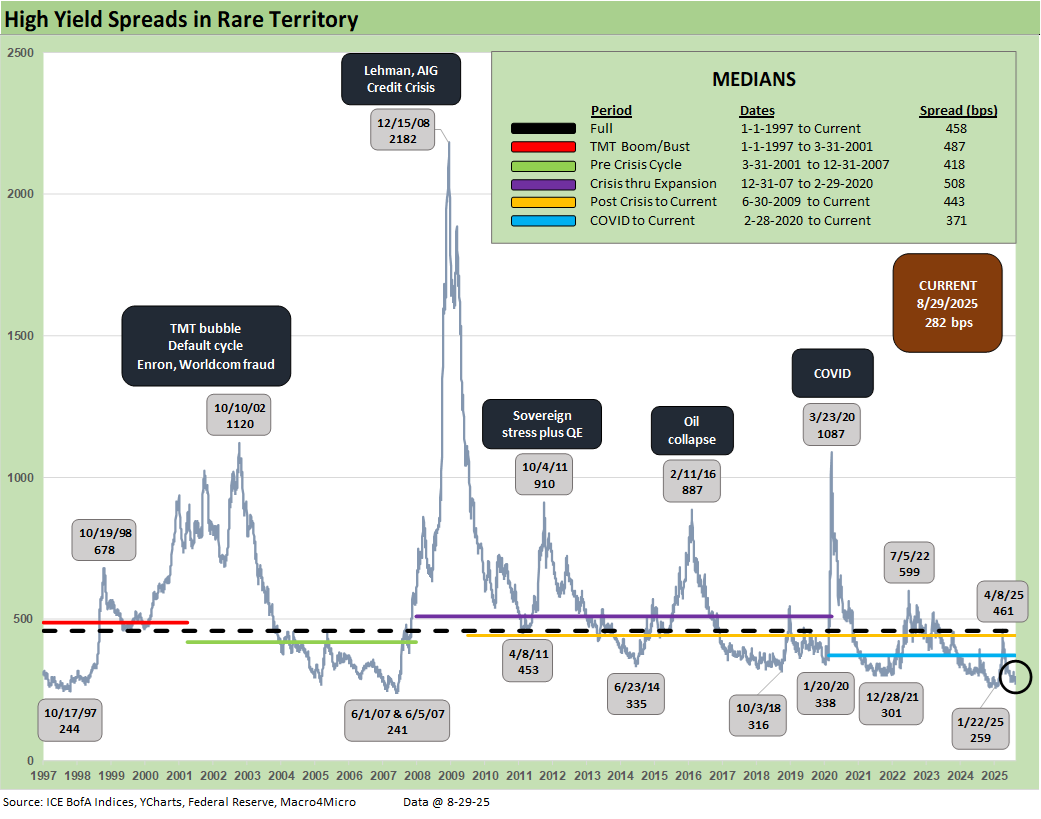
The sub-300 bps HY OAS returned after the Liberation Day panic eased. The +282 bps is inside the month-end spreads of June 2007 even if wide to the HY OAS tights seen at the start of June 2007 (+241 bps).
Today’s HY market presents a much healthier credit mix than in June 2007 when LBOs had gone off the charts and were partly funded with HY bonds. In the current market, those highly leveraged transactions have migrated over to private credit. That still means the +241 bps is like a brass ring to HY funds today. The HY bond index default cycle is very much in check. The distress and exchange actions will be weighed more heavily (and quietly) over in private credit as the year plays out.
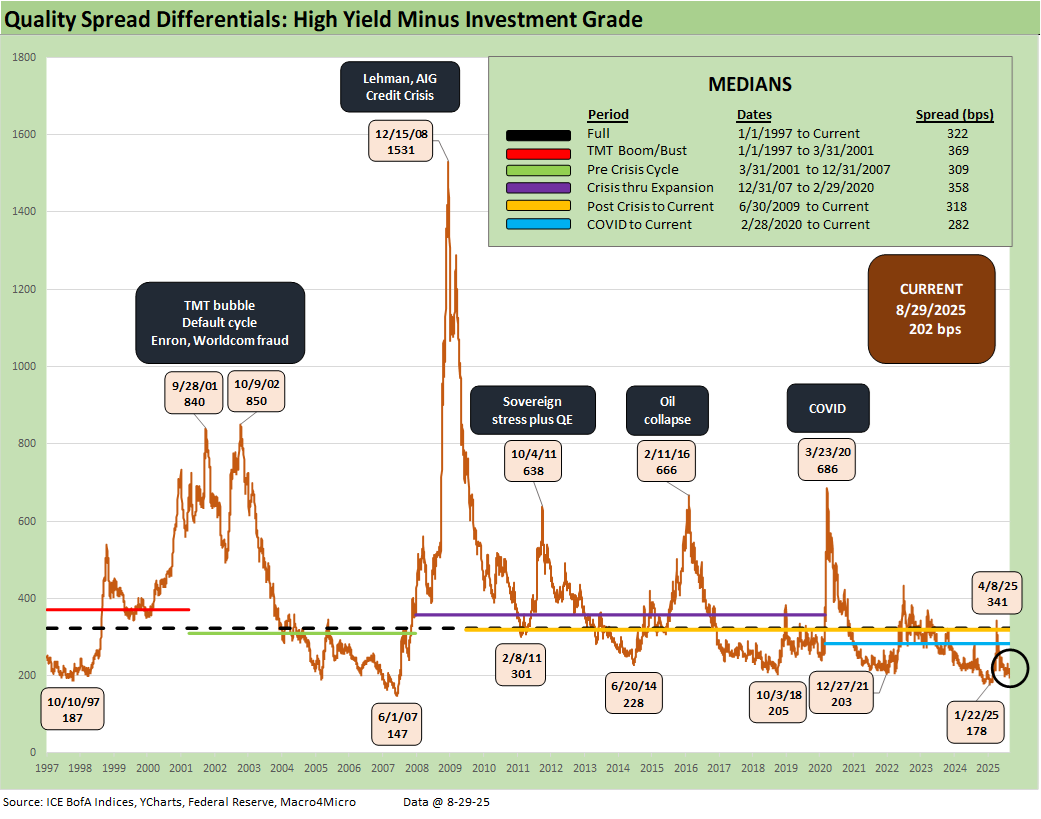
The “HY OAS minus IG OAS” quality spread differential of +202 bps is above the tights of +178 bps seen in Jan 2025 and materially higher than the +147 bps in June 2007. The +202 is more in line with credit cycle mini-peaks such as June 2014, Oct 2018, and Dec 2021.
We see the peak of +341 bps after Liberation Day vs. a long-term median of +322 bps. Most of the cyclical timeline medians noted in the box had 300-handles, so this trend overall highlights that quality spreads are offering low compensation for moving down the credit tiers.
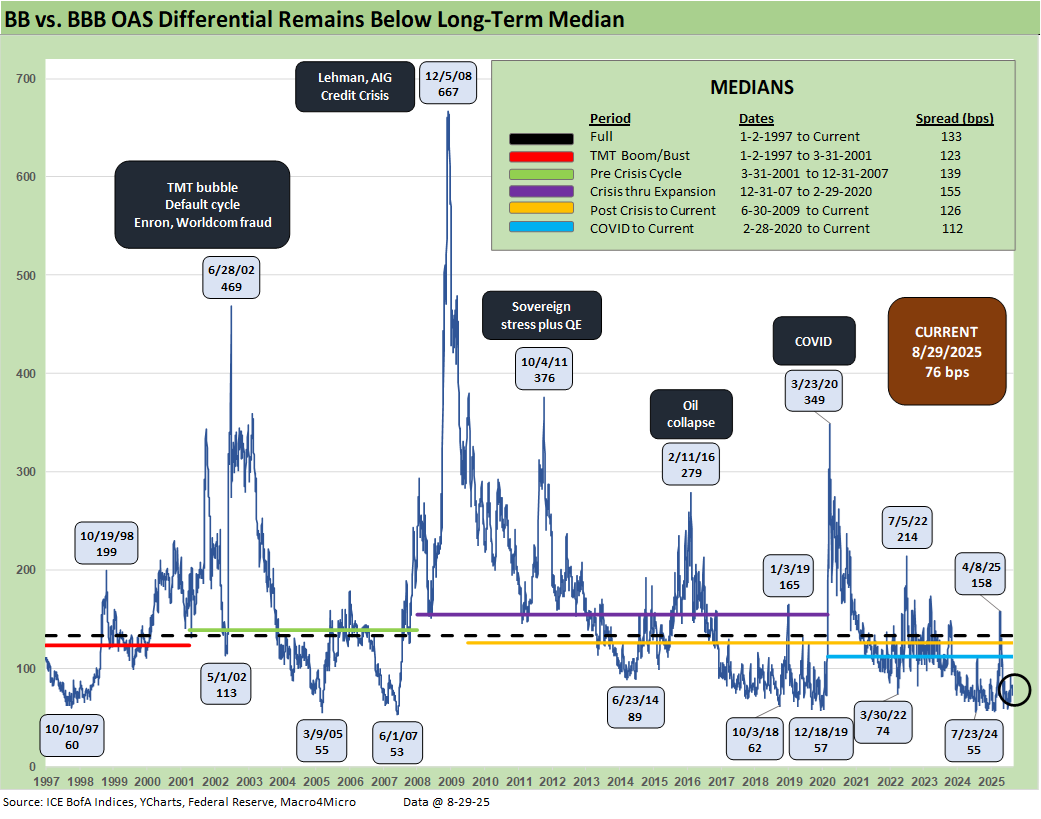
The “BB OAS minus BBB OAS” quality spread differential is back in double digits after spiking to +158 bps after Liberation Day. The long-term median of +133 bps is consistent with the median across the credit cycles detailed in the box.
The current cycle has routinely hit “lower lows” than the current +76 bps with 50-handles seen at numerous points. The low tick was June 2007 at +53 bps.
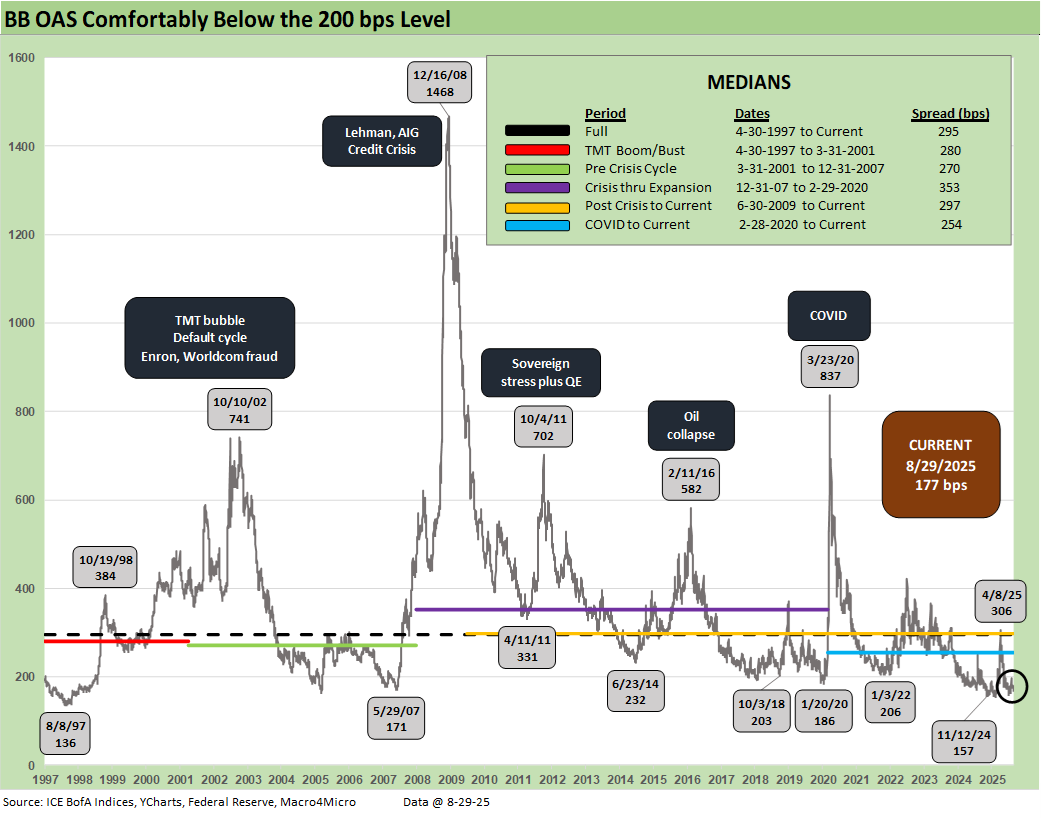
The above plots the time series for the BB tier across the cycles. The current sub-200 bps level of +177 bps is impressively tight, but we were lower in 4Q24 at +157 bps. The long-term median of +295 bps is in a different zip code.
The demand for BB tier bonds has seen BBB buyers, HY lite strategies, and defensive HY funds all looking to this tier that ranks as by far the largest in HY. The strategy has worked as we covered earlier in excess and total returns across the tiers. The BB tier has been a good way to take credit risk while managing duration exposure and still carrying a respectable coupon.
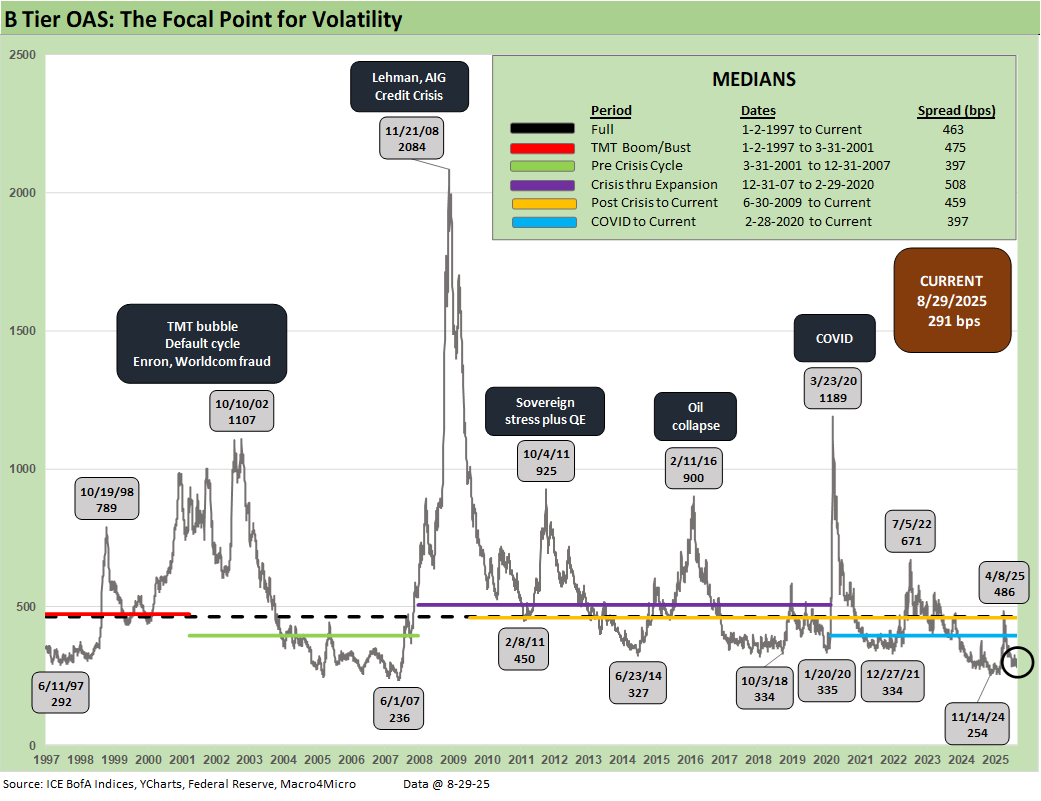
The B tier is the sweet spot and home of the “HY Classic” investor. We see the current level at +291 bps back inside the +300 bps line. B tier OAS had reached a post-2007 low of +254 bps in Nov 2024 before the Liberation Day fallout drove the B tier OAS to +486 bps. The long-term median stands at +463 bps. This current cycle’s median at +397 bps is the lowest of the mini-cycle medians presented in the chart. It is well below the mid to high 400 handles seen in most with the exception of the post-crisis (Dec 2007 to Feb 2020) median which crossed above the 500 range to +508 bps.
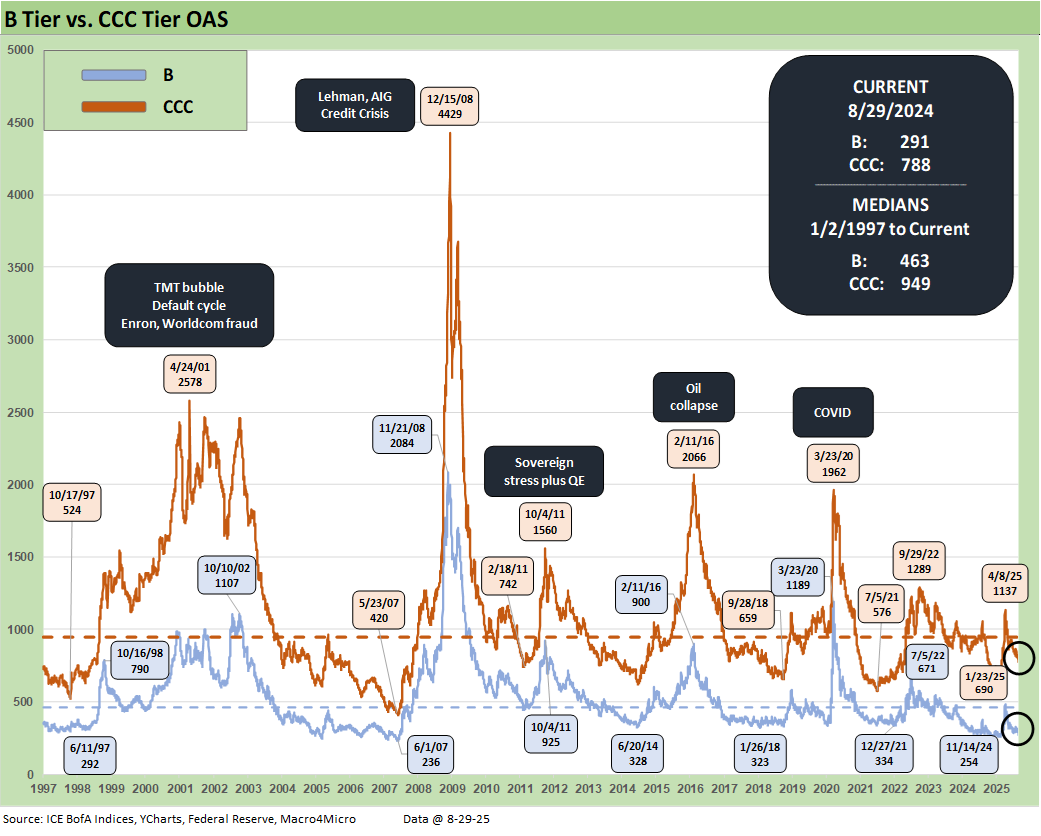
The above time series plots the wildest ride across the cycles seen in the B and CCC OAS levels. Both credit tiers are dramatically below their long-term medians. The post-crisis spread spike is ranked in a world of its own given the bundle of risks including a collapse of market makers and secondary liquidity. The TMT cycle default wave and liquidity implosion saw multiple spread peaks in 2001 and 2002 that were especially ugly.
The sovereign panic of fall 2011 is in evidence as was the overexposure and E&P excess of 2015 to early 2016 on the collapse of oil and gas as the cash flow burn and valuation crisis dominated the upstream sector.
COVID saw a wave of supportive monetary policy and fiscal actions, so the energy sector HY crisis peak OAS in early 2016 was wider in spreads than those seen at the 3-23-20 COVID highs.
During COVID, the return to ZIRP and the “great reopening” of the economy and markets bolstered risk appetites and generated record refinancing and extension volume. In turn, that materially reduced refinancing risk (thus default risk) and lowered coupon costs from IG to HY.
The ZIRP backdrop also eased ABS costs and bank line costs. Under some of the Fed legislation and control moves being discussed in the current market, that support seen in earlier credit panics would not have happened. If the Fed loses such tools, that would mean the White House would pick winners and losers (i.e. friends vs. enemies). Control of the Fed would offer the White House vastly more financial power than it has now to “influence” (intimidate? control?) borrowers and lenders alike.
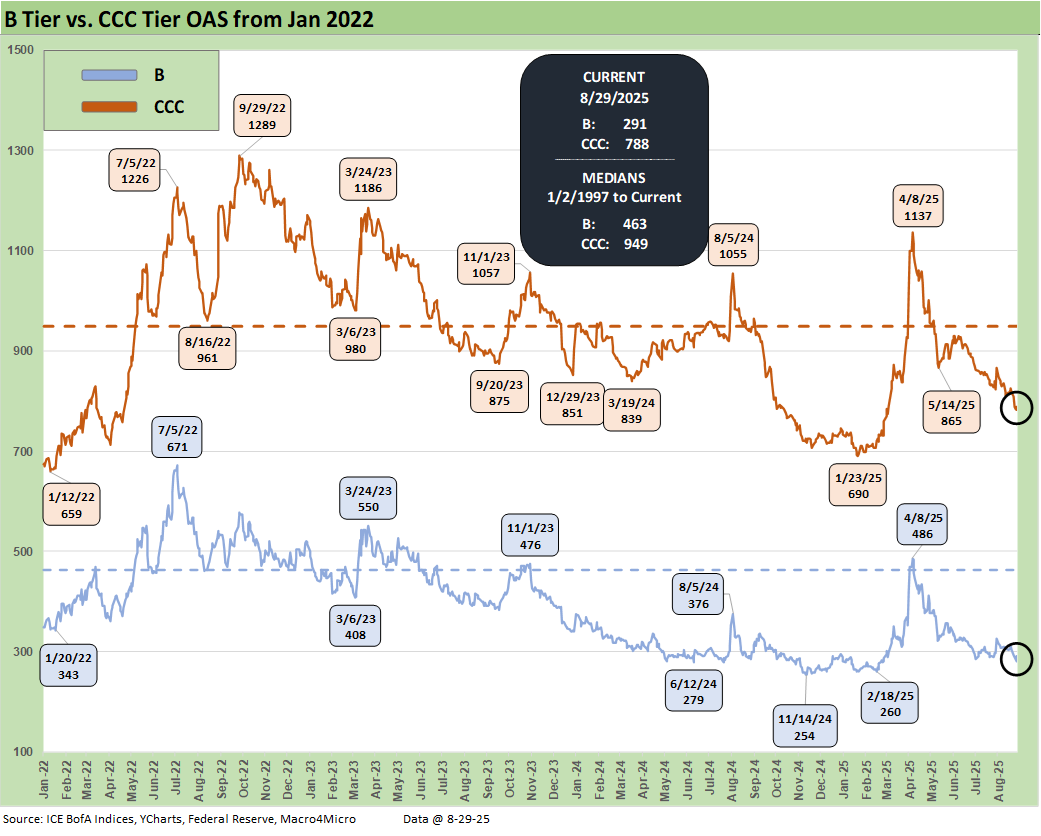
The above offers a more granular visual of the B vs. CCC OAS since the start of 2022 to get a read on how credit pricing moved across the tightening cycle on the way to easing mode. In the end, there was no recession and no ugly default wave. Inflation and rates came down quickly from the June 2022 peaks. CCC spreads peaked in Sept 2022 and B tier spreads in early July 2022.
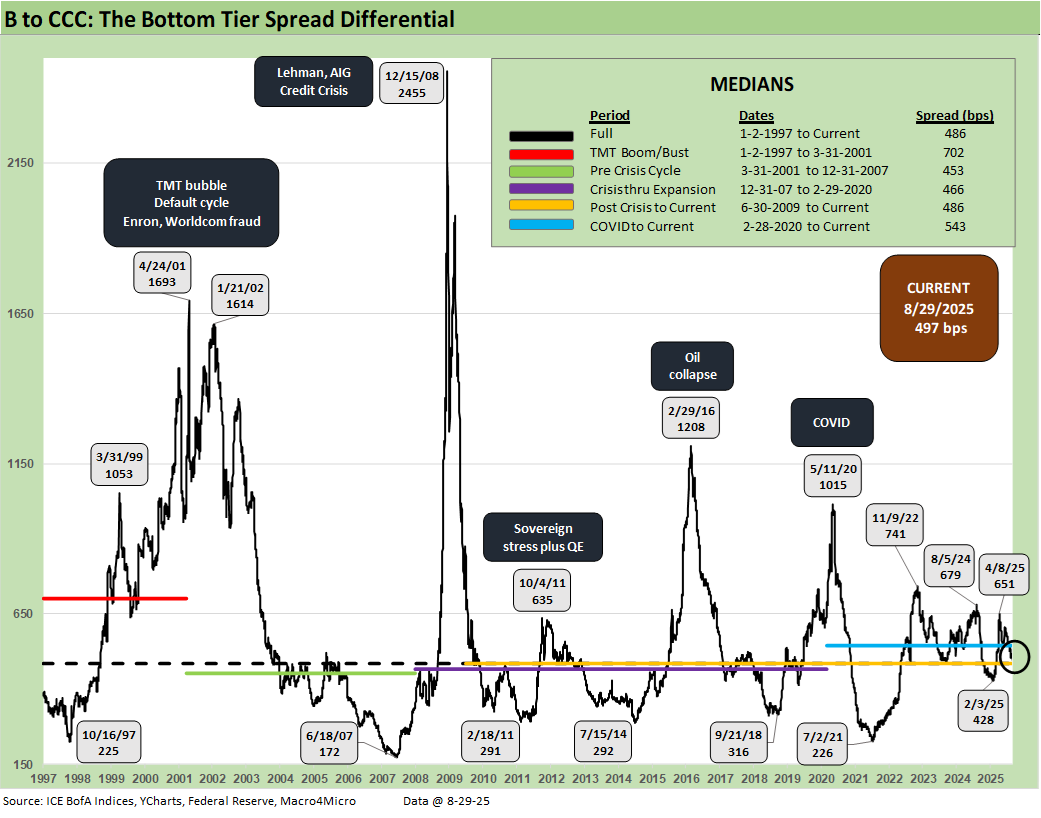
The above quality spread differential for B vs. CCC tells a simple story. In times of macro stress, HY secondary liquidity panics (fear of fund redemption waves, etc.) and quality shocks where the HY index has industry concentrations (e.g. TMT, Energy), the CCC tier quickly sees credit risk turn into the equivalent of equity risk and even high-risk equities. That means bond pricing is expected to offer returns commensurate with that status. That is when the action is about dollar prices and not spreads.
Trying to gauge the credit risk, the default risk, the loss-given-default pricing component, the secondary liquidity penalty, the structural risks of the governing documents, and the recovery value and time horizon risks (30 days on CDS, post workout the emergence, etc.) is where the distressed commandos and seasoned vets come in.
The quantitative modeling can sometimes take on the nature of “weird science” or “fake science” while the classic distressed investor typically has the experience and legal inputs to navigate such markets. Assumptions can always be wrong, but there are histories and templates that those players tap into.
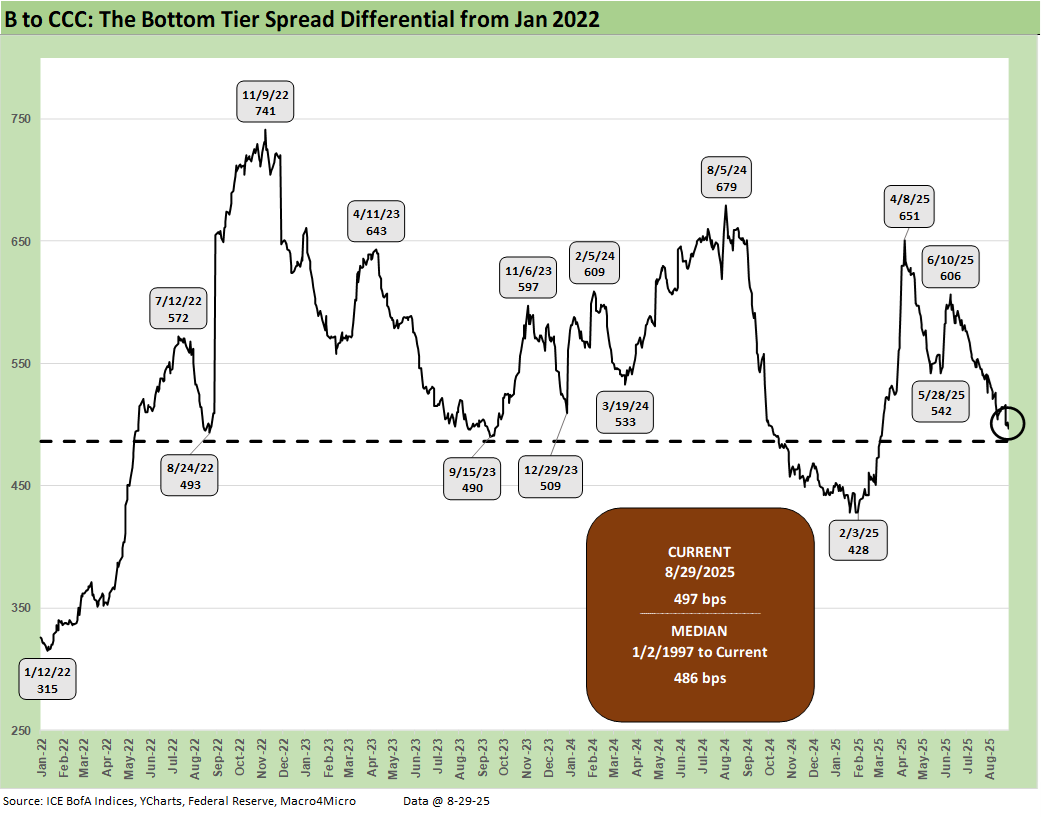
The above chart just shortens up the time horizon for the B vs. CCC quality spread differential history for the period from Jan 2022 through current times to capture both the tightening cycle, the start of easing, and the new world of tariffs.
We see peak quality spread differentials at +741 bps in Nov 2022, up from +315 bps at Jan 2022. We are currently at +497 bps, above the long-term median of +486 bps. As a reminder, many market watchers were screaming recession in the fall of 2022. We did not see it that way (see Unemployment, Recessions, and the Potter Stewart Rule 10-7-22).
There was plenty to worry about back in 2022 and Russia-Ukraine was not helping on that front with an energy price spike. Consumer spending was still solid, and employment was strong. The yield curve was of course a mess. However, it takes a lot to cause a recession (see Macro Menu: There is More Than “Recession” to Consider 8-5-25). After the tariff legal decision of last week, we believe economic risks will be lower if that Appeals Court decision can hold up against the SCOTUS “friends of Trump.”
See also:
The Curve: Risk Tradeoff - Tariffs vs. UST Supply 9-1-25
Footnotes & Flashbacks: Asset Returns 8-31-25
Mini Market Lookback: Tariffs Back on Front Burner 8-30-25
PCE July 2025: Prices, Income and Outlays 8-29-25
2Q25 GDP: Second Estimate, Updated Distortion Lines 8-28-25
Avis Update: Peak Travel Season is Here 8-27-25
Durable Goods July 2025: Signs of Underlying Stability 8-26-25
Toll Brothers Update: The Million Dollar Club Rolls On 8-26-25
New Home Sales July 2025: Next Leg of the Fed Relay? 8-25-25
Credit Markets: Dull Week for Spreads 8-25-25
The Curve: Powell’s Relief Pitch 8-24-25
Footnotes & Flashbacks: Asset Returns 8-24-25
Mini Market Lookback: The Popeye Powell Effect 8-23-25
Existing Home Sales July 2025: Rays of Hope Brighter on Rates? 8-21-25
Home Starts July 2025: Favorable Growth YoY Driven by South 8-19-25
Footnotes & Flashbacks: Credit Markets 8-18-25
Herc Holdings Update: Playing Catchup 8-17-25
Mini Market Lookback: Rising Inflation, Steady Low Growth? 8-16-25
Industrial Production July 2025: Capacity Utilization 8-15-25
Retail Sales Jul25: Cautious Optimism in the Aisles 8-15-25
PPI: A Snapshot of the Moving Parts 8-14-25
CPI July 2025: Slow Erosion of Purchasing Power 8-12-25
Iron Mountain Update: Records ‘R’ Us 8-11-25
Mini Market Lookback: Ghosts of Economics Past 8-9-25
Macro Menu: There is More Than “Recession” to Consider 8-5-25
Mini Market Lookback: Welcome To the New World of Data 8-2-25
Happiness is Doing Your Own Report Card 8-1-25
Payrolls July 2025: Into the Occupation Weeds 8-1-25
Employment July 2025: Negative Revisions Make a Statement 8-1-25
Employment Cost Index 2Q25: Labor in Quiet Mode 7-31-25
2Q25 GDP: Into the Investment Weeds 7-30-25
2Q25 GDP: First Cut of Another Distorted Quarter 7-30-25
United Rentals: Cyclical Bellwether Votes for a Steady Cycle 7-29-25