
Footnotes & Flashbacks: State of Yields 5-11-25
A quiet, slightly adverse week for yields with Trump again annoyed by Powell stating the reality of tariff policy risks.


Tariffs never sleep, kid!
The week saw a mild upward move in rates in the midst of a lot of qualitative headlines in tariff world from China to the UK.
The attempt to sell the “new math” for turning higher expenses and tighter supply into lower prices and greater wealth continues. The main challenge will be convincing supply and demand to go along with the idea.
Tariff plans proliferate with another Section 232 rolling into action this past week with commercial aircraft, engines, and parts in a mix that will create more room for clashes. For now, the market awaits more infill on the China talks and where the inventory meltdown is heading for supply-demand imbalances.
The Fed is still not getting on board until they see some evidence on prices and employment in their dual mandate watchdog role.

The above chart plots some key cyclical transition periods from the Carter inversion of 1978 across the Volcker years, the credit cycle peak in 1989, the TMT cycle in 2000, and the housing bubble in 2006. The chart then jumps from 2006 to 2023 beyond the crisis period and the ZIRP years when the market saw QE and normalization distortions. We use the Oct 2023 UST peak date on the 10Y UST. The UST rates now are very low by any historical standard but well off the Sept 2024 lows as we lifted off from the initial easing into another steepener.

The above replays our weekly chart detailing the migration of the UST curve from 12-31-21 with memory boxes detailing the tightening dates and magnitude and more recently the easing. The UST curve seems to intermittently mix bear steepening patterns and flattening rallies since the Sept 2024 lows, but market fear was creeping into the shapeshifting after Liberation Day before calming down with the pause.
The market awaits more color on where the China-US talks might play out as inventory levels run down and the lower volumes of high tariff China supplies show up in ports on a dwindling number of containers. US-China compromise is critical to avoid more shocking disruptions and economic fallout.
We get a fresh CPI reading this week along with another read on Retail sales. But the main events still lie ahead as tariff headlines translate into transaction level costs that will need to get absorbed along the economic path. That path runs from the order to the delivery and tariff at the border and then on into the production or distribution chain. That of course all comes after the importer pays the tariff to customs –no matter how the White House seeks to obfuscate the obvious (see Tariffs: A Painful Bessent Moment on “Buyer Pays” 5-7-25).
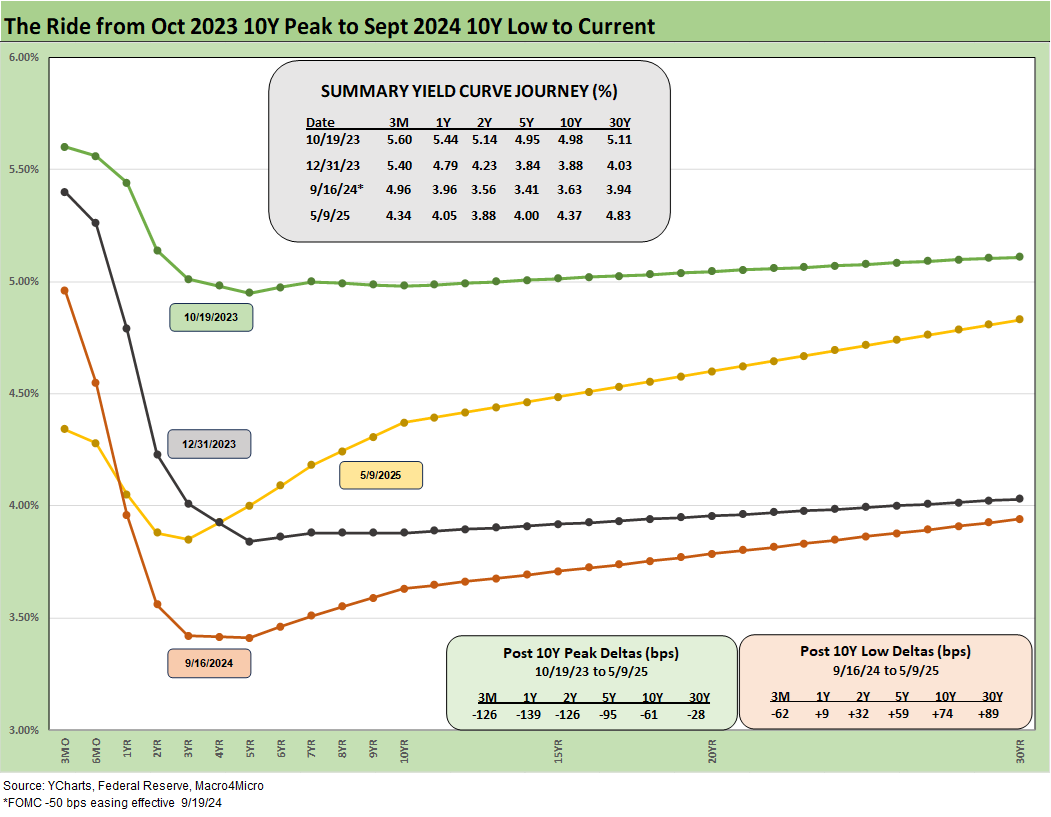
The above chart details the material move from the peak UST curve of 10-19-23 down into the UST bull rally of Nov-Dec 2023 and then eventually into the lows of Sept 2024. The Sept 2024 low tick only came after a bear steepener hit the curve through the summer of 2024. We then moved back into the bear steepener mode until the tariffs roiled the UST markets and initially sent 2Y to 30Y lower on cyclical fears.
Rate volatility moved materially higher with the tariffs, and the policies sent the markets into fresh debates on UST supply-demand running alongside nerves around dollar weakness in the global markets. The ensuing chaos and UST and USD volatility drove a Trump reciprocal tariff pause (see Footnotes & Flashbacks: State of Yields 4-13-25). For now, the “trade deals” are more noise than resolution in the 90-day window.
Even the UK “deal” came with a trade partner where the US had a Goods surplus the past decade and the terms of the “deal” are more a framework sketch than an agreement with some very big moving parts still rolling out and pharma in the queue (see US-UK Trade: Small Progress, Big Extrapolation 5-8-25).

The above chart updates the UST deltas for the past week. The result was a modest negative for the bond ETF return performance with 5 of 7 in the red (see Footnotes & Flashbacks: Asset Returns 5-11-25).

The above chart updates the YTD 2024 UST deltas with the bull steepener helping keep all the bond ETFs in positive range with 1 bond ETF in the YTD top quartile and 5 of the 7 in the 2nd quartile and 1 just across the line at the top of the 3rd quartile (see Footnotes & Flashbacks: Asset Returns 5-11-25).

The above chart updates the UST deltas since the 9-16-24 lows that came alongside the easing. That has not worked as many market watchers predicted on the shape of the UST curve and number and pace of easing that was supposed to follow. While Trump rails at the Fed and Powell, the FOMC would be easing if it was not for Trump’s over-the-top and unprecedented tariff game plan.
That “tariff plan” would be the tariff plan where the “seller pays” and the US is “taking in billions and billions” from other countries. That of course is not what is happening. That all makes for a very strange backdrop when the Cabinet has to fall in line with that version and it becomes more about partisan loyalty and ideology than about facts and concepts. The game plan seems to be to keep the action and pace high and uncertainty higher.

The above chart updates the UST deltas from the end of 2023 after a massive rally in rates and risk in Nov-Dec 2023. The follow-on in 2024 expected by the consensus mildly disappointed the UST bulls in the number of FOMC cuts but was well off relative to the expectation of a material bull flattening during 2024 when a bear steepener prevailed by the end of the year. The 2025 battle has been an ebb-and-flow pattern, but bonds have been reasonable performers in multiasset class context – which is not saying much YTD 2025.
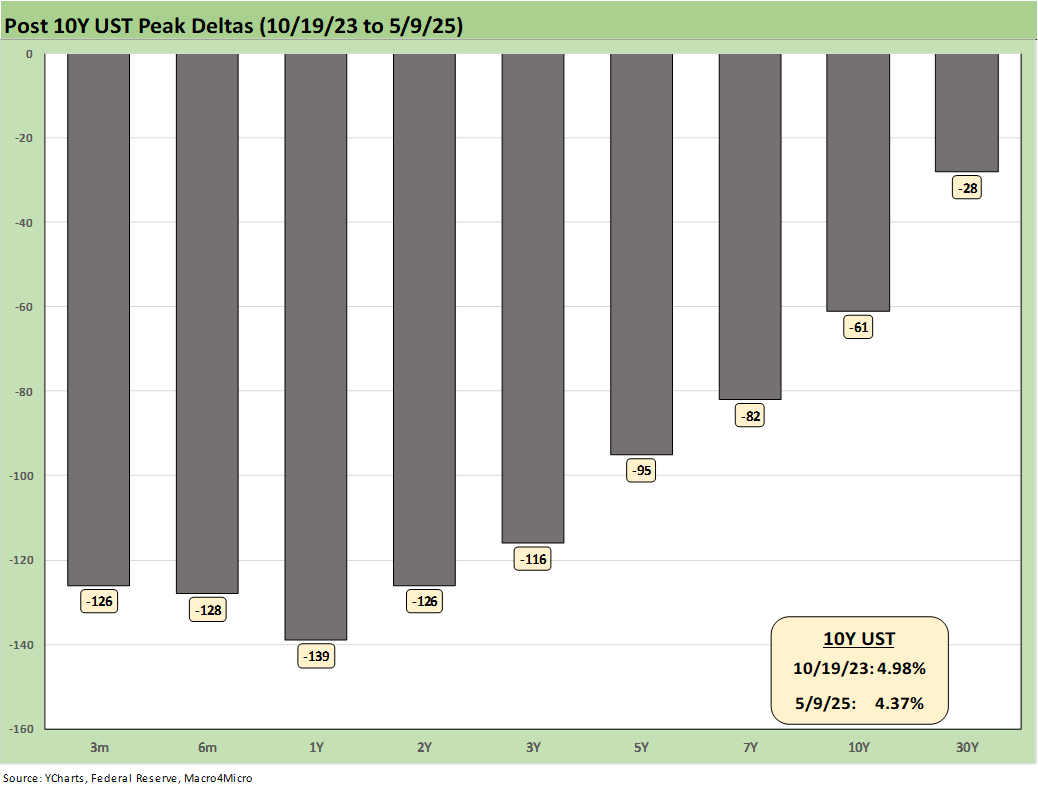
The above chart updates the running UST deltas from the 10-19-23 peak date of the UST 10Y when it barely missed the 5.0% line. For those looking for a frame of reference on what a bad move in inflation metrics might mean, these deltas at least offer a recent set of data points during an inflation fighting year. That is why we keep revisiting that timeline. Losing a rally of over -60 bps in the 10Y UST would not help the mortgage market and would lead to a material valuation headache in equities and M&A economics.

The above chart updates the UST curve for this past Friday and the Freddie Mac 30Y Mortgage benchmark rate (noon Thursday release). We include two useful historical periods including the peak homebuilder year end of 2005 and mid-2006 when RMBS quality concerns were catching headlines as the housing bubble was peaking. We post UST curves for each period in the chart. The past week was unchanged at 6.76% for Freddie’s noon Thursday pricing.
We recently added a column above detailing the differential between the Freddie Mac 30Y and the 10Y UST. That differential moved lower this week to +239 bps from +243 bps last week. The year 2005 posted a differential of +100 bps and makes a statement on what the mortgage market was like in 2005 in terms of how “hot” (i.e. excessive and “risk blind”) the mortgage market was during that peak homebuilding year. RMBS had run wild, and the history of that era is one for the record books and time stamped with a consumer credit meltdown and systemic crisis.

The above chart updates the time series for the 3M to 5Y UST slope. We see an inversion of -34 bps relative to the post-1984 median of upward sloping at +108 bps. We are a long way from the peak -197 bps inversion of May 2023 and the -173 bps we revisited in Aug 2024.
In the box within the chart, we also include the other UST segment slopes we watch along with the medians. The steepness of segments beyond 5Y is more in line with history. The 2Y to 10Y and 2Y to 30Y are upward sloping but below the medians.

The above chart shortens the timeline to an early 2021 start during ZIRP for a better look at the dramatic recent swings. We see the swing higher to +221 bps during May 2022 before the plunge to the peak inversion of -197 bps during the May 2023 and the tightening cycle.

We wrap this week’s State of Yields with an update of the running UST deltas since March 1, 2022 just ahead of the end of ZIRP (effective 3-17-22). We include the 12-31-20 UST curve and 10-19-23 peak UST curve as frames of reference.
See also:
Footnotes & Flashbacks: Asset Returns 5-11-25
Mini Market Lookback: When in Doubt, Get Forcefully Ambiguous 5-11-25
Credit Snapshot: PulteGroup (PHM) 5-7-25
Credit Snapshot: Toll Brothers 5-5-25
Footnotes & Flashbacks: Credit Markets 5-5-25
Mini Market Lookback: Inflated Worry or Slow Train Wreck? 5-3-25
Payrolls April 2025: Into the Weeds 5-2-25
Payroll April 2025: Moods and Time Horizons 5-2-25
Construction: Singing the Blues or Tuning Up for Reshoring? 5-1-25\
Employment Cost Index 1Q25: Labor is Not the Main Worry 5-1-25
1Q25 GDP: Into the Investment Weeds 4-30-25
PCE March 2025: Personal Income and Outlays 4-30-25
1Q25 GDP Advance Estimate: Roll Your Own Distortions 4-30-25
JOLTS Mar 2025: No News is Good News 4-29-25
Credit Snapshot: D.R. Horton (DHI) 4-28-25
Mini Market Lookback: Earnings Season Painkiller 4-26-25
Existing Home Sales March 2025: Inventory and Prices Higher, Sales Lower 4-24-25
Durable Goods March 2025: Boeing Masking Some Mixed Results 4-24-25
Equipment Rentals: Pocket of Optimism? 4-24-25
Credit Snapshot: Herc Holdings (HRI) 4-23-25
New Home Sales March 2025: A Good News Sighting? 4-23-25
Mini Market Lookback: The Powell Factor 4-19-25
Home Starts Mar 2025: Weak Single Family Numbers 4-17-25
Credit Snapshot: Service Corp International (SCI) 4-16-25
Credit Snapshot: Iron Mountain (IRM) 4-14-25
Credit Snapshot: Avis Budget Group (CAR) 4-9-25
Credit Snapshot: AutoNation (AN) 4-4-25
Credit Snapshot: United Rentals (URI) 4-1-25
Recent Tariff Commentaries:
US-UK Trade: Small Progress, Big Extrapolation 5-8-25
Tariffs: A Painful Bessent Moment on “Buyer Pays” 5-7-25
Trade: Uphill Battle for Facts and Concepts 5-6-25
Tariffs: Amazon and Canada Add to the Drama 4-29-25
Ships, Fees, Freight & Logistics Pain: More Inflation? 4-18-25
Tariffs, Pauses, and Piling On: Helter Skelter 4-11-25
Tariffs: Some Asian Bystanders Hit in the Crossfire 4-8-25
Tariffs: Diminished Capacity…for Trade Volume that is…4-3-25