
Footnotes & Flashbacks: Credit Markets 5-5-25
A volatile week for credit spreads brings an end to the April roller coaster just wide of the pre “Liberation” day levels.


What’s beneath the surface often does not get enough attention.
Markets largely ignored the weak signals from the GDP headline numbers this week, instead digging into the economic release line items to still see growth in various key sectors and leaning on stronger-than-expected payrolls and select, positive Mag 7 earnings to support sentiment. That leaves the market hoping for less extreme trade scenarios with IG and HY only +10 bps and +18 bps, respectively from the pre “Liberation” day levels. We can point to recent events and say “hope” has a jaded history when it comes to tariffs. The 100% tariff on “movies” that hit the screen last night shows the impulse is still there.
The volatility allowed the markets to start sorting out the potential tariff winners and losers in the 30-day lookback period. Leisure (+23 bps), Autos (+22 bps), and Energy (+20 bps) widened the most in IG and Energy (+121 bps) and Transportation (+71 bps) the worst in HY. Oil remains vulnerable on a range of scenarios from OPEC to Russia to Iran. As we go to print, WTI is at $57 and driving more troubling headlines for that issuer base.
With spreads now back near the high end of the pre-tariff range and below median levels, markets are increasingly exposed to setbacks and needs good news ahead. However, the “pause clock”, retaliation game theory, and lagging impact of tariffs all still loom in the background with the China trade talks the elephant in the room (and on the loading docks at increasingly empty ports).
We take the “under” on hope for Trump to back off on the core ambitions of his tariff program or show any retreat from being a major adherent to his tariff theories – as factually off base and conceptually light as they may be (buyer pays). Pharma and Semis are the big two that still loom, but that tariff target list is longer today than it was on Friday.

Looking at the 1-week and 1-month OAS deltas above obscures the massive dislocation in the market in the past month as the rebound continues. The 1-month trailing comparison at 4/2 on “Liberation” day captures both the immediate reaction and then the subsequent rocky path back to today’s levels. That path is marked now as a small widening in IG of +10 bps and +18 bps in HY and not where expectations would point to for what has been a chaotic tariff process thus far. That move brings the YTD HY OAS delta to +68 bps wider and, as detailed in the next chart, negative excess return of -134 bps. Given the ride, that is not that bad.
The market found enough good news in 1Q25 earnings so far and looked past some of the spookier guidance (or lack thereof). Meanwhile, the economic data did not provide cracks yet even if the GDP number had a big inventory building asterisk. PCE inflation and the related consumption data were respectable for the consumer sector and fixed investment was steady as we covered in the related commentaries (see links) at bottom.

The above chart covers total and excess returns across HY, IG, and the credit tiers. A more mixed credit spread week paired with an upward shift in UST did not cause major shifts in the pattern of YTD credit returns. As the duration vs. credit risk taking logic would dictate, IG total returns shifted down moderately, and HY moved a bit more into positive territory with IG and HY closer together on the year.
On the other hand, excess returns across the board are still well into negative territory. The overall mix provides a good case study for credit allocations amidst market volatility in a way that the 2022 spread volatility did not. That said, all bets are off in a stagflation spiral.

IG spreads ended the week +2 bps wider and now sits at +106 bps. This month saw a lot of action and the composition of sector spreads changed in the tariff aftermath as exposures drove relative winners and losers. We see the most pain in Leisure (+23 bps), Autos (+22 bps), and Energy (+20 bps) in the last 30 days.
Spreads overall remain a stretch away from the longer-term medians, but this is an IG OAS level that will be a major challenge to sustain as we look back across time. We expect that there will be a strong impulse to react to trade setbacks again. The ships from China are only now getting to the point of “last call for drop-offs.” The news flow from the freight and shipping sector is very negative, and port activity will be part of the great “inventory liquidation” process. That means the clock is ticking on the close timeline to supply-demand imbalances and the resulting price pressures.

A respectable week for HY saw -7 bps of tightening to the +360 bps level and below all the long-term medians listed above, including the +380 bps post-COVID median. Even within a historically higher-quality HY index, we view risks as skewed toward renewed widening, given persistent tariff uncertainty and the delayed impact of current measures. As the most recent whipsaw reminded, spreads will gap wider quickly and these relatively better levels provide an opportunity to selectively derisk.
The volatility in the past 30 days sees a relatively low range of sector differentiation compared to the magnitude of moves within the month. Of the 18 sectors we watch, Energy (+121 bps) and Transportation (+71 bps) stood out from the list as major wideners. The other 16 ended within a range of -25 bps to +25 bps after this recent volatility with 11 wider and 5 tighter (Healthcare, Telecom, Services, Utility, and Insurance).

The differential between HY OAS and IG OAS (quality spreads) moved -9 bps this week with the risk rally driving further compression. The recent history has been towards a tighter relationship between these two measures as IG quality skews further towards BBB and HY quality skews towards BB. This most recent compression brings us back below the long-term medians listed above but still far from the +178 bps low earlier this year.

The “BB OAS minus BBB OAS” quality spread differential narrowed to double digits again this week by -13 bps to +89 bps. The current levels return to below all the medians listed above this week and matches the June 2014 low. This metric has stayed lower in recent history, and this level still has a ways to go from the low reached last year.

The BB tier compressed -10 bps since last week to +223 bps and is now over 50 bps below the long-term median. As with many of the measures, the recent move is below the post-COVID median as well
The BB tier is relatively less exposed to cash flow shortfalls with tariff targets than the B tier, but the BB tier also could be joined by more than a few BBB tier fallen angels if the tariff backdrop and economic fallout “head south.” Autos and commodity-based BBB tier names with full yield curves of unsecured bonds can roil BB tier spreads under more than a few fallen angel scenarios.
The BB tier shows larger weightings of Financial Services, Media, and Leisure. The B tier has higher leverage and a more volatile industry level earnings mix. In other words, no tier would escape the wrath of a major tariff fallout and stagflation scenarios. That would mean material quality spread decompression from BB to CCC. Even a simple, old-school economic contraction without high inflation would do damage to these spread levels. In that scenario, the Fed jumps in with two feet.

The B tier compressed -1 bps this week down to +377 bps, less than the BB tier with some negative impact from the rebalance this week. The whipsaw this month saw spreads briefly touch above the long-term median at +486 bps, tightening 109 bps since then.

The B vs. CCC tier OAS time series is plotted above. The timeline for B and CCC spreads highlights the points of major divergence along the way (see The B vs. CCC Battle: Tough Neighborhood, Rough Players 7-7-24).
The current CCC tier OAS at +956 bps tightened by -19 bps the past week and is just above the long-term median of +954 bps. The recent volatility was a brief reminder of the kind of B vs. CCC divergence that can happen in a hurry as markets reprice. Further tariff chaos and the potential economic damage that comes in 2Q or 3Q are easy to point to catalysts for another bout.
The CCC YTW moved below the 14% line to 13.54% but the underlying constituents are widely dispersed across an 80.35 composite dollar price. The CCC tier is still in the pricing in zone of equity risk-returns with such yields at this point. CCC investing at this point demands careful capital structure analysis and rigorous issuer-level relative value research. Subject to how these tariffs play out and how the stagflation wildcard unfolds, the distressed players are warming up.

The shorter timeline from Jan 2022 just ahead of the end of ZIRP and start of the tightening cycles gives better granularity on the movements from a low for CCCs of +659 bps in Jan 2022 to a peak of +1226 bps in July 2022 and 1289 bps to end Sept 2022 down to the Jan 2025 tights of +690 bps ahead of the recent spike to current levels.

The B vs. CCC tier differential is broken out above with the current +579 bps still above the long-term median and above the distinct markets shown above with the exception of the TMT HY credit cycle with its +702 bps median.
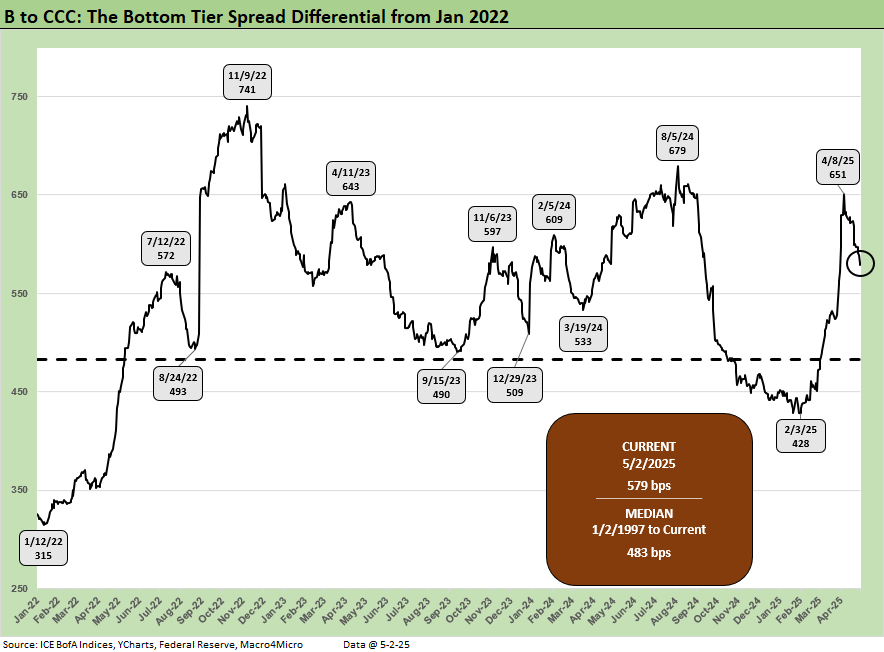
The above chart frames the “B vs. CCC tier” quality spread differential across the short timeline for better granularity. Spreads widened with a vengeance since the low of Feb 2025 at +428 bps even if it has recovered modestly.
A look at yields…

Moving away from spreads, which are a little further below long-term medians this week, yields for both IG and HY have a more complex story in historical context given the post-crisis distortions of ZIRP and “normalization.” The normalization period of Dec 2015 to Dec 2018 never really got on track with the economic weakness and Fed easing of 2019 followed by a COVID crisis and return to ZIRP in Mar 2020.
The current IG YTW at 5.30% (vs. 5.22% last week) rose on the upward UST curve and slight spread widening and but are moving back away from the 6.1% pre-ZIRP median on YTD UST curve moves. The HY YTW remained flat at 7.78% (from 7.77%) vs. a pre-ZIRP 9.3% mark. We consider the pre-ZIRP years the most rational frame of reference in light of the post-crisis ZIRP and QE as well as the COVID Fed reactions.
Spreads will remain a key swing factor for reaching those yield medians of pre-ZIRP years, and we just saw material credit risk pricing action on HY the past four weeks. UST yields are a tougher call with the tariff backdrop that still threatens stagflation as well as the potential for a technically driven upward shift on the supply-demand fears.
In theory, old fashioned recession risk would pressure UST rates lower and credit spreads higher, but this is no ordinary cyclical turn. We cover the UST shapeshifting in our separate Footnotes publication on yields as the UST curve saw a minor selloff this week (see Footnotes & Flashbacks: State of Yields 5-4-25). We await the latest FOMC release this week.

The above frames current IG index yields vs. previous credit peaks along with their respective UST curves. We include both prior credit peaks in June 2007 and Dec 1997 for context as prior peak credit cycles when high risk appetites saw investors chasing yields. Those 1997 and 2000 markets saw poor risk symmetry and low spreads.
Today’s curve is still low in those historical credit peak contexts. With stagflation risks back in the mix and the current market beyond the credit cycle peak after the tariffs, the next stretch could see long yields rising as spreads widen out for renewed return pain. The short to intermediate IG market is still the safest bond game for now. The funds that are asset class constrained to HY can take refuge in the higher quality layers.

The final chart does the same 1997 and 2007 drill but for HY index yields. This week’s UST move leaves current HY index yields still in line with prior peak credit cycles at 7.78% vs. 7.96% in June 2007 and 8.60% in Dec 1997. The recent spread widening had moved HY index yields higher, but the past week spread rally and recent rolling UST move lower left the current HY index YTW below both the 2007 peak and 1997 HY index levels.
The widening early this month gave flashbacks to the volatility and major spread moves of the 1997-98 and 2007-08 periods that also posted triple-digit widening months. The sheer speed of risk repricing has happened in earlier cycles even if those moves were for very different reasons.
The challenge is identifying a fundamental transmission mechanism to more trouble for financial metrics and relative risks of default. Identifying a catalyst for pain now is easy with tariffs hitting the macro drivers (the consumer) and micro drivers (“buyer pays” hits margins or requires higher prices). The tariff shock is unprecedented in modern capital markets, but at least the banks are much healthier. We also see higher quality levels in the HY bond index as a starting point vs. 2007 and the late 1990s TMT bubble years. The reality is the tariff impacts and supply-side disruptions are only now just beginning in substance. It is hard to reflect forward-looking risks when so few know (including the White House) what those risks will be.
Looking back even more, the turn in the credit cycle always comes at some point and often with an external trigger or “assist” that can set it off. During 1990, securities firms started to collapse including Drexel’s Chapter 11 in Feb 1990 and bridge loan related bailouts of Shearson Lehman, First Boston, and Kidder Peabody. We do not face that type of financial intermediary meltdown risk here (at least not yet!). In a protracted stagflation bout, eyes will return to the regional banks.
The summer of 2007 was the start of major problems in the credit markets with asset risk and leveraged counterparty exposure and bank/broker interconnectedness risk soaring. Despite that backdrop that worsened in August 2007, the equity markets and S&P 500 and NASDAQ kept on rallying into Oct 2007. Later in the turmoil and well after the fact, the start of the recession was tagged as Dec 2007 (see Business Cycles: The Recession Dating Game 10-10-22).
The 2007 experience reminded the market that credit leads the cycle and equity lags. The same was true in 1999 with the HY default cycle underway and NASDAQ at +86% that year. This time around, the credit markets did not expect the tariff insanity and is still making up its mind. The real economic effects are more geared to the periods ahead in 2Q25 and 3Q25 when tariffs will be registered at the transaction level. That will be the reality point. We expect HY to stay unhappy and spreads to average wider as the tariffs roll into actual corporate fundamentals.
See also:
Footnotes & Flashbacks: State of Yields 5-4-25
Footnotes & Flashbacks: Asset Returns 5-4-25
Mini Market Lookback: Inflated Worry or Slow Train Wreck? 5-3-25
Payrolls April 2025: Into the Weeds 5-2-25
Payroll April 2025: Moods and Time Horizons 5-2-25
Construction: Singing the Blues or Tuning Up for Reshoring? 5-1-25
Employment Cost Index 1Q25: Labor is Not the Main Worry 5-1-25
1Q25 GDP: Into the Investment Weeds 4-30-25
PCE March 2025: Personal Income and Outlays 4-30-25
1Q25 GDP Advance Estimate: Roll Your Own Distortions 4-30-25
JOLTS Mar 2025: No News is Good News 4-29-25
Tariffs: Amazon and Canada Add to the Drama 4-29-25
Credit Snapshot: D.R. Horton (DHI) 4-28-25
Footnotes & Flashbacks: Credit Markets 4-28-25
Mini Market Lookback: Earnings Season Painkiller 4-26-25
Existing Home Sales March 2025: Inventory and Prices Higher, Sales Lower 4-24-25
Durable Goods March 2025: Boeing Masking Some Mixed Results 4-24-25
Equipment Rentals: Pocket of Optimism? 4-24-25
Credit Snapshot: Herc Holdings (HRI) 4-23-25
New Home Sales March 2025: A Good News Sighting? 4-23-25
Mini Market Lookback: The Powell Factor 4-19-25
Ships, Fees, Freight & Logistics Pain: More Inflation? 4-18-25
Home Starts Mar 2025: Weak Single Family Numbers 4-17-25
Credit Snapshot: Service Corp International (SCI) 4-16-25
Retail Sales Mar25: Last Hurrah? 4-16-25
Industrial Production Mar 2025: Capacity Utilization, Pregame 4-16-25
Credit Snapshot: Iron Mountain (IRM) 4-14-25
Mini Market Lookback: Trade’s Big Bang 4-12-25
Tariffs, Pauses, and Piling On: Helter Skelter 4-11-25
CPI March 2025: Fodder for Spin 4-10-25
Credit Snapshot: Avis Budget Group (CAR) 4-9-25
Credit Snapshot: AutoNation (AN) 4-4-25
Credit Snapshot: United Rentals (URI) 4-1-25