
Employment Cost Index 1Q25: Labor is Not the Main Worry
We look across the Employment Cost Index as labor costs fade as a topic for now. Health care benefits flashing red.


Is that a tariff?
We update the Employment Cost Index (ECI) as labor compensation is still beating inflation but continuing to move lower.
Compensation costs for civilian workers (wages and salaries + benefits) declined from 3.8% in the Dec 2024 quarter to 3.6% in 1Q25 vs. 4.2% YoY in the 1Q24 period. Wages alone were +3.5%.
The 3.6% ECI was down from 3.8% in Dec 2024 but YoY is down from +4.2% in March 2024. Labor costs being in check while still posting positive real growth is on balance a good sign. The campaign rhetoric of deporting somewhere between 2 million and 20 million (yes, a wide range indeed) will be more narrowly applied to select industry groups (agriculture, homebuilding, select services lines, etc.). The courts are tying up the pace of deportations and the logistics are much more complicated than admitted.
Private sector health benefit costs raise some flags by increasing to +5.4% in 1Q25 from 3.4% in 4Q24 and 2.8% in 1Q24. If Trump tosses Pharma on the tariff fire or China takes some supply retaliation actions in key areas such as generics, health benefits and consumer health care costs really could see some serious pressure.

The above chart updates the running ECI history across time from the lows of 2.4% in 2020 to the 5.0% handle highs of 2022 and now down to a recent low of 3.6%. The lowest in the timeline from the March 2001 TMT cycle peak hit in Dec 2009 at +1.4% after the payroll ranks had been decimated by the systemic crisis and housing bubble collapse.
The ECI quarterly report offers a broad range of data across occupational categories. With “All Workers” at 3.6%, private sector workers are 3.4%, State and Local government workers are at 4.3%. The Unionized workers ECI was at +4.6% with Nonunion at +3.3%.
Within the private Goods-producing sectors, we see 3.2% or below the “All Workers” number. Services-providing industries ECI at the headline level are at +3.4%. As you scan all the private sector lines, the number of lines above 4% is low (e.g., Transportation and Warehousing, Hospitals, Finance and Insurance). There are very few 5% lines over in Services (Credit intermediation).
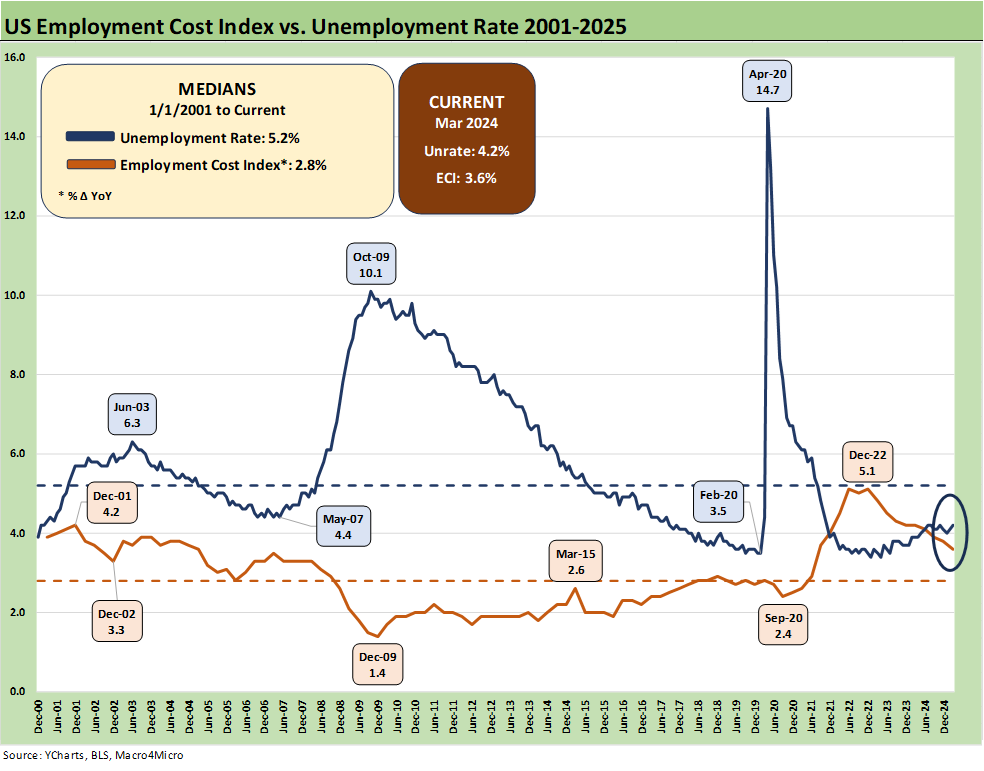
The above chart plots a logical relationship between ECI levels and the unemployment rate. Most remember how ugly the post-crisis period was but some may forget that we did crack double digits at 10.1% in Oct 2009. That number peaked after the economic cycle was back in expansion mode after the June 2009 trough, which ended the longest recession (Dec 2007 to June 2009) since the Great Depression.
See also:
Employment Cost Index 4Q24: Labor Crossroad Dead Ahead 1-31-25
Employment Cost Index Sept 2024: Positive Trend 10-31-24
The Employment Cost Index June 2024 8-1-24
Employment Cost Index March 2024: Sticky is as Sticky Does 4-30-24
Employment Cost Index Dec 2023: Compensation Mixed Picture 1-31-24
Employment Cost Index Sept 2023: Expect the Expected 10-31-23
Employment Cost Index: Rings of the Redwood 7-28-23
Employment Cost Index: Slow Motion 4-28-23
Employment Cost Index: Labor vs. Capital …Tide Turning or Swirling? 2-1-23