
Payroll April 2025: Moods and Time Horizons
We look across a solid month for payroll numbers with a few major services lines driving results (as usual).


I might need a backup for the summer.
The +177K in job adds in the Establishment Data included +156K in Services while the Household Survey posted a 4.2% U-3 unemployment rate. That included a mix of +518K in the civilian labor force (to 171.1 million), +436K employed (to 163.9 million), and +82K unemployed (to 7,165K). As usual, there are material moving parts in the Household numbers that do not easily wag an unemployment rate that would be considered full employment in the “old days.”
The U-6 structural underemployment rate of 7.8% ticked lower from 7.9% MoM and is up from 7.4% in April 2024. The occupational lines where we see the bigger adds are certainly not in the economic multiplier effect sectors (nor have they been for some time). Below we dig into some top-down stories. We will be out later today with the rolling line item delta details by occupation.
The ticking clock just keeps on ticking when the inventory stockpiles run down, the transaction prices start to reflect the “buyer pays” tariffs and get folded into costs or pricing. That is when employers (small to large) will face more critical decisions. The pause continues on what is a very bizarre set of reciprocal tariffs while retaliation scenarios are also on hold or in flux. We just need to wait out the chaos to handicap the economic impact (see Tariffs, Pauses, and Piling On: Helter Skelter 4-11-25, Reciprocal Tariff Math: Hocus Pocus 4-3-25).
A good payroll number certainly does not encourage the Fed to ease when stagflation risks, inflation risks, and uncertain cyclical prospects still lurk. At the recent run rates for 1Q25 as detailed in the latest GDP numbers, positive PCE, and a major inventory build now combine with a solid payroll count. That does not a recession make. But we appear to be working on it (see 1Q25 GDP Advance Estimate: Roll Your Own Distortions 4-30-25, 1Q25 GDP: Into the Investment Weeds 4-30-25).
The game of chicken with China signals severe inventory shortages and higher prices ahead on both tariffs and supply-demand imbalances. That could make for a tough summer in the very high stakes game theory. Turbulence in that outcome is what could then spill into payrolls at a lag. Trump wants Powell to act on what tariffs are in the process of creating in the summer – an economic contraction whether the NBER gets around to calling it a recession or not (see Business Cycles: The Recession Dating Game 10-10-22).

The above chart updates the monthly payroll adds since March 2022 when the tightening cycle started. The 177K is just below the long-term median and leaves a lot of room for interpretation relative to lower expectations. A hope that falls into the “longer odds” bucket is that the tariff pause has a very favorable outcome for companies and US consumers. There are no signs of Trump backing off yet.
We see a mediocre YTD 2025 for payroll adds but still solid relative to the fears after a healthy fall and 4Q25. That had followed a weak summer of 2024 that gave the Fed an excuse to ease (even if it eased too much) in Sept 2024 and sent the UST curve and mortgage rates to brief lows (see Footnotes & Flashbacks: State of Yields 4-27-25).
The payroll adds exceed what most would see as more than keeping up with demographic needs and graduating classes will be on their way during the summer and fall. We shall see how they do.

The above chart plots the running job adds/declines since Jan 2009 against the unemployment rate, which was flat at 4.2% MoM but up from 3.9% YoY in April 2024. We isolate the worst months of the COVID dislocations in the box for better visuals in the other periods.
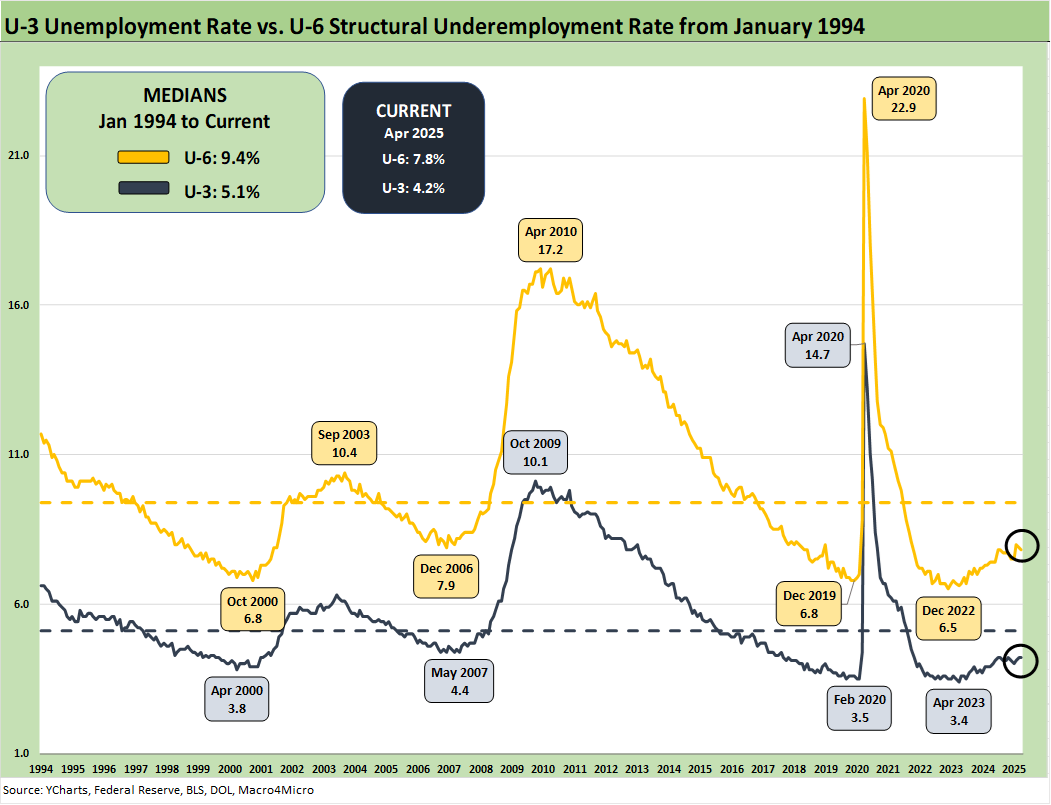
The above chart updates the time series for the U-3 unemployment rate and U-6 structural underemployment rate across the years from 1994. The current U-3 rate was flat at +4.2%. As a reminder, the U-6 metric is defined with the numerator as “total unemployed + persons marginally attached to the labor force + total employed part time for economic reasons.” The denominator is “civilian labor force + workers marginally attached to the labor force.”
The U-6 ticked lower to 7.8% from 7.9% after it rose sharply in Feb 2025 to 8.0% from 7.5% in Jan 2025. The current 7.8% is well above the 6% handles seen in spring of 2023. The U-6 is also up from the 7.4% level of last year during April 2024. The 7.8% U-6 is below the median from 1994 of +9.4%. That 9.4% includes the post-crisis shock and the longest recession since the Great Depression.

The time series above updates the U-6 minus U-3 differential as a measure of relative employment quality and to flag risks of major dislocations in large swaths of the economy (think oil patch in the late 1980s, tech bubble imploding 2001-2003, financial services and automotive in 2009). The current 3.6% differential is modestly below the long-term median of 4.0%. The job ranks are steady now but in an eerie stretch of time with container activity at major Western ports more like a dystopian movie but employees busy working and consuming.

The above chart updates total payroll vs. the unemployment rate. More bodies with more paychecks is always by definition a good thing. The trick from here is how the consumer deploys that paycheck. The consumer has ample reasons to get defensive and push saving rates much higher than what we saw in the monthly PCE numbers (see PCE March 2025: Personal Income and Outlays 4-30-25). Consumption in fact was solid.
Defensive habits by the consumer were clearly not the case in March despite the soft numbers from surveys looking ugly and this past week delivering another beastly set of Consumer Confidence metrics. This past week the Conference Board saw its lowest reading since Oct 2011 when the sovereign panic was peaking (and HY spreads spiked).

The above chart updates the total payroll number vs. job openings. The most recent JOLTS number was weakening but was not too far below the highest level posted under Trump in his first term when he saw 7.5 million in Nov 2018 (see JOLTS Mar 2025: No News is Good News 4-29-25). The 7.2 million this past week was not bad even if lower.
As we enter the later stages of 1Q25 earnings season, the management teams have a lot of moving parts to factor into guidance whether quantitative or qualitative. Some companies have had two sets of books on guidance, some suspended annual guidance entirely, and some just gave the forward quarter. The honest answer is “Who knows!?” given the nature of the reciprocal tariffs and what few (if any outside the White House) guessed the formula they decide upon – which has essentially nothing to do with trade partner tariffs on the US.

The CPI vs. Unemployment Rate time series will start getting more focus as stagflation debates get louder and the focus on upward pricing pressure from tariffs get more reliably framed against potential layoffs and downsizings.
At 4.2% on the U-3 in March 2025, that frames up favorably vs. the long-term median of 5.7% while the March 2025 headline CPI of 2.4% (2.8% Core CPI) show headline CPI under the long-term median of 3.1% (see CPI March 2025: Fodder for Spin 4-10-25). March posted much-improved CPI numbers for headline and core vs. Feb 2025, but the tariffs blur out good news given the scale of the forward threat.
The 4.2% U-3 is in line with metrics that in the 1990s would have been called full employment. The 1990s was actually the greatest economy in postwar US history and crushed Trump’s numbers. Clinton had two terms with no recession and a slew of annual 4% GDP growth numbers (see Presidential GDP Dance Off: Clinton vs. Trump 7-27-24). Trump’s highest was a single 3.0% year in 2018. Reagan’s two terms also crushed Trump’s performance as well as that of Biden, Obama, and Bush (see Presidential GDP Dance Off: Reagan vs. Trump 7-27-24). The media has redefined lame on how they cover such outlandish statements on economic performance. Weak. (Or should we say, “SAD”?)
See also:
Construction: Singing the Blues or Tuning Up for Reshoring? 5-1-25
Employment Cost Index 1Q25: Labor is Not the Main Worry 5-1-25
1Q25 GDP: Into the Investment Weeds 4-30-25
PCE March 2025: Personal Income and Outlays 4-30-25
1Q25 GDP Advance Estimate: Roll Your Own Distortions 4-30-25
JOLTS Mar 2025: No News is Good News 4-29-25
Tariffs: Amazon and Canada Add to the Drama 4-29-25
Credit Snapshot: D.R. Horton (DHI) 4-28-25
Footnotes & Flashbacks: Credit Markets 4-28-25
Footnotes & Flashbacks: State of Yields 4-27-25
Footnotes & Flashbacks: Asset Returns 4-27-25
Mini Market Lookback: Earnings Season Painkiller 4-26-25
Existing Home Sales March 2025: Inventory and Prices Higher, Sales Lower 4-24-25
Durable Goods March 2025: Boeing Masking Some Mixed Results 4-24-25
Equipment Rentals: Pocket of Optimism? 4-24-25
Credit Snapshot: Herc Holdings (HRI) 4-23-25
New Home Sales March 2025: A Good News Sighting? 4-23-25
Mini Market Lookback: The Powell Factor 4-19-25
Ships, Fees, Freight & Logistics Pain: More Inflation? 4-18-25
Home Starts Mar 2025: Weak Single Family Numbers 4-17-25
Credit Snapshot: Service Corp International (SCI) 4-16-25
Retail Sales Mar25: Last Hurrah? 4-16-25
Industrial Production Mar 2025: Capacity Utilization, Pregame 4-16-25
Credit Snapshot: Iron Mountain (IRM) 4-14-25
Mini Market Lookback: Trade’s Big Bang 4-12-25
Tariffs, Pauses, and Piling On: Helter Skelter 4-11-25
CPI March 2025: Fodder for Spin 4-10-25
Credit Snapshot: Avis Budget Group (CAR) 4-9-25