
Footnotes & Flashbacks: Credit Markets 2-3-25
After many were thinking a multifront trade war seemed like a risk too far, here we are (or are we?!).


Trump assembles trade negotiation team…
We update what might be the last month of HY spreads in the June 2007 zone as one-off trade wars seem teed up even if Mexico and Canada got reprieves with uncertain criteria for what comes next (border resources for now). China is in the crosshairs, and the EU might get pulled in soon. We’ll see what Trump says in 30 days.
Trade battles are part of geopolitical handicapping with adversaries, but the potential for multiple trade wars with allies is unprecedented. This potential economic stress would be self-inflicted.
Trump can simply terminate the USMCA, so it is a mystery why he was going this route. Going straight to the 25% grenade (10% on oil) was strange and reckless. Trump reiterated his desire for Canada to become a 51st state today (to avoid tariffs).
Kevin Hassett (head of Trump’s National Economic Council) was on CNBC this morning emphatically saying “it is a drug war, not a trade war” while comparing Canadian cities to San Francisco. Meanwhile, Trump was on the screen last night and this morning talking about trade deficits and Canada “ripping us off” while negotiating with Trudeau today to allow US banks into Canada. That is a de facto revision of USMCA and not about drugs, which is a legal decoy to use emergency powers.
Hassett playing MAGA mouthpiece is not new (see The Politics of Objective GDP Numbers: “Flex Facts” on Growth 10-30-24), but facts matter. This move on Canada is about trade (see Tariffs: Questions to Ponder, Part 1 2-2-25, Trump, Trade, and Tariffs: Northern Exposure, Canada Risk 10-25-24) after Trump voiced a willingness to use economic coercion to annex Canada. Did Hassett miss that part?
Credit market reaction to the trade clashes…
We thought we should hold our weekly Footnote Credit Commentary for one more day since the trade war noise would get an immediate reaction we wanted to see. Last week was a relatively dull one for spreads relative to what was unfolding on the screen over the weekend and into Monday on trade war risk (see Tariffs: Questions to Ponder, Part 1 2-2-25, Mini Market Lookback: Surreal Week, AI Worries about “A” 2-1-25).
Will the credit party end?
The immediate reaction in the credit markets looks like this:
HY: The HY OAS only moved +5 bps wider on the day to +273 bps. The HY market could widen 25 bps from here and still be in the late June 2007 and Dec 1997 spread zone. So HY risk premiums remain extremely tight with a strong base of HY bond investors ready to ride a refi-and-extension wave. A major trade war with the USMCA partners and China would necessarily change risk appetites pending repricing of risk. Toss in the EU and it only gets worse. The idea is not off the table yet. That is a sad comment on Washington and the deaf, dumb, blind, and gutless Congress.
IG: IG only moved 1 bps wider on the day. IG is going to get wagged by the UST curve barring radical fundamentals setbacks. The BBB and higher BB tier would see some notable pressure on spreads for some cyclical names and capital intensives if the trade war risk goes off the rails. Autos and suppliers would be the most vulnerable as early stock price action signaled this morning. Auto equities are rallying after the close tonight on the Canada news after the earlier Mexico temporary deal.
UST curve: The 10Y UST barely moved and yields ticked slightly lower. There are a lot of moving parts in how the steps would have to (still could) play out across the China reaction, currency trends, and what happens in 31 days. One topic that made the rounds was inflation expectations could shift just based on the risk that Trump could act unilaterally at any time on tariffs with any major trade partner. That could also dampen the timing for FOMC cuts even if not explicitly stated.
Before this fuse was lit (even if a slower burn now to an uncertain end), there was not much visibility to any major risks that would drive a credit cycle downturn. In fact, the macro picture was constructive and “friendly” to credit risk.
Trump’s fixation on trade deficits is not new. His poor grasp on how tariffs work is not new. Trade deficits are not new and have been good for the corporate sector profitability and equities. His threats were more often than not handicapped as bluffs and discounted by allies as “negotiation tactics” (the inference was “after all, who could be that dumb?”).
China, Mexico, and Canada all at once would show up on the “crazy list” of judgement lapses. That would fall hard on some red states in the auto transplant belt as well as the “not so blue wall” states. Seems like a bad idea for midterms?
In the end, it takes a special kind of reckless and power crazy to derail so many moving parts of the economy with such a gambit and an aggrandizement game plan using trade war shots across the bow. All it takes to allow it to push forward is a spineless Congress and a sycophantic, unqualified cabinet lineup with a dash of Rasputin influence (Musk). The Rasputin thing did not work out so well for Russia I believe. So here we are.
Canada: Trump’s actions are about trade and power and coercion, not drugs…
Trump can wheel out all the policy spin doctors he wants to manage a 24-hour headline crisis that was only getting worse with all parties retaliating. The “just tactics” view is now damaged, and any sleight of hand this week to frame in that light could ring hollow for many. It does not deflect from the facts. He is a connoisseur of “flood the zone.” Last week Trump was slamming the Fed for easing. Today, his voiced view was that the Fed did the right thing.
Trump is on record for years moaning about any trade deficits and that includes Canada, the largest export nation for the US and one where the US has a goods trade surplus ex-oil and a bigger surplus ex-oil if you include services. Mexico and China generate a much larger gap with more impact on the US job erosion in finished goods and supplier chains than Canada.
The fact that Trump has verbally advertised his desire to apply economic pressure on Canada to become the 51st state while citing tariffs is not helping his case that it is a “drug war, not a trade war.” Trump tends to be a witness for the other side of this very specious argument. How do we know it is about economic coercion? Answer: Trump said so. Hassett did not get the memo.
Mexico: Our neighbor to the South is a more complicated picture on fentanyl and the cartels, but Mexico has been on Trump’s enemy list for years. They also feature in the immigration battle. Some spin on drugs does not deflect from Trump’s view on the migration of manufacturing and assembly jobs to Mexico. As a reminder, Mexico is now the #1 importer nation for the US with the EU as a bloc at #1 overall (see Mexico: Tariffs as the Economic Alamo 11-26-24).
A common feature across the leading importers of goods ex-crude was labor intensive processes and assembly line work. In other words, “cheap labor” rules. Mexico was an alternative to China. The bad news is that the US is now deporting cheap labor while making cheap labor output from Mexico more expensive. The problem there for consumer prices in the US with a 25% tariff is fairly obvious.
The auto sector exposure tied to Mexico is daunting (see Trump at Economic Club of Chicago: Thoughts on Autos 10-17-24). Volumes would get crushed by crippling cost pressures from 25% tariffs, and the ensuing supply-demand imbalances would fuel new and used vehicle inflation. Now just imagine what would unfold for autos if Japanese, Korean, and German supplier chains get caught up in the sweeping attacks on auto trade whether from the home country or from Mexico sourcing by the transplants. We also have Asian transplants on the Canadian side of the border.
There are no shortages of side stories from the multiplier effects. The US (and Asia) are key suppliers of automotive grade flat rolled steel to Mexico. The US has a steel surplus with Mexico, which is also a major round trip trade partner of high electronics content components. That would make for a tough cost problem with the steel being sent down and then the car being sent back. The same is true for Canadian auto production on two-way traffic.
The literal multiplier effects of trade with Mexico on the north side of the border flows across freight and logistics (incl. warehouses), auto retailers, insurance, consumer finance, dealer finance, and real estate (warehousing, dealer locations, etc.) in the US. Those multiplier effects and additional revenue streams within borders is not grasped by Trump. It all adds up while he keeps staring at the single border statistic.
Trump also seems to forget how so many import supplier chains fuel the arrival of more transplant capacity in his beloved red state manufacturing operations that in turn fuel downstream auto retailer expansion and generate more jobs. The auto retail sector is a very large employer in the monthly payroll ranks. There are many high paying diagnostic and technology-intensive jobs that are hard to fill. This is not the old days of “Mr. Goodwrench.”
Tariffs are about more than bilateral trade in 2025…
In the end, Trump needs a big tariff revenue line for his budget reconciliation gambit. He also fails to grasp what trade deficits mean (i.e., refuses to embrace concepts since that would entail reversing himself) The markets want to believe Trump is conceptually grounded, sees the facts and is rational. As the old saying goes, “Good luck with that!”
The issues on tariffs around the budget plan and desire to extend the tax cuts with a reconciliation bar to clear (i.e. no filibuster in Senate) is the main item over the short term.
Trump believes that trade deficits can be made to disappear. We have covered those topics in the past. If we see a sharp decline in imports, we are likely also seeing trouble with exports and the economy has slowed to a crawl. That is more likely than eliminating trade deficits with the 4 largest trading partners when the US is doing well.
A look at spreads…
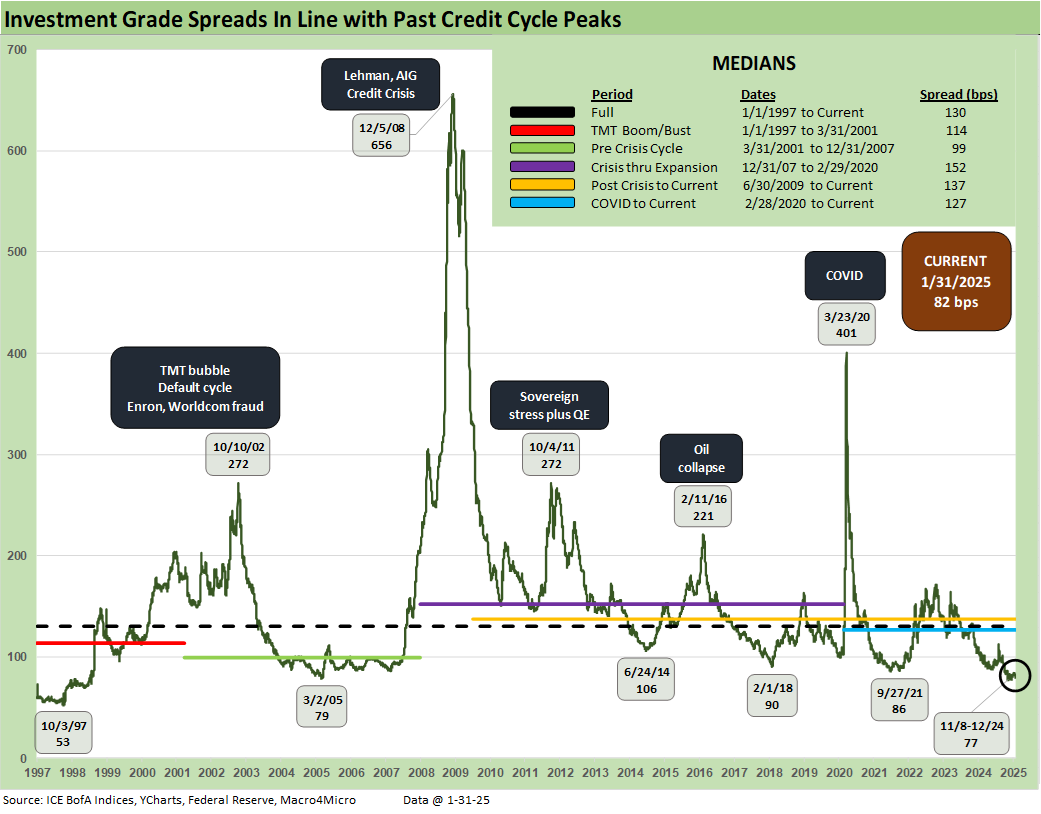
The IG index OAS moved slightly wider on the week to +82 bps, and that will keep IG in the double-digit range more akin to prior cyclical peaks as we highlight in the low points of the above time series. We have been down in this neighborhood for a while now, and the +82 bps is -48 bps inside the long-term median and -17 bps inside the tightest median in the time horizons segmented above, which was the March 2001 to Dec 2007 timeline.

The HY market saw spreads widen by +8 bps on the week to +268 bps, which is still well inside where June 2007 ended and where 1997 ended. The symmetry remains unfavorable just on the long-term realities and the challenges of handicapping US trade behavior patterns at this point. The lack of respect for the terms of the US and Canada and Mexico USMCA deal (struck in 2018, effective 2020) is now a matter of record.
As a reminder, HY OAS lows were hit twice in early June 2007 at +241 bps, but June 2007 ended at +298 bps. Back in 1997, the HY market hit spread lows in Oct 1997 at +244 bps, but the year 1997 ended at +296 bps. That makes a statement on where +268 bps stands in historical context (+273 bps as of Monday 2-3-25 close).

The HY OAS minus IG OAS differential was covered in Mini Market Lookback: Surreal Week, AI Worries about “A” 2-1-25. We see a +6 bps widening in the quality spread differential on the week.

The “BB OAS minus BBB OAS” quality differential also moved slightly wider on the week by +5 bps but remains extremely compressed in historical context even if moderately above the +55 bps 2024 low in July.

The BB tier moved slightly wider at +7 bps to +166 bps or still well inside the long-term median of +299. The BB OAS is inside the credit cycle lows of Jan 2022 ahead of the tightening cycle and Jan 2020, which was a rare sub-200 level of +186 bps. Current levels are inside the Oct 2018 credit cycle lows of +203 bps and the earlier credit cycle low of June 2014 with its +232 bps BB OAS.

The B tier had been the key HY index driver in 2023 and to a lesser extent in 2024. The B tier OAS tightened by -174 bps in 2023 and by another -45 bps in 2024 to +296 bps. The long-term median of +468 bps dwarfs the current B tier OAS. For YTD 2025, the B tier has tightened another -25 bps. The recent low point for the B tier OAS was +254 bps in Nov 2024.

The periodic divergence between the B vs. CCC tier OAS are detailed in the above chart. We frame the highs and lows for some historical perspective. The rise of private credit has shifted the relative mix of the CCC tier (or weak B tier) exposures in the HY bond index lower as many deals migrated to private credit markets.
The credit cycle has shown few signs of a material faltering to this point, and that helps reassure the equity markets to a certain extent since many investors justifiably look to the credit markets for signs of broader market stress as opposed to just headline volatility from the bellwether growth stocks.
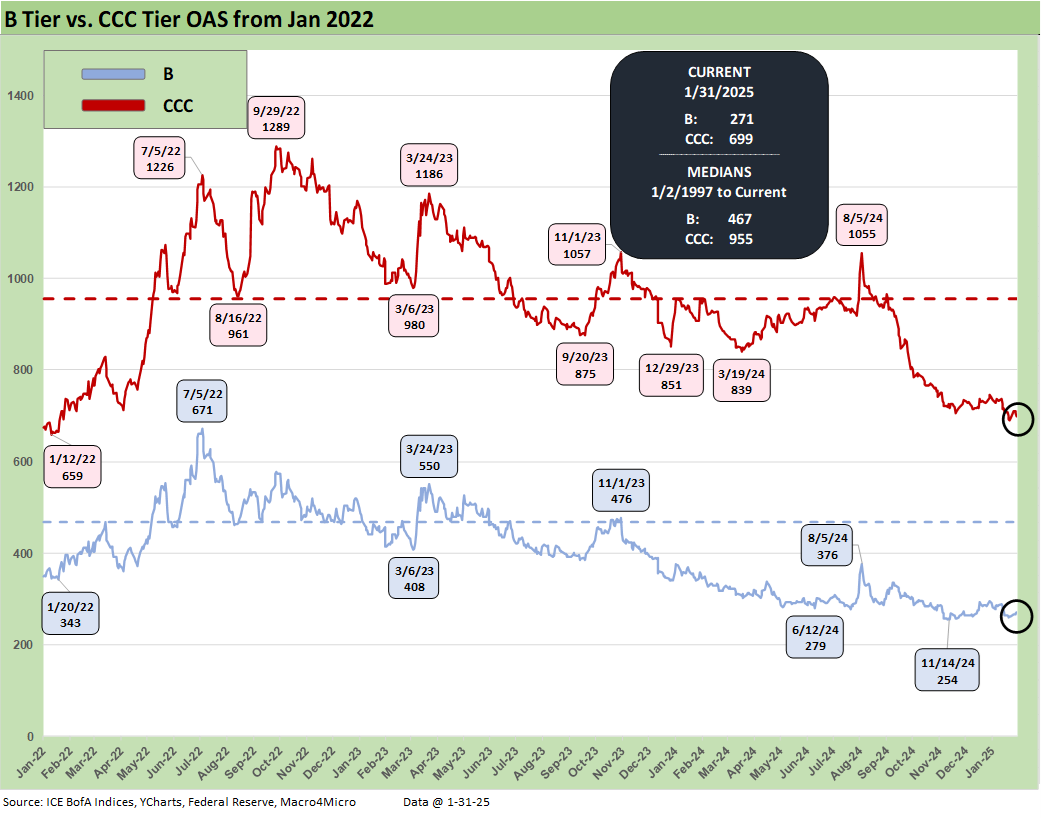
The above chart shortens the time series for a more granular view of post-tightening action in the B vs. CCC tier. The peak CCC tier OAS of +1,289 bps in Sept 2022 is now down to +699 bps on HY quality spread compression and the usual effects of constituent migration, default dropouts, and distressed exchanges across the period.
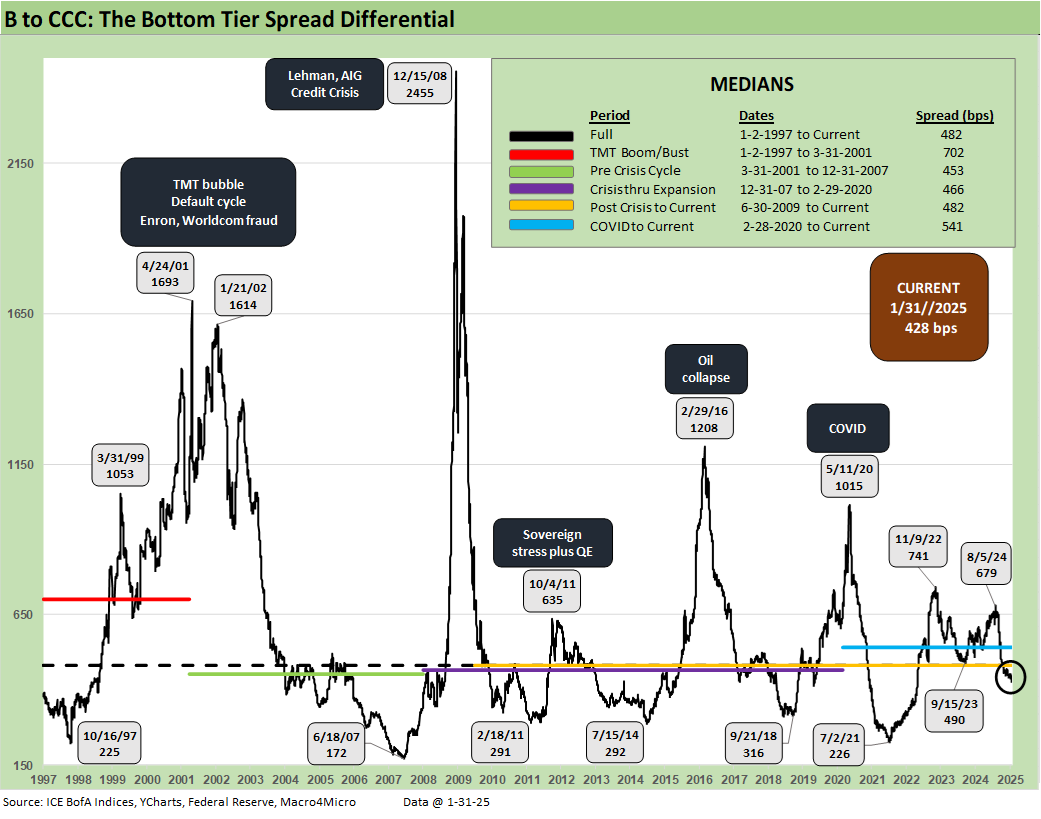
We update the “CCC OAS minus B tier OAS” quality spread differentials across the timeline from the TMT bubble, the credit crisis, COVID, the tightening cycle and then into the recent quality spread rally. At +428 bps, the differential is comfortably inside the long-term median (+482 bps as well as the other medians for the periods detailed in the box. We see the medians for 3 of those time periods in the 400 bps handle range. The widest median time period was the TMT implosion and default cycle at +702 bps.

The above chart zeroes in on a shorter timeline for the B to CCC quality spread differential from the period just before the tightening cycle through this past Friday. The rise to +741 bps in Nov 2022 is now back to +428 bps or inside the long-term median of +482 bps.
A look at yields…

The above chart updates the history of IG and HY YTW levels. The current 7.17% for HY and +5.32% barely moved this past week with the UST and OAS moves.
We routinely make the case that the relevant frames of reference are the pre-crisis medians of 6.1% for IG and +9.3% in HY. Those periods came ahead of the ZIRP and QE distortions.
If we consider what median spreads look like as detailed earlier, the comparison makes more sense. The current HY OAS differential vs. the long term median HY OAS is +195 bs (HY Median OAS of +463 bps minus current HY OAS of +268 bps). If we flow that into current HY index yields, that would take the HY index north of 9% (7.17% + 195 bps OAS).

The above chart updates our usual look at the IG index YTW (horizontal lines) for the Friday close vs. two key credit cycle peak periods in June 2007 and the end of 1997. We also include the UST curves for those dates. We see how low the UST curve is now vs. June 2007 and Dec 1997, and the UST is the main story with OAS compressed today, in June 2007, and in Dec 1997.
The June 2007 credit cycle went into “suspended animation” in the summer months as mortgages, structured credit, and some hedge funds were starting to unravel. In contrast, the TMT cycle had two more years to run from the 1997 peak.
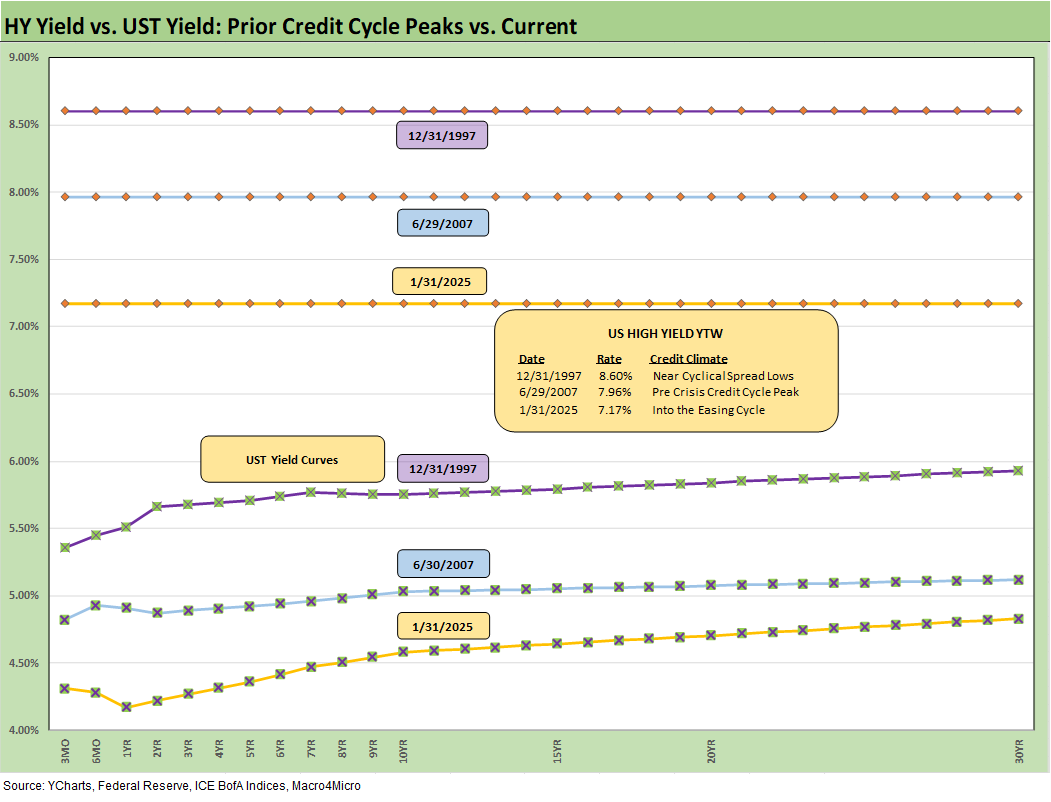
We do the same exercise above for the HY index with the UST curve still the main event in three markets with compressed spreads. The current HY OAS is tighter than the HY OAS of 6-30-07 and 12-31-97 as noted earlier.
See also:
Footnotes & Flashbacks: State of Yields 2-2-25
Footnotes & Flashbacks: Asset Returns 2-2-25
Tariffs: Questions to Ponder, Part 1 2-2-25
Mini Market Lookback: Surreal Week, AI Worries about “A” 2-1-25
PCE: Inflation, Personal Income & Outlays 1-31-25
Employment Cost Index 4Q24: Labor Crossroad Dead Ahead 1-31-25
4Q24 GDP: Into the Investment Weeds 1-30-25
4Q24 GDP: Inventory Liquidation Rules 1-30-25
Credit Crib Note: Lennar Corp 1-30-25
D.R. Horton: #1 Homebuilder as a Sector Proxy 1-28-25
Durable Goods Dec 2024: Respectable ex-Transport Numbers 1-28-25
New Home Sales Dec 2024: Decent Finish, Strange Year 1-28-25
Footnotes & Flashbacks: Credit Markets 1-27-25
Footnotes & Flashbacks: State of Yields 1-26-25
Footnotes & Flashbacks: Asset Returns 1-26-25
Mini Market Lookback: Policy Blitz Formation 1-25-25
Existing Home Sales Dec 2024: Another “Worst Since” Milestone 1-24-25
Top 10 Fun Facts on Past Presidents and their Economies 1-20-25
Industrial Production Dec 2024: Capacity Utilization 1-17-25
Housing Starts Dec 2024: Good Numbers, Multifamily Ricochet 1-17-25
Retail Sales Dec 2024: A Steady Finish 1-16-25
CPI Dec 2024: Mixed = Relief These Days 1-15-25
KB Home 4Q24: Strong Finish Despite Mortgage Rates 1-14-25
United Rentals: Bigger Meal, Same Recipe 1-14-25
Mini Market Lookback: Sloppy Start 1-11-25
Payroll Dec 2024: Back to Good is Bad? 1-10-25
Payroll % Additions: Carter vs. Trump vs. Biden…just for fun 1-8-25
JOLTS: A Strong Handoff 1-7-25
Annual GDP Growth: Jimmy Carter v. Trump v. Biden…just for fun 1-6-25
Mini Market Lookback: Mixed Start, Deep Breaths 1-5-25
Tariff links:
Tariffs: Questions to Ponder, Part 1 2-2-25
US-Canada: Tariffs Now More than a Negotiating Tactic 1-9-25
Trade: Oct 2024 Flows, Tariff Countdown 12-5-24
Mexico: Tariffs as the Economic Alamo 11-26-24
Tariff: Target Updates – Canada 11-26-24
Tariffs: The EU Meets the New World…Again…Maybe 10-29-24
Trump, Trade, and Tariffs: Northern Exposure, Canada Risk 10-25-24
Trump at Economic Club of Chicago: Thoughts on Autos 10-17-24
Facts Matter: China Syndrome on Trade 9-10-24
Trade Flows: More Clarity Needed to Handicap Major Trade Risks 6-12-24
Trade Flows 2023: Trade Partners, Imports/Exports, and Deficits in a Troubled World 2-10-24
Trade Flows: Deficits, Tariffs, and China Risk 10-11-23