
Footnotes & Flashbacks: Credit Markets 1-20-25
A waiting game on policy plans ruled the past week as equity and UST rallied, IG spreads stayed tight, and HY tightened.


Will the Day 1 tariff moonwalk moderate fears or just slow-roll the dislocations?
Credits spreads remain resilient and compressed with HY even moving -17 bps tighter the past week against the backdrop of the favorable UST moves and solid equity rally (see Mini Market Lookback: The Upside of Volatility 1-18-25, Footnotes & Flashbacks: Asset Returns 1-19-25, Footnotes & Flashbacks: State of Yields 1-19-25).
With PCE inflation, the 4Q24 advance GDP numbers, and an FOMC meeting teed up for the last week of Jan, the delay of the Day 1 tariffs as flagged on Inauguration Day, the UST supply wildcard, the tariff price and cost impacts, and threats of labor dislocations are still not going away.
Social media will be lighting up once parties are over and the Day 1 blitz gets back to the main events the market has been waiting for – tariffs, the scale of deportations and ICE raids, and debt ceiling game plan.
The news that his team will do a study and review of trade strategy and tariffs before moving ahead is good news even if it begs the question: “What the hell were they doing before he said all the things he said on tariffs?” The market can “take the win” that he is not picking a fight with the top 4 trading partners on Day 1. Or at least a win in Game 1 in what will be a long series.
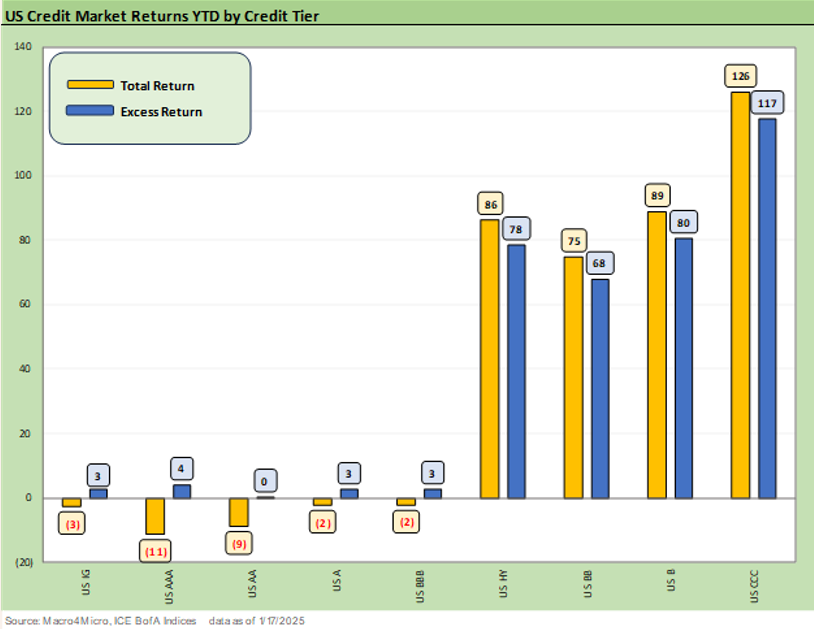
In what is a wild divergence between IG and HY excess returns to start the year, we see impressive YTD excess returns across HY vs. minimal excess returns across the IG tiers.
All of the IG tiers are in negative total return range on the UST shifts. The negative YTD total returns for IG and tiers narrowed substantially this week with the UST rally (see Footnotes & Flashbacks: State of Yields 1-19-25).

The above chart on YTD UST deltas tells a simple story of what is driving YTD IG returns with more duration exposure, very tight spreads in a narrow band, and lower overall coupons vs. the lower credit tiers in HY. The material steepening of the UST curve after this week is more about the bear steepening at the tail end of 2024 and less about YTD deltas. The above is still enough to get more of the IG tiers slightly into negative.

The past week saw minimal IG spread changes of -1 bps to +82 bps. We are slightly above the +77 bps low in Nov 2024.
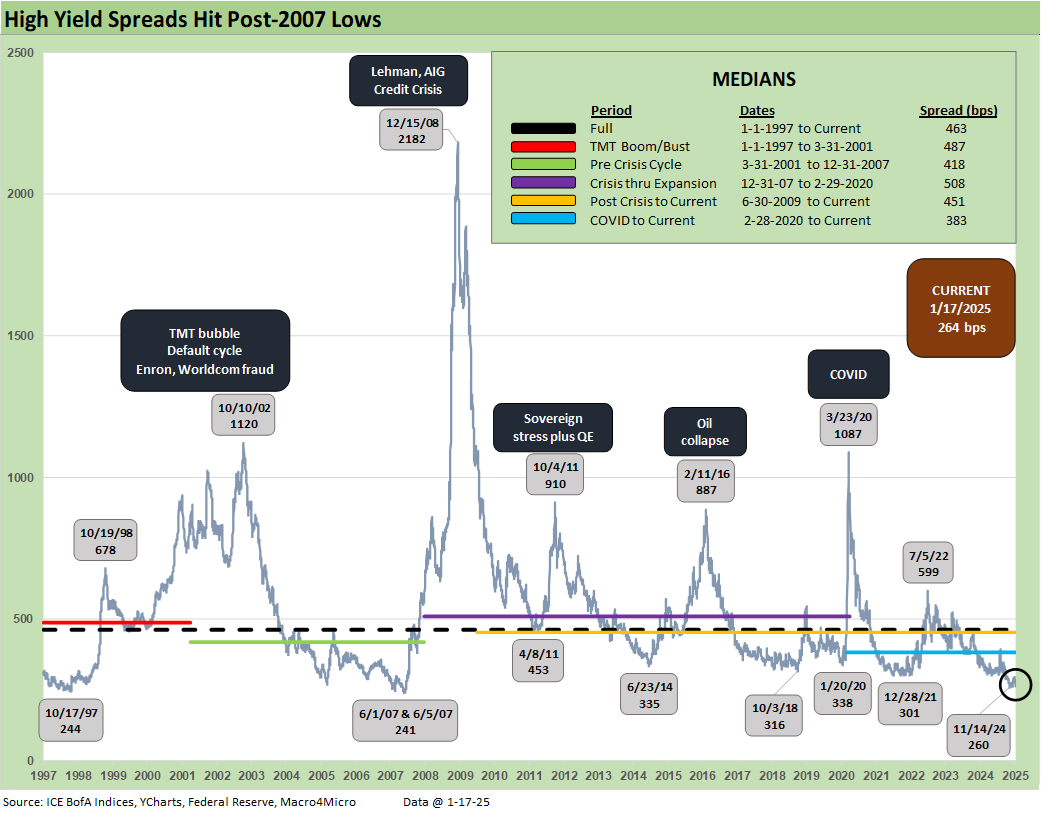
HY spreads had another good week at -17 bps to +264 bps as HY stays pretty much invulnerable to policy noise and some UST volatility including the material increase in the 5Y UST since the Sept lows. Fundamentals have remained resilient and that has been reinforced by the economic releases troubling the UST curve. The front end risk symmetry for floating rate debt (loans) is still biased lower into 2024 with steepening risk a factor further out the curve.

The above chart shows that quality spread differentials for “HY OAS minus IG OAS” narrowed again on the week to +182 bps and is down near the Nov lows of +180 even if still well above the June 2007 lows of +147 bps.

The “BB OAS minus BBB OAS” quality spread differential tightened again this week back down to +61 bps from +72 bps last week on the -12 bps BB tier OAS tightening and minimal moves in IG.

The double-digit tightening in BB OAS to +163 bps the past week leaves BB spreads within whispering distance of the Nov lows of +157 bps and at a level amounting to 55% of the long-term median.

The B tier kept the party going with another -21 bps to +265 bps and near single digit range off the Nov 2024 lows. The B tier OAS is also within shouting distance of the June 2007 +236 bps lows. B tier spreads are materially below credit cycle low points posted in Dec 2021, Jan 2020, Oct 2018, and June 2014.

We update the B and CCC spread history chart above as a reminder of the points across the cycles when the two tiers materially diverge. We cover the histories more in other spread commentaries including some of those posted in the various links below (see Spread Walk: Pace vs. Direction 12-28-24).

The above chart shortens the B vs. CCC timelines to an earlier starting point in Jan 2022 just ahead of the tightening cycle. The material swings in OAS during the 2022 Fed tightening cycle reflect the outsized cyclical anxiety of the period (see Unemployment, Recessions, and the Potter Stewart Rule 10-7-22).

The above time series updates the “CCC OAS – B OAS” quality spread differential. We have looked at these periods of dislocation in past commentaries and notably in The B vs. CCC Battle: Tough Neighborhood, Rough Players (7-7-24). At the current +442 bps, we are comfortably inside the long-term median but well above the 2021 lows of +226 bps.

The above presents a more granular short-term view of the B vs. CCC quality spread differential across the tightening cycle and now into the period of FOMC easing mode. The peak of +741 bps in Nov 2022 has raced in on a range of factors including spread tightening and material constituent changes from defaults and exchanges.
A look at yields…

The above chart updates the long-term time series for IG and HY index yields across the cycles. The current 5.38% for IG and 7.21% for HY reflect the material difference in HY spreads relative to the long-term median (discussed earlier) and the low UST backdrop.
We favor the pre-crisis, pre-ZIRP medians of +6.1% for IG and 9.3% for HY as more relevant comps given the extensive FOMC-driven distortion of the ZIRP, QE, and semi-normalization periods from 2008 across the post-crisis recovery and sustained COVID monetary response from ZIRP to credit backstops. HY spreads are near prior credit cycle peaks (including bubble periods such as June 2007), and the UST curve is exceptionally low by any cyclical standard outside the ZIRP periods (see Footnotes & Flashbacks: State of Yields 1-19-25).

The chart updates the IG index yields (horizontal lines) and UST curves for the Friday close vs. earlier credit cycle peaks of June 2007 and late 1997. The IG index is now a $9.1 trillion face value market and a long way from the $2.0 trillion size in June 2007 (see Credit Markets Across the Decades 4-8-24).
With tight spreads in each of those markets for IG, the all-in yields are all about the yield curve. In this market, the UST is materially lower than those prior peaks in the credit cycle. The term premium debate on taking duration risk thus stays alive in IG extension from cash as well. IG bond allocators also are offered a growing base of alternatives for those who can take medium grade and HY lite exposure. In addition, some can migrate to higher quality loan exposure.
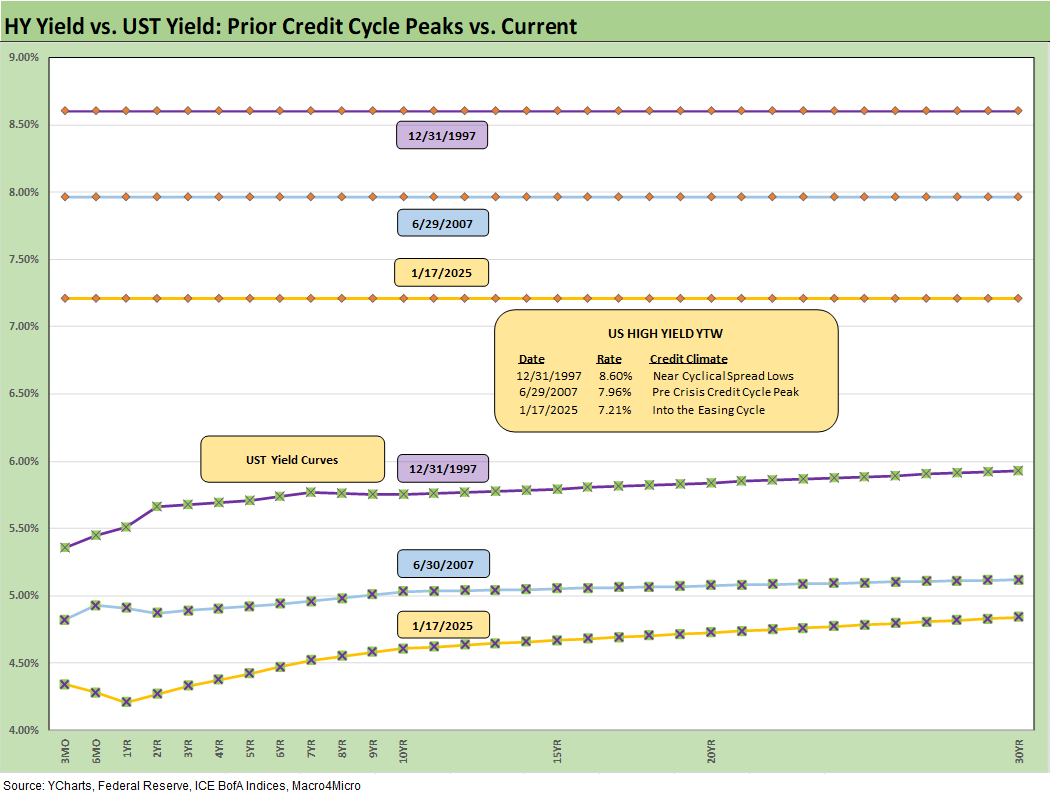
We do the same exercise for HY above that we did for the prior IG index comments. The HY index has grown more slowly than the IG market to a $1.38 trillion face value now from $680 billion in June 2007.
The array of alternatives for HY bond credit investors in loans and various structures has offered many low-cost alternatives for borrowers. For the highest risk deals, loans broadly and the private credit markets more narrowly have eclipsed HY bonds.
The current 7.2% YTW is below the earlier cycles based on the UST curve since all of the periods presented were compressed in HY OAS. The higher quality mix of the HY index now is a factor with over 52% of BB face value mix in HY (vs. 40% BB in June 2007). The low end CCC mix now is almost 14% vs. almost 19% in June 2007.
See also:
Footnotes & Flashbacks: State of Yields 1-19-25
Footnotes & Flashbacks: Asset Returns 1-19-25
Mini Market Lookback: The Upside of Volatility 1-18-25
Housing Starts Dec 2024: Good Numbers, Multifamily Ricochet 1-17-25
Industrial Production Dec 2024: Capacity Utilization 1-17-25
Retail Sales Dec 2024: A Steady Finish 1-16-25
CPI Dec 2024: Mixed = Relief These Days 1-15-25
KB Home 4Q24: Strong Finish Despite Mortgage Rates 1-14-25
United Rentals: Bigger Meal, Same Recipe 1-14-25
Mini Market Lookback: Sloppy Start 1-11-25
Payroll Dec 2024: Back to Good is Bad? 1-10-25
US-Canada: Tariffs Now More than a Negotiating Tactic 1-9-25
Payroll % Additions: Carter vs. Trump vs. Biden…just for fun 1-8-25
JOLTS: A Strong Handoff 1-7-25
Annual GDP Growth: Jimmy Carter v. Trump v. Biden…just for fun 1-6-25
Mini Market Lookback: Mixed Start, Deep Breaths 1-5-25
Footnotes & Flashbacks: Credit Markets 2024 1-3-25
Footnotes & Flashbacks: Asset Returns for 2024 1-2-25
HY and IG Returns since 1997 Final Score for 2024 1-2-25
Spread Walk 2024 Final Score 1-2-25
Footnotes & Flashbacks: Asset Returns for 2024 1-2-25
Credit Returns: 2024 Monthly Return Quilt Final Score 1-2-25
Annual and Monthly Asset Return Quilt 2024 Final Score 1-2-25
HY and IG Returns since 1997: Four Bubbles and Too Many Funerals 12-31-24
Mini Market Lookback: Last American Hero? Who wins? 12-29-24
Spread Walk: Pace vs. Direction 12-28-24
Annual and Monthly Asset Return Quilt 12-27-24
Credit Returns: 2024 Monthly Return Quilt 12-26-24
 |
|