
Footnotes & Flashbacks: State of Yields 2-2-25
With tariff chaos on the not-so-welcome mat, the UST curve will see economic setbacks and inflation worries.


I could have sworn those icebergs were fake news…
As the market sees a global trade war breaking out as of now, there might be some reconsideration of how thoughtful the process around budget discipline might prove to be with the application of basic economic concepts similarly out of school. The fear is that UST supply discipline will unravel with an obedient radicalized House and submissive, spineless Senate.
The trade-off of self-inflicted industrial level setbacks and the risk of capex retrenchment and flight to quality will get traded off against what will be very ambitious pro forma budget deficits and uncertainty in the debt ceiling process.
There are not a lot of capital market backdrops to look at across history for global trade war precedents. (Like none in the postwar era.) That is because the US never started one before in the modern capital markets era. Smoot-Hawley before that did not work out so well.
The same lack of history is the case in the event of a likely clash by Trump with the Fed and what that would mean for UST market confidence. The purge mentality and ignoring existing laws on the books are already very much in evidence.
“Brinkmanship” can no longer be downplayed as just some tactic but more empirically reflects a behavior pattern (as in off the rails). Keep in mind that Trump is a character who recommended that the House GOP default on UST in a CNN town hall during the Biden years. That is not partisan at this point but rather an obvious fact.
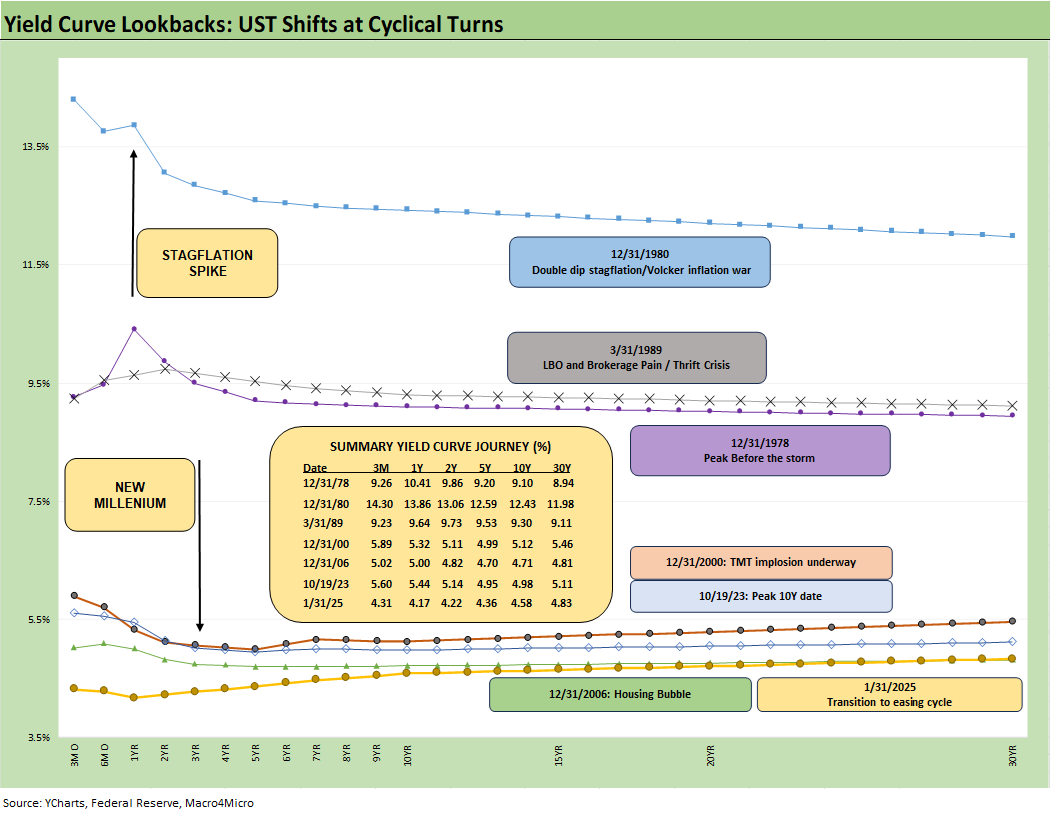
The above chart updates the UST curve migration we look at each week for some important frames of reference that are mostly from the pre-crisis, pre-ZIRP/QE years. We also include the 10-19-23 UST curve to mark the high point on the 10Y UST and the post-crisis peak on rates.
We include the yields in the box and plot the UST curve to hammer home how low UST rates actually are across history outside the ZIRP years.
These pre-crisis UST curves end in 2006 but go back to the Carter inversion of 1978. Those periods are more rational to use as frames of reference as we move further into the post-inflation easing cycle outside “ZIRP world.”
The yields in the box for Friday close are numbers that one can play with to “war game” cuts in the fed funds rate and how that flows into the short end in 3M UST. You can then play with the slope of the UST curve out to the 5Y UST or 10Y UST and consider what could be a normalized or partially normalized slope.
For example, take a 3.0% UST and add a 100 bps slope and you can get to 4.0%. That 3.0% 3M UST is more than 100 bps away. Meanwhile a 100 bps 3M to UST slope is well inside the 3M to 10Y UST median slope of +159 bps. That is one of the reasons we like to monitor slopes (this week we look at the 3M to 10Y slope further below).
The bottom line is that it gets challenging to get 10Y rates much lower without the overlay of a materially negative macro call in the economic picture and something close to the 2.0% line in PCE inflation.
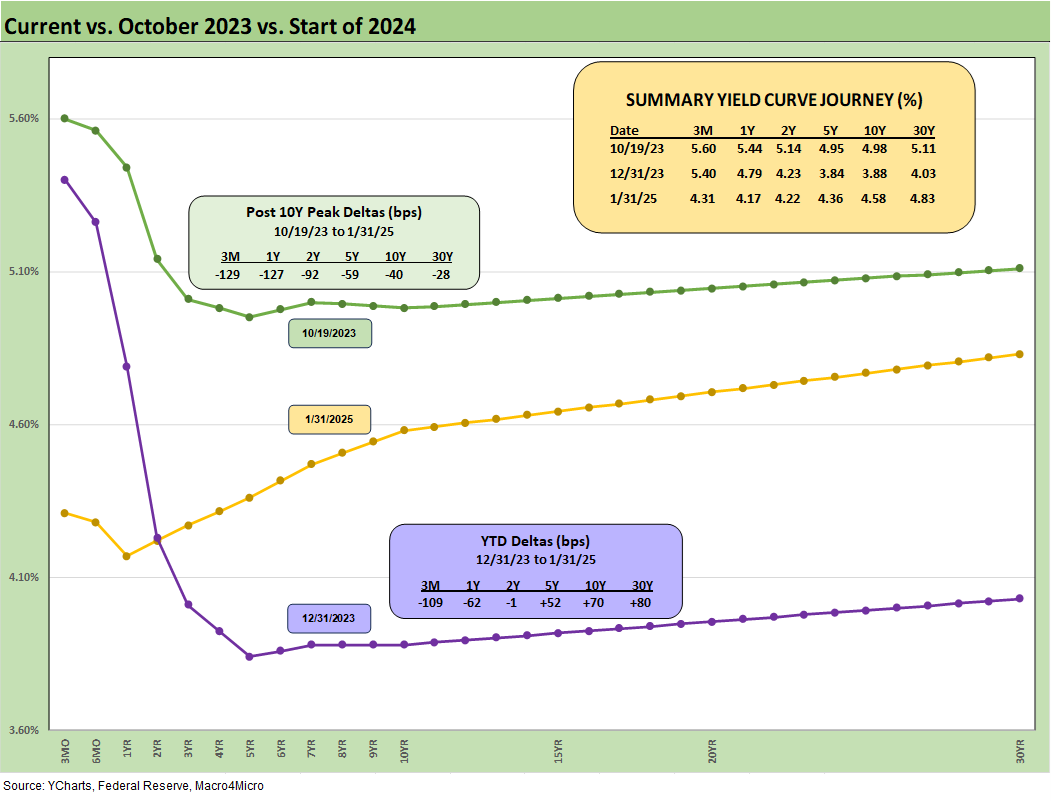
The above chart updates the UST deltas from the 10-19-23 peak and from the start of 2024. In the boxes within the chart, we include the UST deltas and yields for each date, and we plot the UST curves. The steepener mixes good news on the short end (lower rates) since Oct 2023 with bad news on the long end since the start of 2024.
The material UST bear steepener we see in 2024 was not the consensus on the way into 2024 when 5-6 cuts and a bull flattening out past 2 years was expected by many. We just passed another FOMC meeting with no change. The next two FOMC meetings will have more data in hand after the start of the tariff war, and the Fed will have no choice but to discuss the Trump tariff and deportation impacts.
Along the way, Trump’s next war (with EU) also might kick into gear even as he looks to take over the Fed while they are considering the inflationary impact of his policies. He will need more entities to blame (in this case the Fed) since he will not take the blame for his policies when they fail to perform as he expects.
Congress will take no action to support the Fed under the cowed GOP House and Senate while the Democratic leadership will be doing the Curley Shuffle in the rotunda.
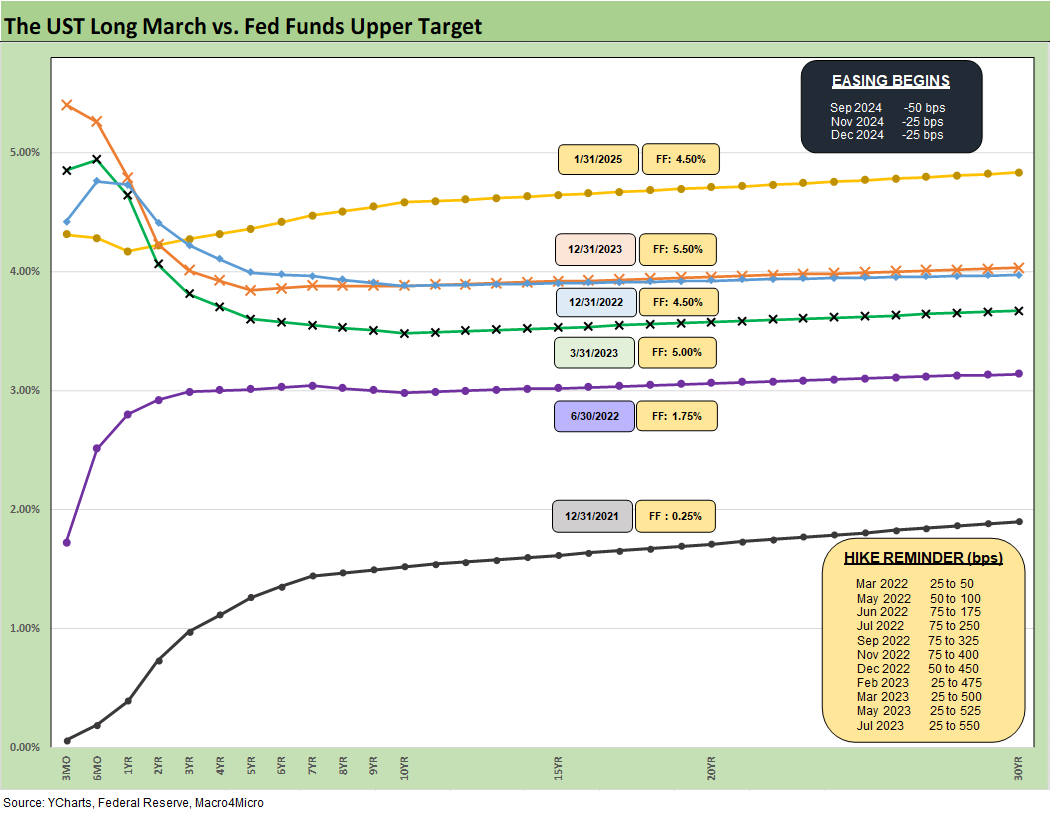
The above chart updates the UST migration across the tightening cycle. We see one material move lower across the period which happened in March 2023 with the regional bank crisis.
We routinely restate that the 10Y UST does not have to follow fed funds higher and lower. We saw the 10Y convergence of year end 2023 and 2022 with a 100 bps differential in fed funds, and we saw a UST steepener and 10Y UST move higher in an easing cycle on the front end in 2024. That is enough empirical evidence even away from the radically outsized deficits and borrowing needs that are about to get a lot more radical.
The promises before the election and the actions taken after are a mixed bag already. The promise of high growth and low inflation will soon be DOA. High tariffs are here as of now and mass deportation is still a guessing game on labor dislocations. The Project 2025 denial rings hollow since that is already underway.
From our vantage point, we will need a recession to move long rates lower. We will also need a lot more UST buyers globally. It will be interesting to watch to see if the credit rating agencies take any more action on this fiscal “cluster of circles.”
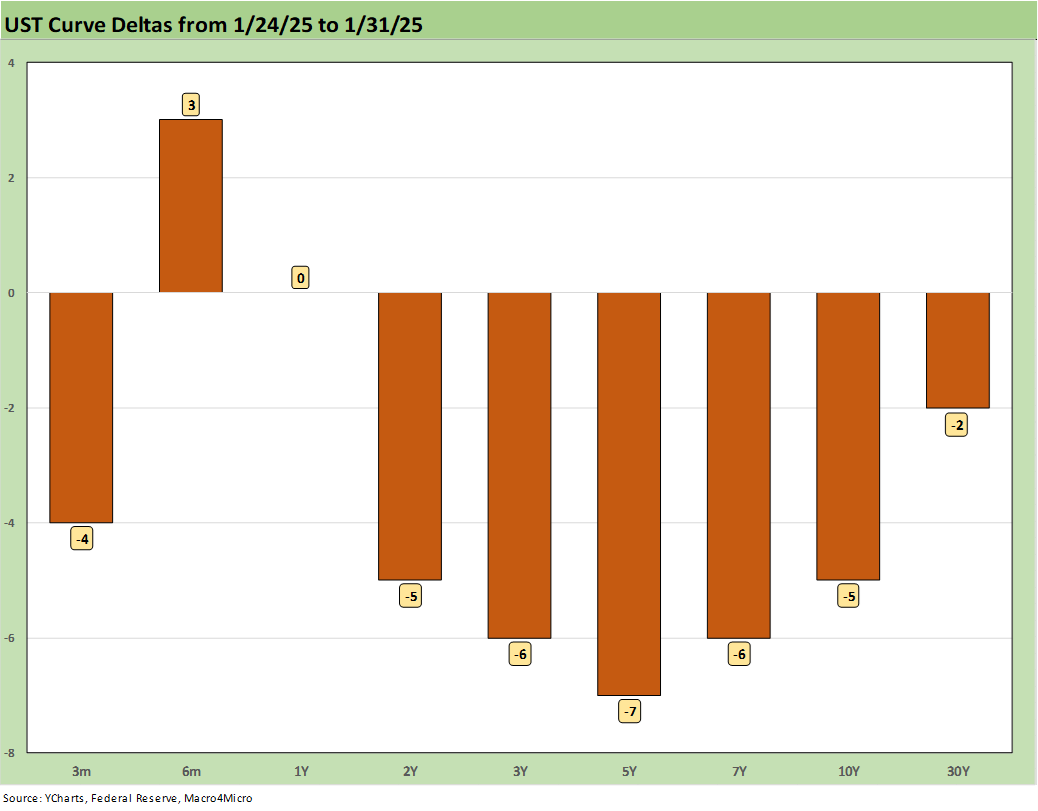
The 1-week UST deltas show a mild week but with bias lower as the 10Y UST is still well above the 3.6% handle lows of Sept. The FOMC ended up as somewhat of a nonevent this past week holding rates where they were with Trump doing some sniping at the Fed.
Trump’s plate was full the last two weeks with his wide array of edicts from immigration to deportation to agency and Justice Department purging among other very controversial media magnet topics. By the weekend, he was able to get his planned trade wars underway.
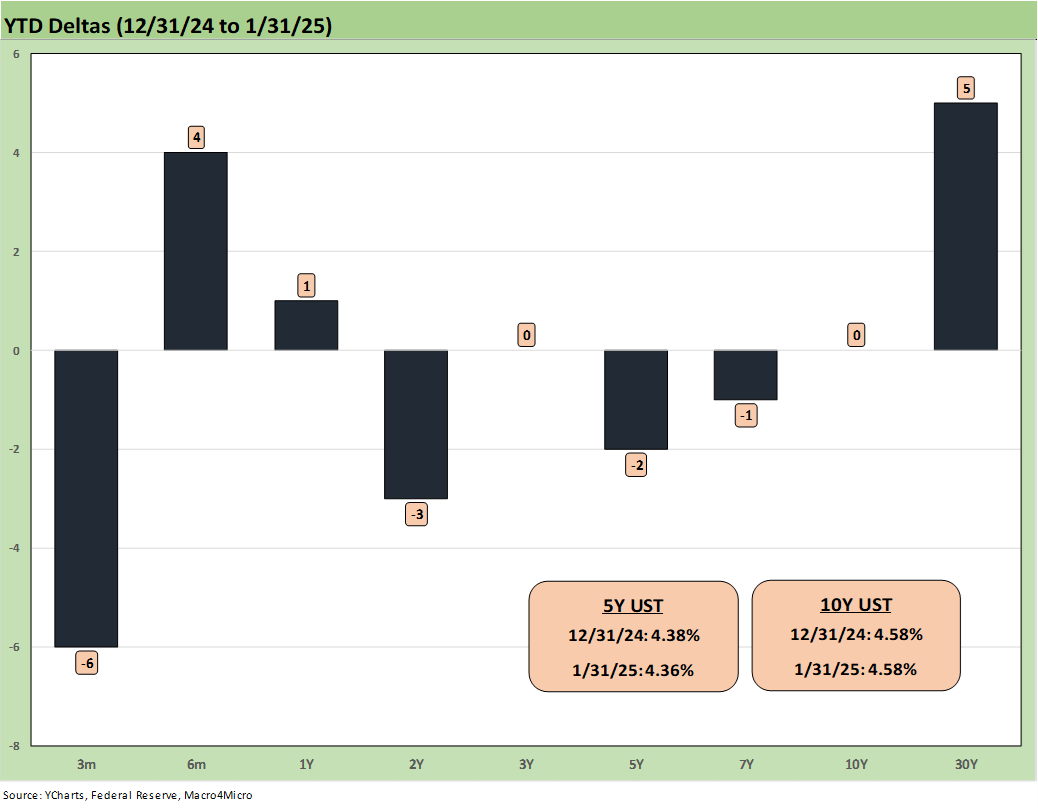
The YTD UST deltas are mild to this point after a very tough Dec and 4Q24 volatility that hit bond funds and roiled the UST markets as we detail further below.
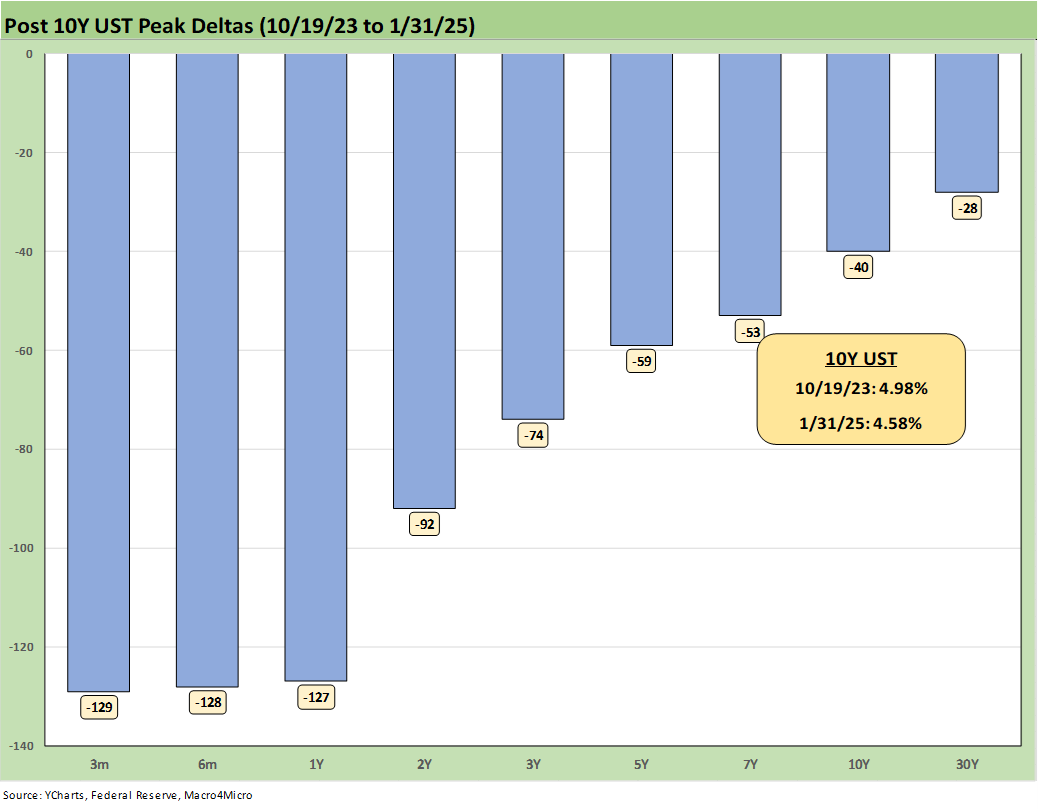
The UST deltas from the 10-19-23 peak on the 10Y UST are framed above. While the easing cycle and bull steepening pattern remain evident, the direction of the 10Y UST and 30Y UST will remain a source of concern until the markets get a sense of inflation risk on tariffs, supply risks on debt ceilings, and budget process pyrotechnics. The role of the Fed has to be seen as heading for a showdown after such a trade war maneuver. Recklessness is the order of the day in the White House.
While the prevalence of subpar brain power (i.e. dumb asses) in the House is a routine SNAFU in Washington, the utter lack of spines in the Senate with people who generally (not entirely) know better is something new and worrisome on checks and balances. The willingness to let Trump have a blank check on the deficit while China can reassess its appetites for UST holdings means incremental buyers will need to multiply like bacteria. If short rates move lower and the dollar weakens, that is going to be a challenge.
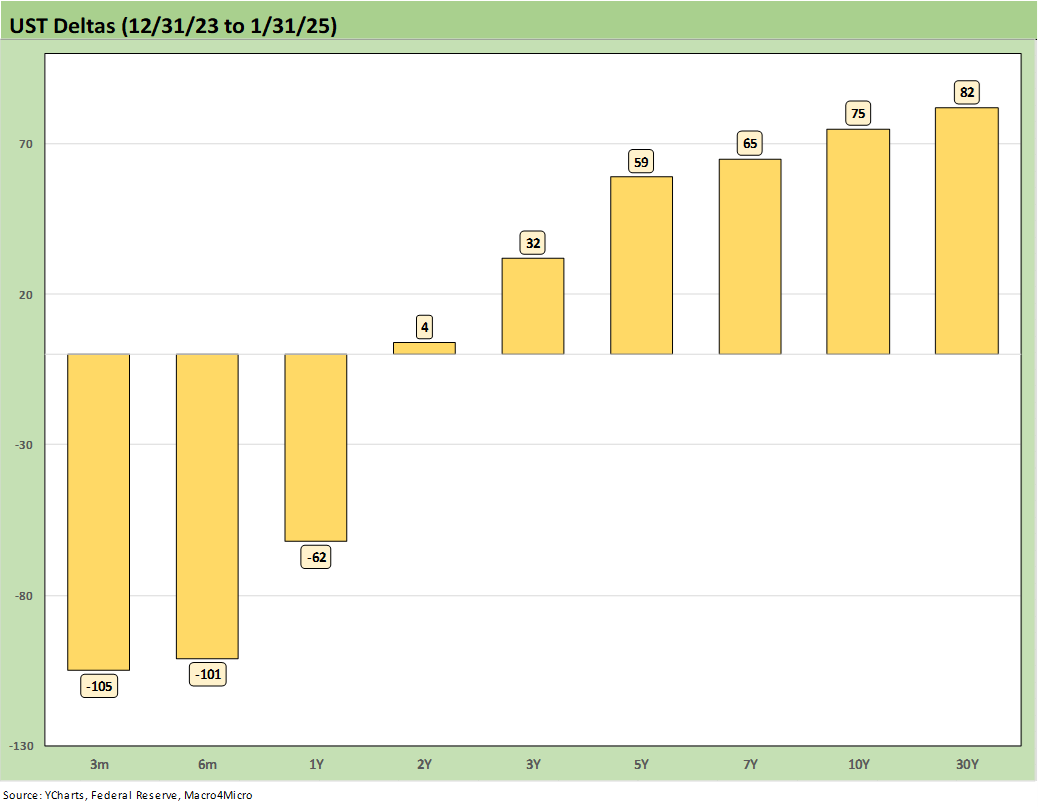
The above chart updates the running UST bear steepener from the end of 2023 to this past week. This was sure not the consensus back in Dec 2023.
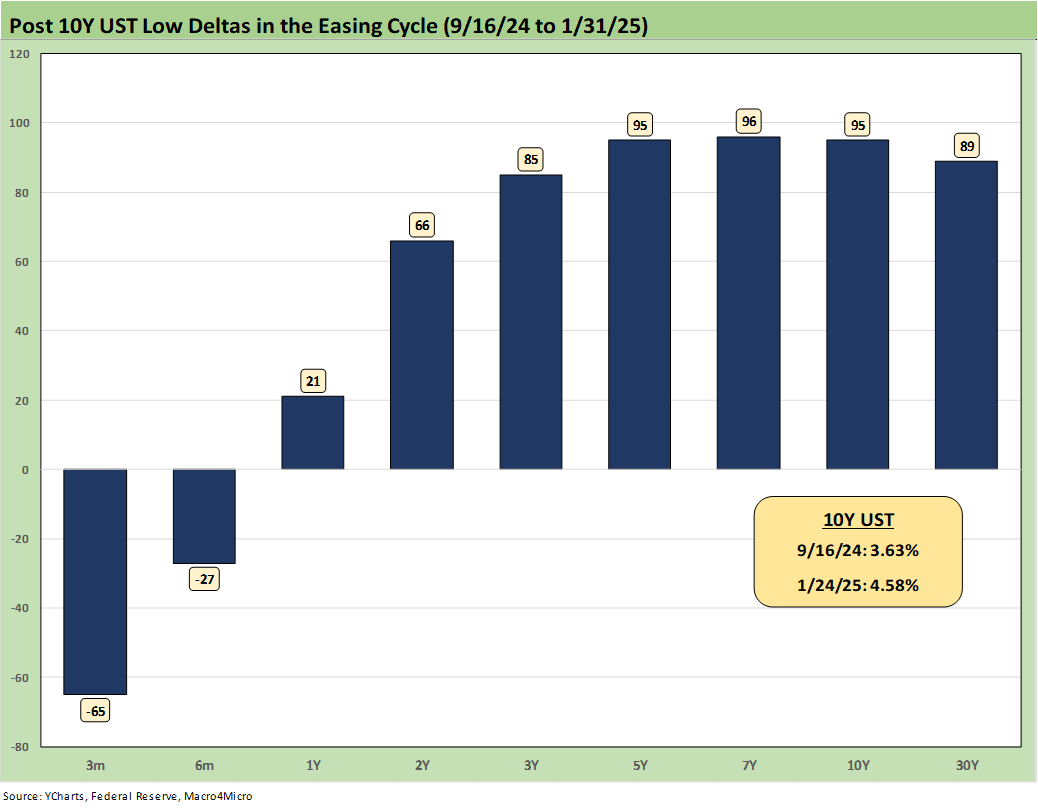
The above chart updates the UST deltas off the Sept 2024 lows. We see a pretty rough bear steepener beyond 1Y UST with a mid-90 bps range increase in yields on the 5Y to 10Y yield rise.
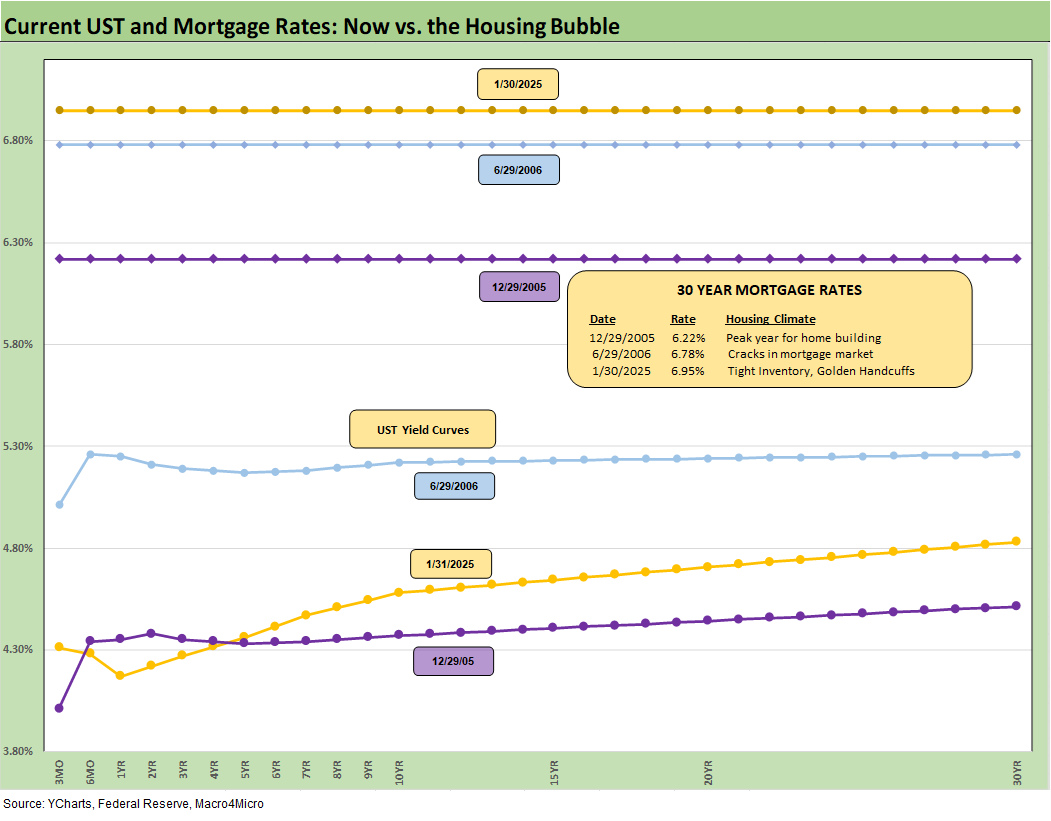
The above chart updates the Freddie Mac 30Y Mortgage benchmark (horizontal lines) and UST curves for the Friday close. We use two useful historical “macro comps” including the peak homebuilding year of 2005 (12-31-05) and mid-2006 period as the RMBS excess was starting to show signs of serious erosion.
The current Freddie Mac rate posts the highest mortgage rate on the chart despite a materially lower UST curve than June 2006. Mortgage spreads and the UST curve both will need to cooperate to get back to the 6.0% line. We have moved around within an almost 200 bps band since fall of 2023 on the 30Y mortgage rate.
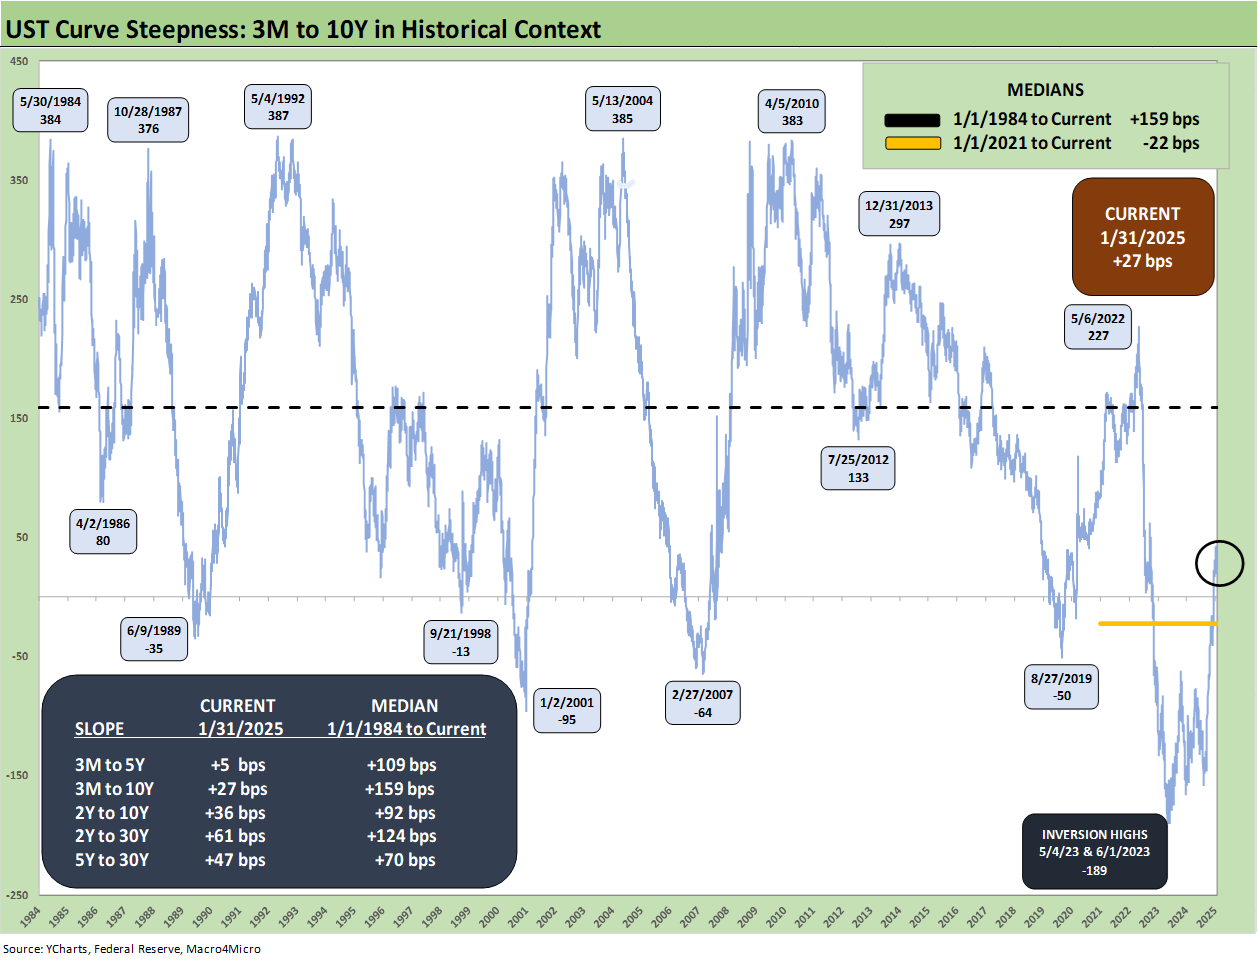
We update the 3M to 10Y UST slope above. At +27 bps, the slope is well inside the +159 bps long-term median. If you believe the 3M UST can shave off another 50 bps this year, you still see the math on the historical slope of +159 bps makes it very hard to get the 10Y UST under 4% relative to the current 4.5%. As an example, you can shave off 50 bps from the 3M UST of 4.3%. Then you have 3.8%. That is tough math for the 10Y UST in the event of a remotely normal slope. Pick a number? A 50 bps slope is 4.3% (3.8% + 50 bps) while a 100 bps slope (vs. +159 median) is 4.8% (3.8% + 100 bps). That approach is quite simplistic, but it is food for thought.
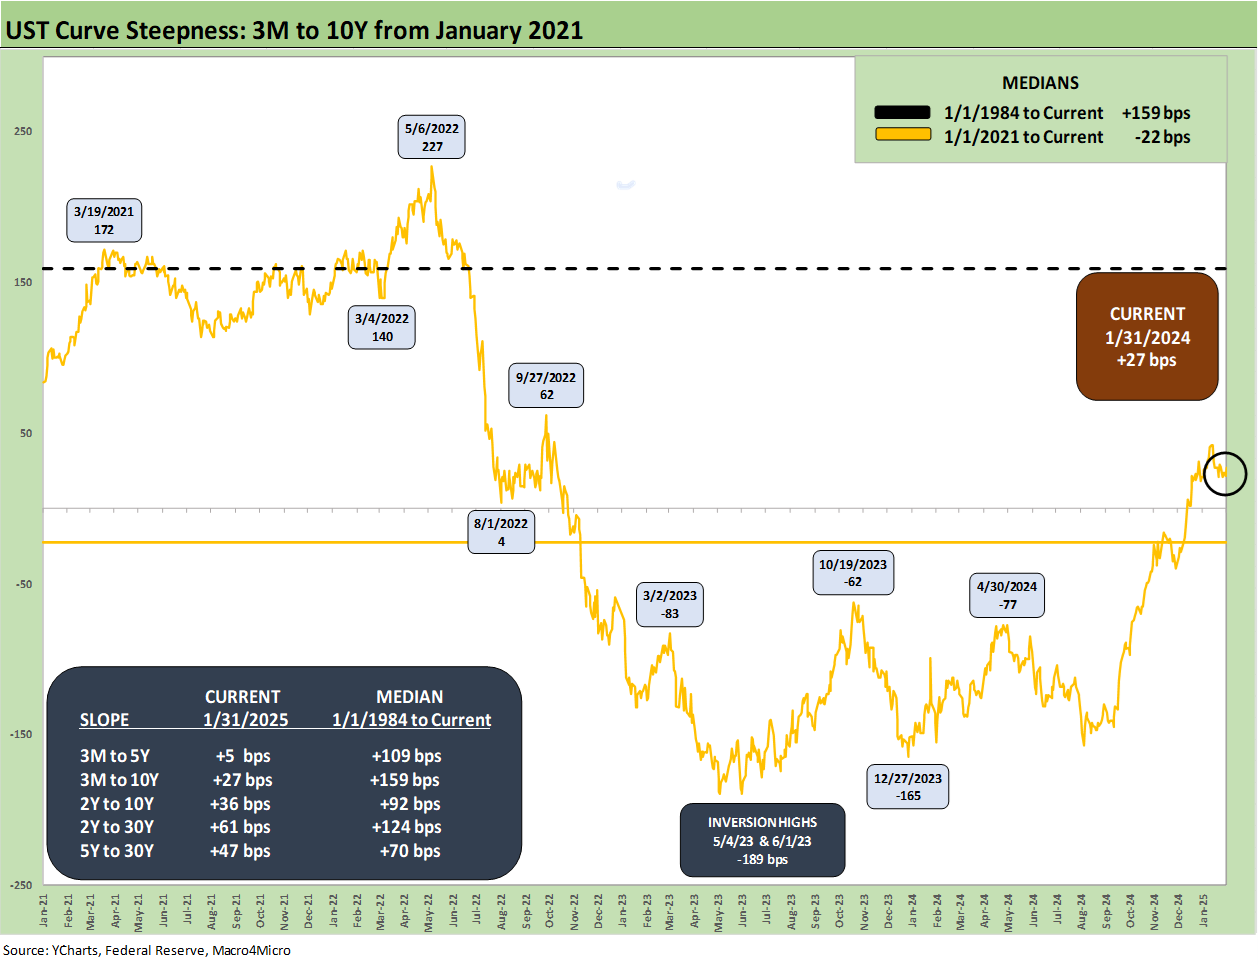
The above chart shortens up the timeline to early 2021 when ZIRP ruled before the start of the March 2022 tightening cycle. We see a +172 bps slope in March 2021 and +227 bps in May 2022 on the way to a peak inversion of -189 bps in May and June of 2023. We hit a positive +27 bps to end this past week.
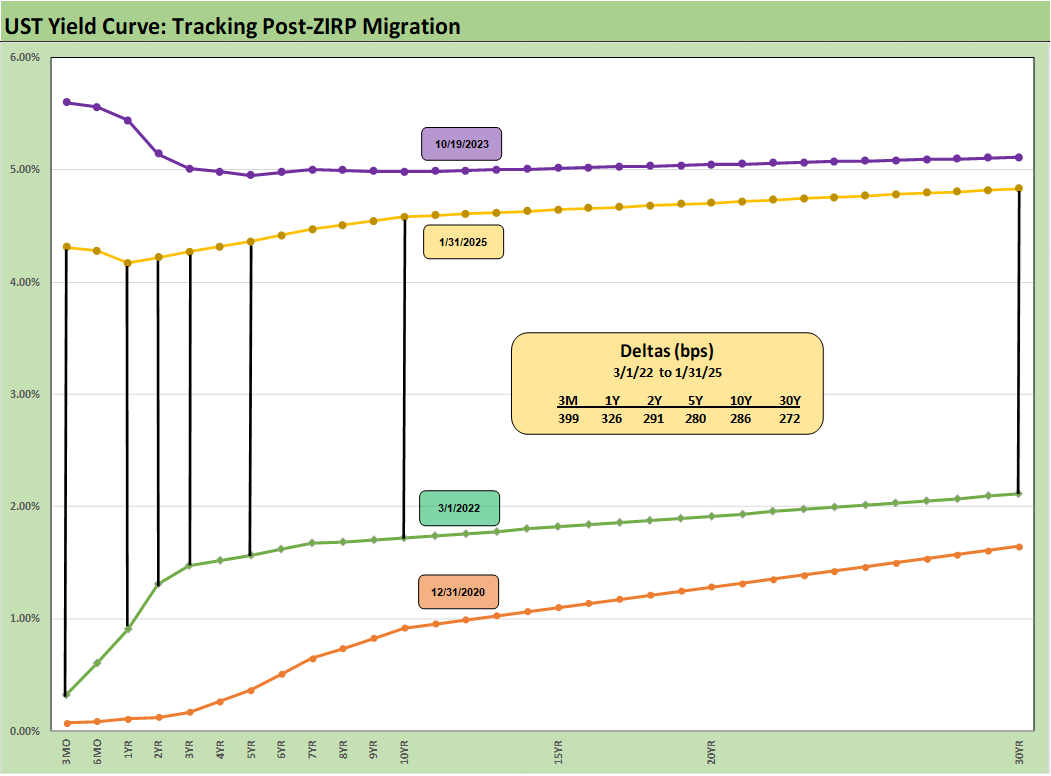
We wrap this week’s footnotes update with the UST deltas from March 1, 2022 in the month ZIRP ended (effective March 17, 2022). We include the UST curve for the 10-19-23 peak date for the 10Y UST and the 12-31-20 curve as frames of reference. We are much closer to the peak date in Oct 2019 curve in the long end than the March 2022 curve.
See also:
Footnotes & Flashbacks: Asset Returns 2-2-25
Tariffs: Questions to Ponder, Part 1 2-2-25
Mini Market Lookback: Surreal Week, AI Worries about “A” 2-1-25
PCE: Inflation, Personal Income & Outlays 1-31-25
Employment Cost Index 4Q24: Labor Crossroad Dead Ahead 1-31-25
4Q24 GDP: Into the Investment Weeds 1-30-25
4Q24 GDP: Inventory Liquidation Rules 1-30-25
Credit Crib Note: Lennar Corp 1-30-25
D.R. Horton: #1 Homebuilder as a Sector Proxy 1-28-25
Durable Goods Dec 2024: Respectable ex-Transport Numbers 1-28-25
New Home Sales Dec 2024: Decent Finish, Strange Year 1-28-25
Footnotes & Flashbacks: Credit Markets 1-27-25
Footnotes & Flashbacks: State of Yields 1-26-25
Footnotes & Flashbacks: Asset Returns 1-26-25
Mini Market Lookback: Policy Blitz Formation 1-25-25
Existing Home Sales Dec 2024: Another “Worst Since” Milestone 1-24-25
Top 10 Fun Facts on Past Presidents and their Economies 1-20-25
Industrial Production Dec 2024: Capacity Utilization 1-17-25
Housing Starts Dec 2024: Good Numbers, Multifamily Ricochet 1-17-25
Retail Sales Dec 2024: A Steady Finish 1-16-25
CPI Dec 2024: Mixed = Relief These Days 1-15-25
KB Home 4Q24: Strong Finish Despite Mortgage Rates 1-14-25
United Rentals: Bigger Meal, Same Recipe 1-14-25
Mini Market Lookback: Sloppy Start 1-11-25
Payroll Dec 2024: Back to Good is Bad? 1-10-25
Payroll % Additions: Carter vs. Trump vs. Biden…just for fun 1-8-25
JOLTS: A Strong Handoff 1-7-25
Annual GDP Growth: Jimmy Carter v. Trump v. Biden…just for fun 1-6-25
Mini Market Lookback: Mixed Start, Deep Breaths 1-5-25
Tariff links:
Tariffs: Questions to Ponder, Part 1 2-2-25
US-Canada: Tariffs Now More than a Negotiating Tactic 1-9-25
Trade: Oct 2024 Flows, Tariff Countdown 12-5-24
Mexico: Tariffs as the Economic Alamo 11-26-24
Tariff: Target Updates – Canada 11-26-24
Tariffs: The EU Meets the New World…Again…Maybe 10-29-24
Trump, Trade, and Tariffs: Northern Exposure, Canada Risk 10-25-24
Trump at Economic Club of Chicago: Thoughts on Autos 10-17-24
Facts Matter: China Syndrome on Trade 9-10-24
Trade Flows: More Clarity Needed to Handicap Major Trade Risks 6-12-24
Trade Flows 2023: Trade Partners, Imports/Exports, and Deficits in a Troubled World 2-10-24
Trade Flows: Deficits, Tariffs, and China Risk 10-11-23