
Footnotes & Flashbacks: State of Yields 6-22-25
The UST curve saw a mild rally during FOMC week, but Iran risk raises a mix of issues.


You sure you want to do this?
The next leg of the journey of the US into Mideast conflicts are now upon us, but this time with a top 20 country in the population rankings with a very extremist bent (see Footnotes & Flashbacks: Asset Returns 6-22-2025).
The risk of a nuclear weapon was enough to force the bunker buster decision, so we can add more fear of the unknown to an untested and unproven theories around how massive tariffs and trade policy risks will unfold for reshoring and economic growth.
The past week’s FOMC news was anticlimactic as the FOMC stayed in hold mode as the markets hunker down for a real world test for tariffs. The tariff fallout for expense lines, pricing strategies, cost mitigation plans and labor markets will get some better visibility over the summer (see FOMC Day: PCE Outlook Negative, GDP Expectations Grim 6-18-25). Oil prices will be a wildcard with the Iran responses a major unknown.
This week the market will get a fresh round of PCE price details, consumer income and outlays data, and the final 1Q25 GDP stats.
The following updates our rolling weekly State of Yields commentary.
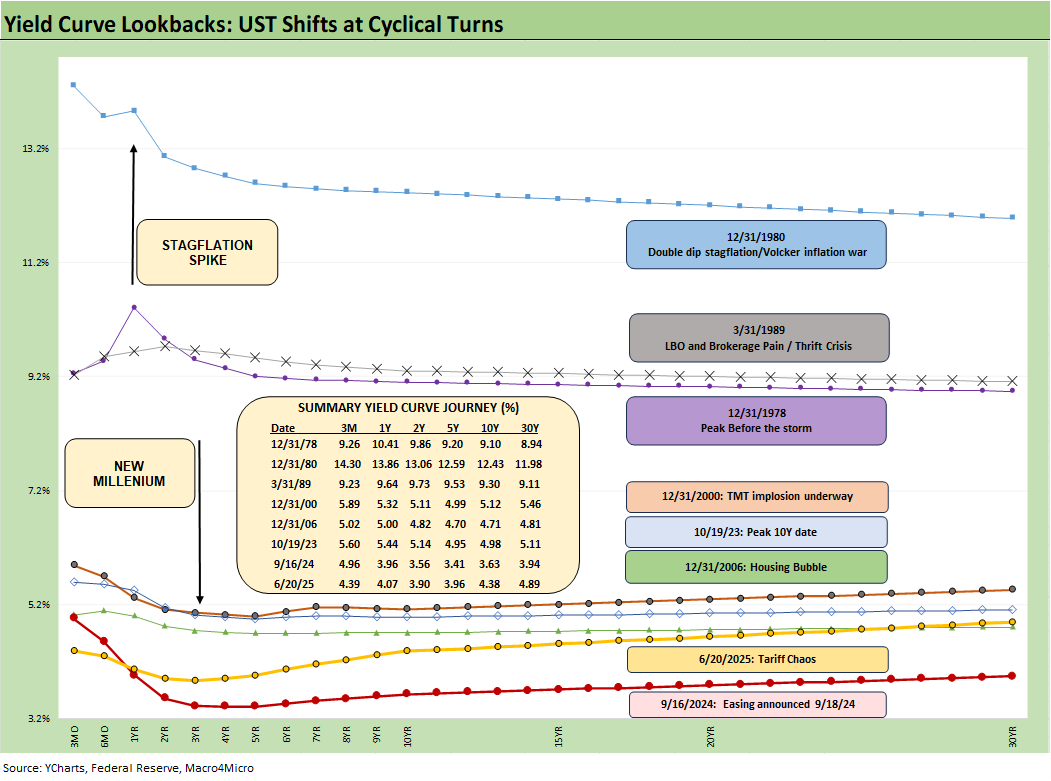
The above chart plots some key cyclical transition periods from the Carter inversion of 1978 across the Volcker years, the1980s credit cycle peak in 1989 (note the 9.2% 3M UST), the TMT cycle faltering in 2000 (on the way to a massive Greenspan easing in 2001), and the housing bubble in 2006. During the 2004 to 2007 period, leveraged derivative exposure and structured credit were out of control and counterparty risk was soaring.
The chart then jumps from 2006 to 2023 beyond the crisis period and the ZIRP years and COVID after the Fed went wild to save the capital markets and support the banks. That brought plenty of QE and normalization distortions of the curve shape. Steeper and higher was not the forecast to start 2024, and the curve has moved in an adverse direction since the Sept 2024 easing even with the modest YTD rally. Iran and oil will add volatile variables into market behavior via oil prices and possible further military action in the coming weeks.

The above replays our weekly chart detailing the migration of the UST curve from 12-31-21 with memories box detailing the tightening dates and magnitude and more recently the easing. The UST curve seems to intermittently mix bear steepening patterns and flattening rallies since the Sept 2024 lows, but market fear was creeping into the shapeshifting after Liberation Day before calming down with the pause.
We shifted back into the bear steepening along the way while mixing in some mini rallies. The UST curve will not be helped by record supply and shrinking demand, fears around the dollar, and diminished confidence in US governance. We are looking at the highest risk of stagflation since the1980-1982 double dip, and tariffs will certainly not help. A Mideast war might not help either. After all, 1979 was the Iranian Oil Crisis.
This past week we saw another round of no action by the Fed with an increase in the number of votes for no change in 2025 to 7 from 4 in the “Gang of 19” dot plot (see FOMC Day: PCE Outlook Negative, GDP Expectations Grim 6-18-25).

The above chart details the material move from the peak UST curve of 10-19-23 down into the UST bull rally of Nov-Dec 2023 and then eventually into the lows of Sept 2024. The Sept 2024 low tick only came after a bear steepener hit the curve through the summer of 2024. We then moved back into the bear steepener mode until the tariffs roiled the UST markets and initially sent 2Y to 30Y lower on cyclical fears.
The shift higher from Sept 2024 lows and the steepening from the low point at the end of 2023 is in the chart. We see the 10Y and 30Y notably higher with a more normal shape from 2Y out to 30Y. The challenge is still that front end inversion from 3M. This week we look at the 2Y to 10Y to UST slope history further below. The inversion anomaly on the front end during a protracted expansion has been hard to shake with the FOMC holding the line over tariff-related inflation questions. The stubborn 10Y UST has been a headwind for the housing market (see Home Starts May 2025: The Fade Continues 6-18-25, Lennar 2Q25: Bellwether Blues 6-20-25).
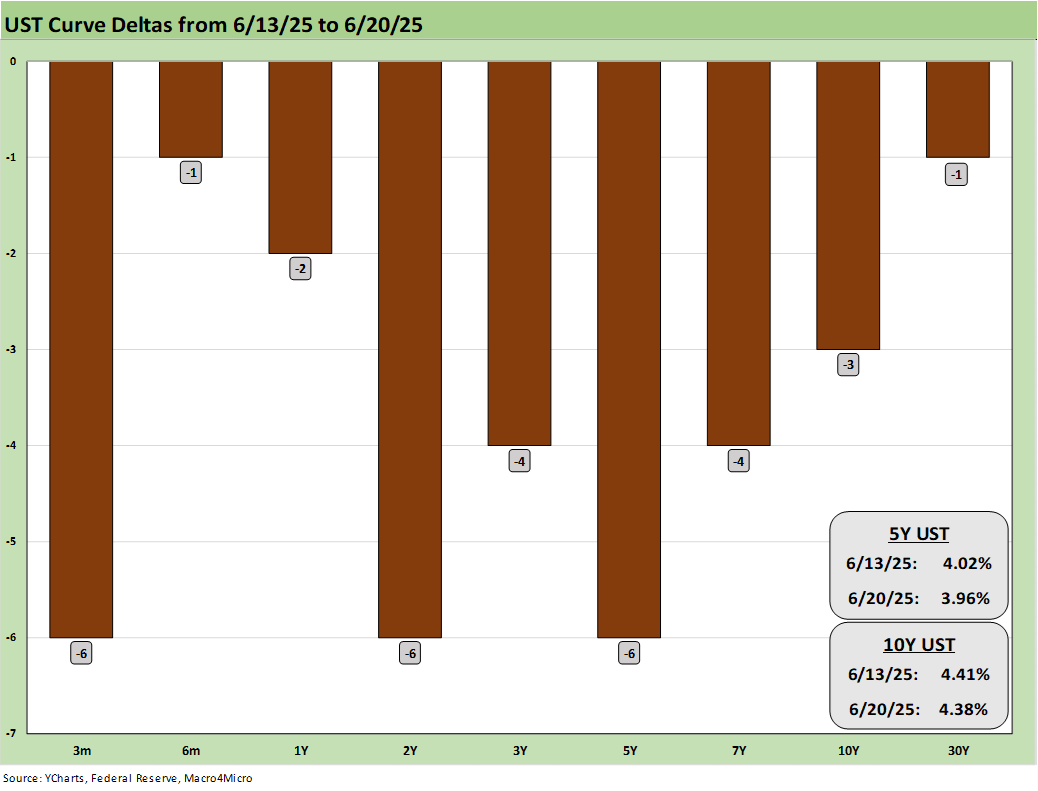
The above breaks out the weekly UST deltas that we already looked at in Mini Market Lookback: FOMC Spoke Clearly, Iran and Trump up next 6-21-25). The UST curve pushed lower during the prior week as the FOMC held the line and we saw a range of adverse forecast medians for GDP growth and a more defensive mix of Fed median targets for FY 2025. The 3.9% median for 2025 year-end still is calling for 2 cuts. PCE median inflation expectations rose for headline and Core PCE, the unemployment median rose again, and GDP growth estimates declined further again.
The forecast median is for sub-2% GDP growth for the next 3 years and 1.4% for 2025. That would signal higher easing odds if it was not for the PCE risk factor and tariff uncertainty. Trump of course blames Powell and not his tariff plan. The broad consensus on PCE inflation clearly is about more than Powell in the Gang of 19 dot plot.

The YTD UST deltas are broken out above. We still see a rally from 2Y to 10Y, but the 30Y relationship had been breaking down in the UST volatility. For duration risk, all 7 bond ETFs are in positive return range YTD (see Footnotes & Flashbacks: Asset Returns 6-22-2025).

The above chart updates the UST deltas since the 9-16-24 lows that came alongside the easing. That has not worked as many market watchers predicted on the shape of the UST curve and number and pace of easing that was supposed to follow. While Trump continues to rail at the Fed and Powell, demanding 100 bps in cuts, the FOMC would likely be easing if it was not for Trump’s over-the-top and unprecedented tariff game plan.
Easing would appear to need a jobs setback that has not appeared in recent releases. The summer period should answer some questions on the initial price vs. cost impacts of tariffs. The latest wildcard in macro risk is the military clash with Iran, so there are some new variables in the inflation and the GDP growth equation. Oil prices are usually tagged as transitory across the years, so tariffs will remain the main event for the FOMC this summer.

The above chart updates the UST deltas from the end of 2023 after a massive rally in rates and risk in Nov-Dec 2023. The follow-on in 2024 per the consensus mildly disappointed the UST bulls in the number of FOMC cuts (the market got 4 x 25 but not the number of 5 to 6 FOMC 25 bps cuts expected). The expectation of a pronounced bull flattening during 2024 also did not play out when a bear steepener prevailed by the end of the year. As detailed in the earlier chart, the 2025 period has fared better for bonds on a modest bull steepener.

The above chart updates the running UST deltas from the 10-19-23 peak date of the UST 10Y when it barely missed the 5.0% line. For those looking for a frame of reference on what a bad move in inflation metric might mean, these deltas at least offer a recent set of data points during an inflation fighting year such as late 2023 and into 2024 (until Sept 2024 began the easing process). That is why we keep revisiting that timeline. It reminds us what reversion could mean.
These rally deltas could reverse in part or in whole with the wrong inflation outcomes. We don’t need to see 2022 again, but the old saying “It happened before, it can happen again” resonates for many.
Losing a rally of -60 bps in the 10Y UST above would hurt the mortgage market and would lead to a material valuation headache in equities, M&A economics, and capital project planning. Mortgages have been a drag on housing (new and existing home sales). The risk of inflation heading the wrong way would do more damage. Stubborn rates or higher rates in the short end to 5Y would damage consumer durables financing and related volumes.
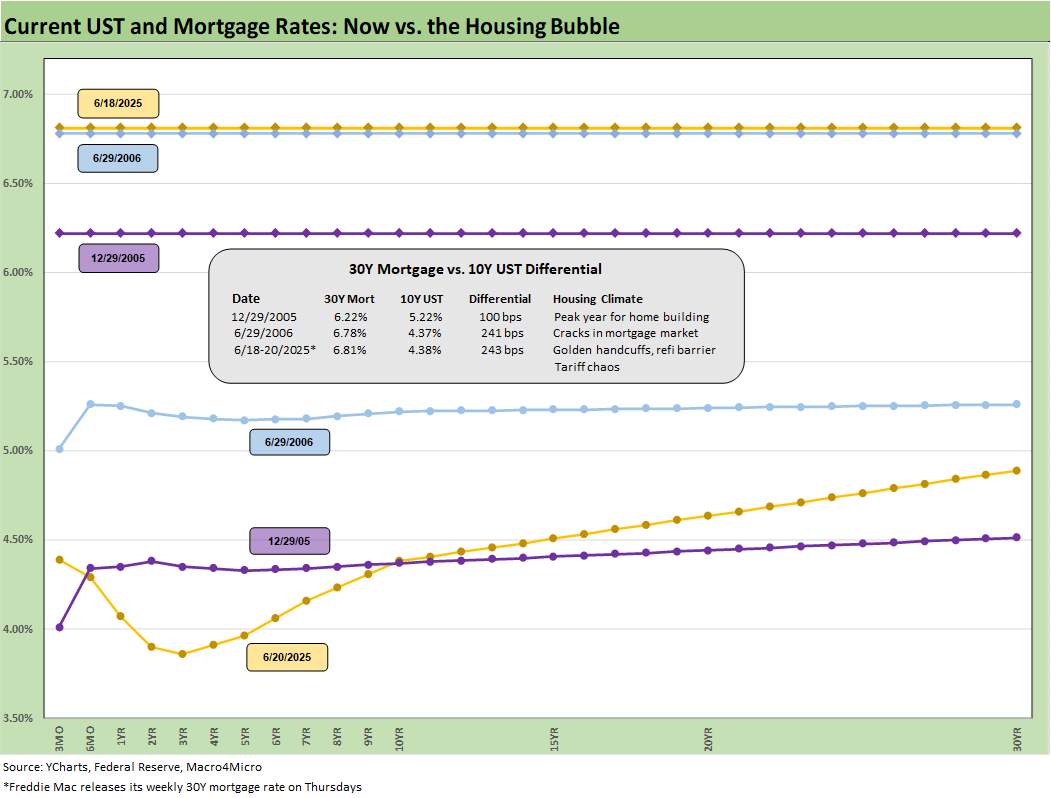
The above chart is one of those replay slides we update each week. This one posts the UST curve for this past Friday and the Freddie Mac 30Y Mortgage benchmark rate (noon Thursday release). We include two useful historical periods including the peak homebuilder year end of 2005 and mid-2006 when RMBS quality concerns were catching headlines as the housing bubble was peaking.
We post UST curves for each period in the chart. The past week saw rates move lower to 6.81% from 6.84% after 6.85% the prior week. We have seen minor moves recently after a 200 bps range since fall 2023. The Mortgage News Daily survey ended Friday at +6.86%.
We include a column above detailing the differential between the Freddie Mac 30Y and the 10Y UST. That differential stayed flat this week at +243 bps. The year 2005 posted a differential of only +100 bps and makes a statement on what the mortgage market was like in 2005. The mortgage market was very hot back then in the housing bubble as mortgage volumes soared during that peak homebuilding year and a very busy period of refinancing was running alongside as a source of funds for homeowners.
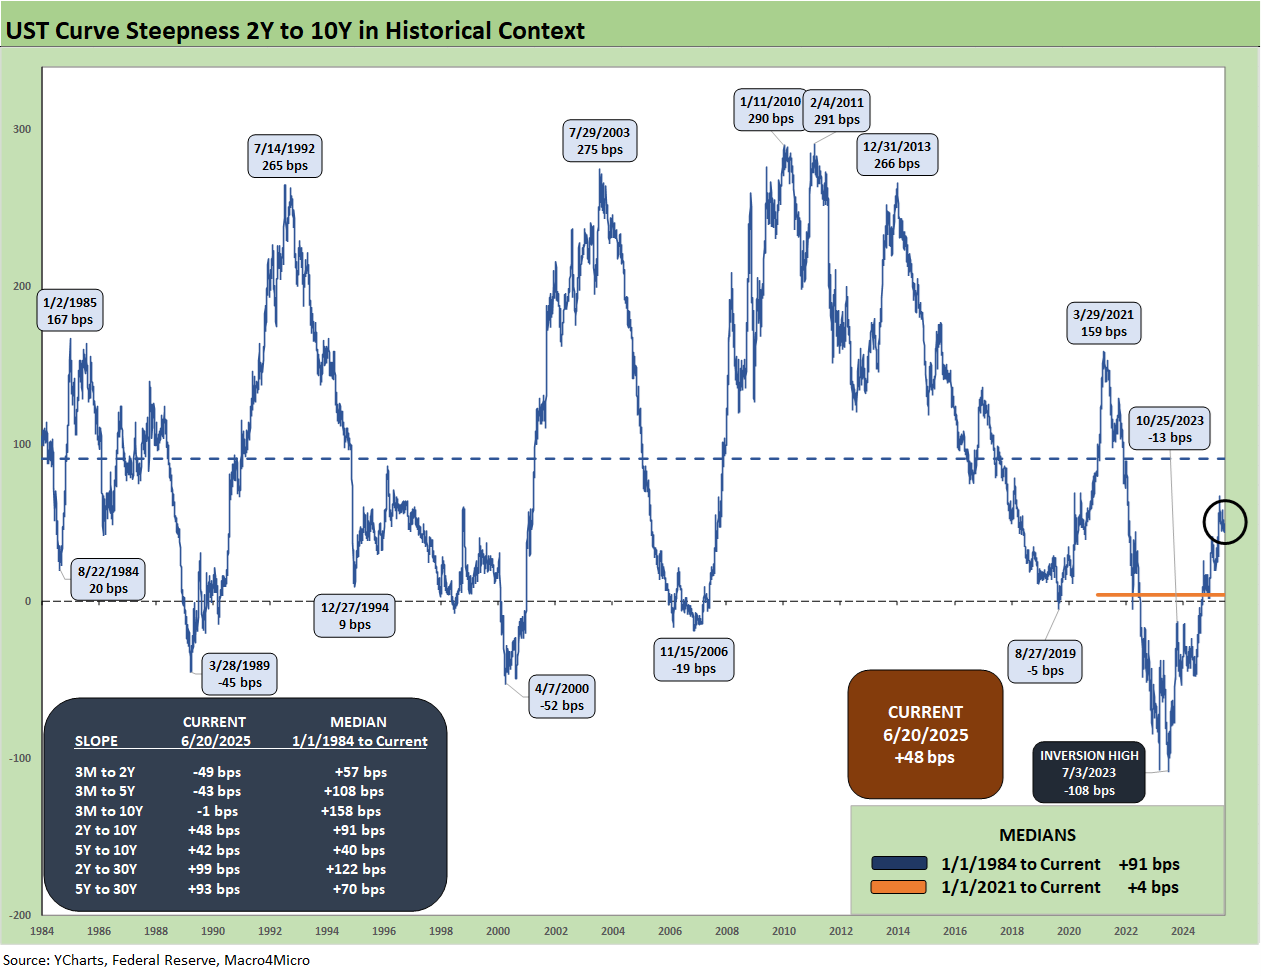
We update the 2Y to 10Y UST curve slope above since 1984 with the current upward slope of +48 bps running below the long-term median of +91 bps. We also include the slopes and long-term medians of the other curve segments we watch.
The front end inversion remains an anomaly, and that heightens pressure on the FOMC to ease given that history. That said, the market is also coming off the first inflation spike since the early 1980s. That has in turn promoted caution.
Another anomaly is the phase-in of widespread steep tariffs with many more to come. The policy in process has never happened in the modern capital markets era. That also feeds the FOMC’s sense of caution to deal with such a threat to goods pricing. That tariff read will play out over the summer alongside the usual data priorities. The 2Q25 earnings season could offer more color from companies on tariff impacts. Final decisions of tariffs have been very slow. That promotes even more uncertainty.

The above chart shortens the time horizon from early 2021 and ZIRP on through the tightening cycle and into the easing period and recent moves. We see a peak slope of +159 bps in March 2021 down to a peak inversion of -108 bps in July 2023 and then the swing back to positive and the current +48 bps.

We wrap this week’s State of Yields with an update of the running UST deltas since March 1, 2022 just ahead of the end of ZIRP (effective 3-17-22). We include the 12-31-20 UST curve and 10-19-23 peak UST curve as frames of reference.
See also:
Footnotes & Flashbacks: Asset Returns 6-22-2025
Mini Market Lookback: FOMC Spoke Clearly, Iran and Trump up next 6-21-25
Lennar 2Q25: Bellwether Blues 6-20-25
FOMC Day: PCE Outlook Negative, GDP Expectations Grim 6-18-25
Home Starts May 2025: The Fade Continues 6-18-25
May 2025 Industrial Production: Motor Vehicle Cushion? 6-17-25
Retail Sales May 25: Demand Sugar Crash 6-17-25
Footnotes & Flashbacks: Credit Markets 6-16-25
Footnotes & Flashbacks: State of Yields 6-15-25
Footnotes & Flashbacks: Asset Returns 6-15-25
Mini Market Lookback: Deus Vult or Deus Nobis Auxilium 6-14-25
Credit Snapshot: Hertz Global Holdings 6-12-23
CPI May 2025: The Slow Tariff Policy Grind 6-11-25
Mini Market Lookback: Clash of the Titans 6-7-25
Payrolls May 2025: Into the Weeds 6-6-25
Employment May 2025: We’re Not There Yet 6-6-25
US Trade in Goods April 2025: Imports Be Damned 6-5-25
Past-Prologue Perspective for 2025: Memory Lane 2018 6-5-25
JOLTS April 2025: Slow Burn or Steady State? 6-3-25
Tariffs: Testing Trade Partner Mettle 6-3-25
Mini Market Lookback: Out of Tacos, Tariff Man Returns 5-31-25
PCE April 2025: Personal Income and Outlays 5-30-25
Credit Snapshot: Meritage Homes (MTH) 5-30-24
1Q25 GDP 2nd Estimate: Tariff and Courthouse Waiting Game 5-29-25
Homebuilder Rankings: Volumes, Market Caps, ASPs 5-28-25
Durable Goods Apr25: Hitting an Air Pocket 5-27-25
Mini Market Lookback: Tariff Excess N+1 5-24-25
New Home Sales April 2025: Waiting Game Does Not Help 5-23-25
Existing Home Sales April 2025: Soft but Steady 5-22-25
Credit Snapshot: Lithia Motors (LAD) 5-20-25