
Footnotes & Flashbacks: Credit Markets 6-23-2025
Credit markets had another quiet week with some tightening down the risk spectrum. The week ahead holds elevated risks stemming from Middle East conflict after this weekend’s actions.

The ultimate risk management exercise. Hope the hedges hold.
After a spring season of heightened spread volatility, the credit markets posted a second relatively quiet week set against some negative Fed macro forecasts and Middle East chaos. IG spreads held flat, and HY tightened -5 bps. As spreads start to settle back towards beginning of year levels, CCCs continue to lag the bounce back with bottom-tier credit under the most scrutiny amid macro uncertainty (see Mini Market Lookback: FOMC Spoke Clearly, Iran and Trump up next 6-21-25).
The big event last week was the FOMC meeting with a dot plot reflecting a mixed view on easing as the tariff unknowns drove lower GDP and higher PCE inflation forecasts for 2025. The market remained largely unfazed, with the Fed’s decision to stay in hold mode already well anticipated (see FOMC Day: PCE Outlook Negative, GDP Expectations Grim 6-18-25).
The weekend saw Middle East tensions come to a head with the US bombing action. This heightened a full range of geopolitical risks across Iranian retaliation, oil pricing, terrorism, and further military action (see Footnotes & Flashbacks: Asset Returns 6-22-2025).
The markets (oil, equities, UST) have shown a muted response so far on Monday with stocks higher as we go to print and oil lower even with Iran firing missiles at US bases. The risk of an oil price shock can never be dismissed, but it will take a lot to shake the markets on the oil issue. Iran will need to demonstrate that it can really disrupt Gulf flows when Israel and the US can respond in much greater force and with immediate results.
The Fed still faces a complex picture of tradeoffs with tariff fallout that already posed a considerable 2H25 threat. The working capital management cycle, reciprocals, and new Section 232 tariffs are still the top risk factor for the FOMC and credit markets.
The week’s economic releases include Existing Home Sales, Durable Goods, final 1Q25 GDP stats, PCE inflation, and Income and Outlays. The PCE release will restate the tariff debate on “do they or don’t they impact prices” but those answers will unfold gradually even if protectionist advocates want to pretend the votes are in and there is no price impact. The market tone could lean heavily on geopolitical news flow if retaliations by Iran sets off a fresh round of military action. The market can reach the conclusion that Iran will fail and get quickly crushed in terms of its missile capabilities.

The above chart shows another week of quiet 1-week and 1-month spread moves as the more intensive period of volatility in the market has started to fade after a wild 2.5-month ride with its triple-digit Hi-Lo range. The FOMC meeting results this week were anticlimactic in terms of easing dialogue with the 3.9% median forecast for the year still calling for 2 cuts.
The increase in the number of dots (from 4 to 7 in the Gang of 19) seeing no change in fed funds in 2025 was notable. We also saw continued upward revisions in PCE inflation (headline and core) from the Fed following increases in March. The unemployment forecast ticked higher and the GDP growth forecasts lower to 1.4% for 2025 and sub-2% for 2026 and 2027.
Middle East tensions were largely left as a “wait-and-see” affair until the market “saw” tension become actual bombing over the weekend. With the possible escalation to a broader war, the risk handicapping exercise begins with oil prices at the top of the list for the markets as this week kicks off. The market got a reassuring answer today as missiles fired by Iran at US military bases saw oil prices decline. The risk of more sustained retaliation by Iran is unpredictable. For now, they do not seem to be able to punch above their weight class.
Recent spread moves reflect a waiting game with so much dead ahead. Investors are setting aside the worst case scenarios of the tariff-driven volatility for now with critical China trade chaos mitigated. That said, there is plenty of room for disappointment from the coming tariff pressures, and the risk symmetry is not favorable.
Current levels are much closer to mid-March and well below the peaks at +120 bps for US IG and +461 for US HY. The post-May rally sent IG spreads to just under +90 bps range and low +300 range for US HY and levels appear to have settled here for now. This leaves the YTD moves at +6 bps for US IG and +21 for US HY across a very busy 1H25.
Credit markets still face rising materials prices from tariffs (steel, aluminum, copper, lumber), and that has to flow up across PPI into goods prices at some point. Oil prices may not spike if the military tension subsides, but oil has a history of challenging the ability to predict. Oil can flow very quickly into day-to-day operations for energy intensive corporates and consumer discretionary cash flows (e.g. gasoline at the pump). At least US and Canada production capacity has soared since prior oil spikes and will temper the worst of the impacts.
For a summary discussion of Iran risks see our asset return commentary posted on Sunday (see Footnotes & Flashbacks: Asset Returns 6-22-2025).

The return picture for the US credit markets is shown above and another relatively quiet week meant another week of minor changes to returns. Total returns increased as last week saw a mild bull steepening of the curve even as the Fed delivered bad news on inflation and economic growth into 2H25 (see State of Yields). Excess returns remain anemic for the year with BBs the top performers and CCCs still in negative territory.
The total return picture remains anchored by the 2Y-10Y rally YTD on UST even if facing threats on record deficits and UST supply. The Big Beautiful Bill discussion lurks as a risk factor for UST supply and the debt ceiling wildcard. Trump had even asked to scrap the debt limit, so the timeline to necessary early July debt ceiling relief will get more attention. UST supply expectations leave a lot of duration risk and the usual dollar questions. The elevated – and uncertain – risks for oil prices and inflation after this weekend mean that US IG return volatility risks will remain tied to the UST curve reactions.
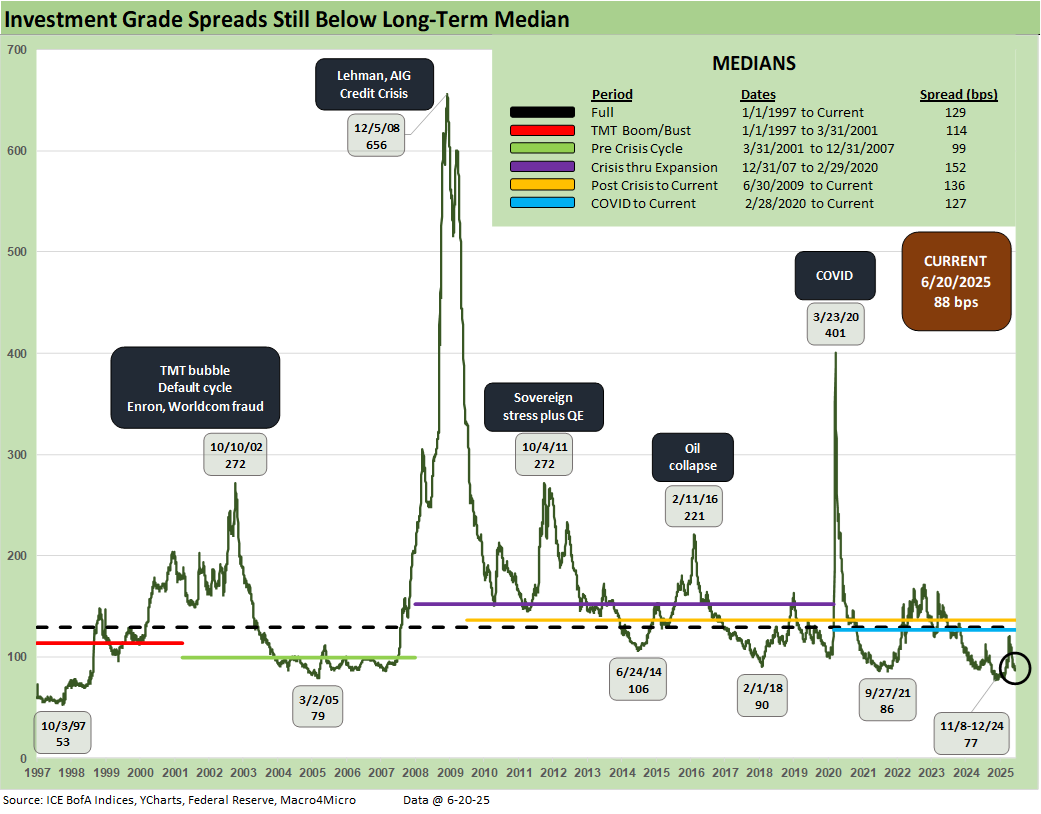
US IG spreads ended the week flat, well into the double-digit territory and +6 bps wider YTD. Spread moves for IG remain insulated from tariff driven volatility but also showed little concern as Middle East tensions rose last week.
The potential for any oil impact does not necessarily have to resemble the inflation spike of 2022 after Russia-Ukraine, but inflation from tariffs and oil could still be painful. Even the absence of lower oil prices would be a negative sequential trend since we were at $60 bbl for WTI in late May vs. just below $70 as we go to print. Some in the market were hoping for lower oil to mitigate the impact of tariffs. More inflation would undermine consumption and keep financing costs high for consumers and small business employers who also face higher tariff expenses.
The IG OAS level is likely a challenge to sustain later into this year with stagflationary risks heightened and new tariff headlines continuing to roll in. A credit market sell-off would require a material catalyst after so much tariff, geopolitical and Washington political sensory overload.
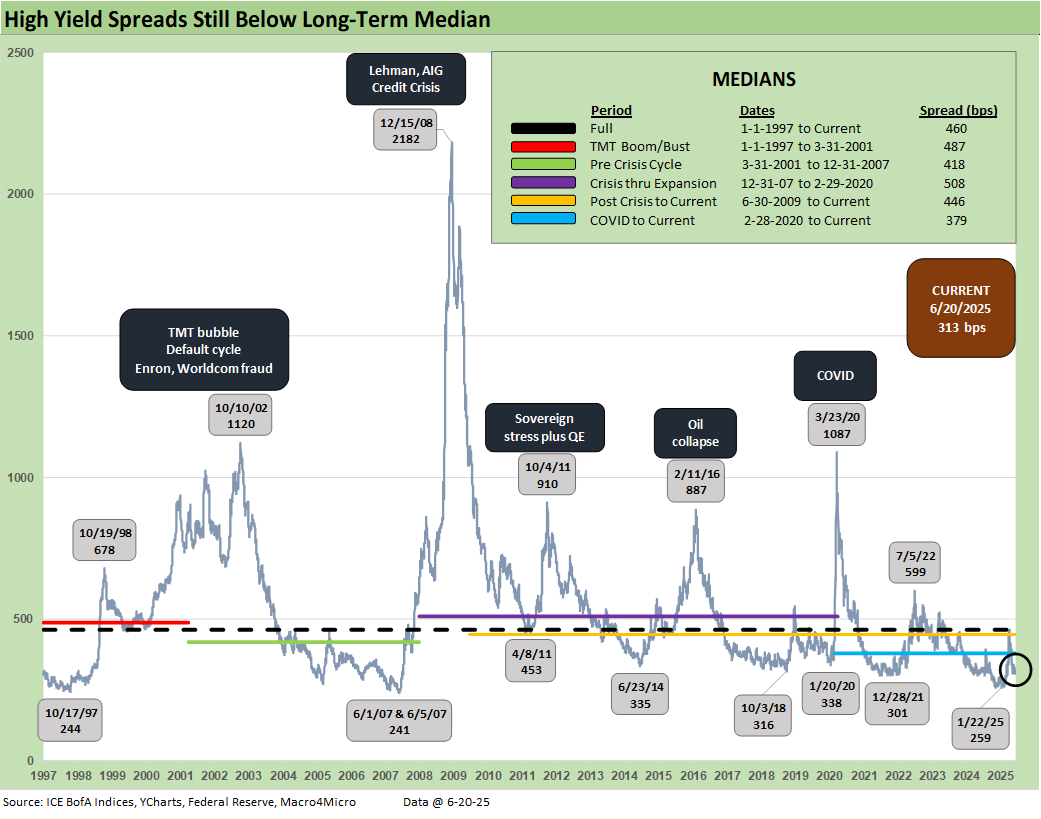
This week saw -5 bps of tightening for US HY down to +313 bps with spreads remaining in the low +300 range. This week’s rally sees spreads just below both the 2014 and 2018 cyclical lows. The current market needs a lot to go right on the trade and energy front to remain at these compressed levels. Looking back to Trump’s first tariff and trade go-around, the pain came quickly in late 2018 with the Fed needing to come to the rescue in 2019 on weak exports and soft capex. The extent of inflationary creep later in 2025 may curb the Fed’s ability to do the same this time around if payrolls stay firm (see Past-Prologue Perspective for 2025: Memory Lane 2018 6-5-25). The dual mandate still takes priority over political pressure.
As with US IG spreads, we struggle to see the resolution of trade issues without further setbacks. US HY spreads at these levels remain vulnerable to more volatility even if equity markets for now ignore tariffs risks and the inflation threat. We will see if today’s retaliation by Iran was face saving and de-escalatory. Otherwise, more escalation would not serve Iranian (or anyone’s) interests. Trump and Netanyahu are making promises they can keep on disproportionate responses.

The differential between HY OAS and IG OAS (quality spreads) tightened -5 bps this week in line with overall risk. This level remains tight in historical context, but the recent period sees IG and HY sharing a closer relationship given the IG quality shift towards BBB and HY quality skew towards BB. The increase this week leaves this measure well inside the post-COVID median and now in line with the 2014 low of +228 bps. There is still room relative to the frothiest periods of cyclical histories, and the market had cracked the +200 bps line earlier in 2025. The +147 bps in June 2007 in the chart was one for the ages.

The “BB OAS minus BBB OAS” quality spread differential remained flat this week on no BB or BBB spread change. This quality spread measure remains in low territory and hovering near past cyclical lows. This metric has stayed lower in recent history given the convergence in credit quality of the tiers and the core investor base, as the post-COVID history shows. At current levels, we are still two good rally weeks in the BB tier away from record lows in this metric.

The BB tier stayed flat last week at +182 bps, below the 2014 and 2018 cyclical lows and closer to levels seen in May 2007. The combination of low duration and a high-quality diverse mix of BB tier names leads to this being the best performer in credit this year. The tier remains the only one to see tightening YTD, even if only -4 bps. We note that BB credit has the largest concentration of Energy for the HY ratings tiers at just over 13% as the fresh oil price volatility looms.

The B tier tightened -8 bps this week down to +321 bps. The reciprocal tariff whipsaw reminded the market how volatile this layer of credit can be as spreads briefly moved above the long-term median at +486 bps. The relief rally has recovered -165 bps tighter since. The current level harkens back to the 2014 and 2018 spread lows. At only +25 bps wider YTD, the B tier risks appear skewed to widening again with increasing layers of risk in the market. We we see these levels as offering inadequate compensation for the array of trade risks and cyclical pressures still in the market.

The B vs. CCC tier OAS time series is plotted above. The timeline for B and CCC spreads highlights the points of major divergence along the way (see The B vs. CCC Battle: Tough Neighborhood, Rough Players 7-7-24).
The current CCC tier OAS at +914 bps tightened by -13 bps the past week though remained under the long-term median of +953 bps. The CCC YTW is still above 13%, at 13.23% after being above 14% just last month, but the underlying constituents are widely dispersed across an 81.57 composite dollar price. The CCC tier is still in the pricing zone of equity risk-returns with such yields.
CCC investing at this point demands careful capital structure analysis and rigorous issuer-level relative value research with DISH Network a prime example of that recently. The CCC tier now sees much more TMT and Healthcare exposure than in recent cycles.
The tariff wildcards for spread decompression…
The recent volatility was a brief reminder of the kind of B vs. CCC divergence that can happen in a hurry as markets reprice. Further tariff chaos still has the potential to repeat that volatility despite the recent US-China truce and the ability to avoid worsening EU tariffs flashpoints for now.
The US had been getting a taste of what China trade means as shipping and port activity was in semi-collapse and the countdown to empty shelves was highlighted by major retailers. More recently, production chain warnings around rare earths supply needs and magnet shortages were showing alarming threats. Those were highlighted by numerous companies and in the auto trade literature. It was framed as more threatening than the post-COVID semiconductor shortages that reduced auto production by 17 million units from 2021 to 2023 (source: Automotive News).
The rare earths production chain threat helped get a new round of talks underway between the US and China for some more temporary solutions. Trump is big on “who holds what cards” and the US and China both have plenty. The fact that semis are on the Section 232 list will keep a lot of risk in the picture ahead. Pharma and ingredients is another set of face cards that China holds. When Trump rolls out Section 232 for pharma, major problems could unfold with the EU and China.
The potential economic damage that could come in the summer and into the fall is still a gathering storm with the wide array of tariffs in the queue. The scale of the China shutdown was more immediate and far more serious, and you cannot rule out that chaos coming back. We would assess that risk as low but could be more product group specific. A 50% EU tariff could have seen similar dislocation for many industries. At least the more extreme outcomes are lower probability (for now), and those shocks to prices and expense lines are mitigated (but can be revisited in a tit-for-tat retaliation scenario).
Another increase in Section 232 tariffs on Steel and Aluminum raised the bar again for retaliation from major partners, especially EU and Canada (see Tariffs: Testing Trade Partner Mettle 6-3-25). We would argue that there is nothing quite like the China risk that was in evidence before the truce even if China is the #4 trade partner and EU #1. Unlike the EU and its bureaucratic demands, China can respond in force and with immediacy.

The shorter timeline from Jan 2022 just ahead of the end of ZIRP and start of the tightening cycle gives better granularity on the movements from a low for CCCs of +659 bps in Jan 2022 to a peak of +1226 bps in July 2022 and +1289 bps to end Sept 2022. Then spreads came down to the Jan 2025 tights of +690 bps ahead of the recent spike and whipsaw to current levels.
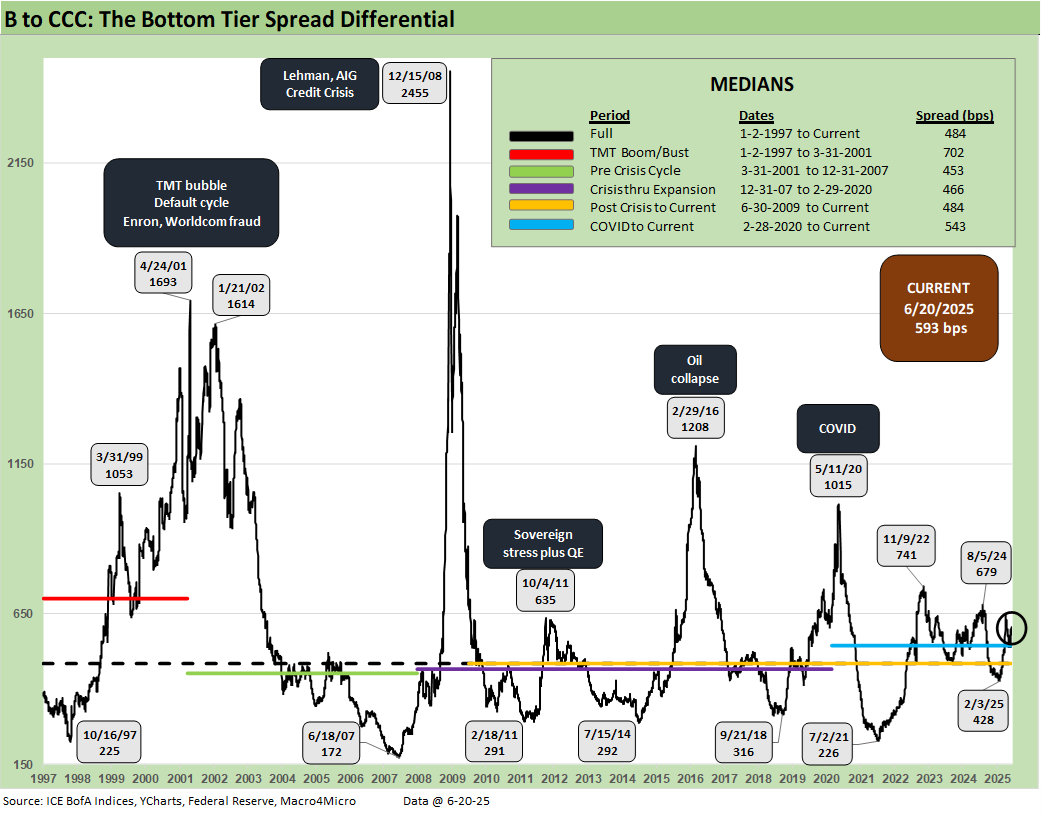
The B vs. CCC tier differential is broken out with the current +593 bps still higher than the long-term median and above the distinct market time horizons with the exception of the TMT HY credit cycle with its +702 bps median. The risks this year have seen CCC tier spreads remaining wider after the earlier whipsaw even as the rest of the tiers have rallied.
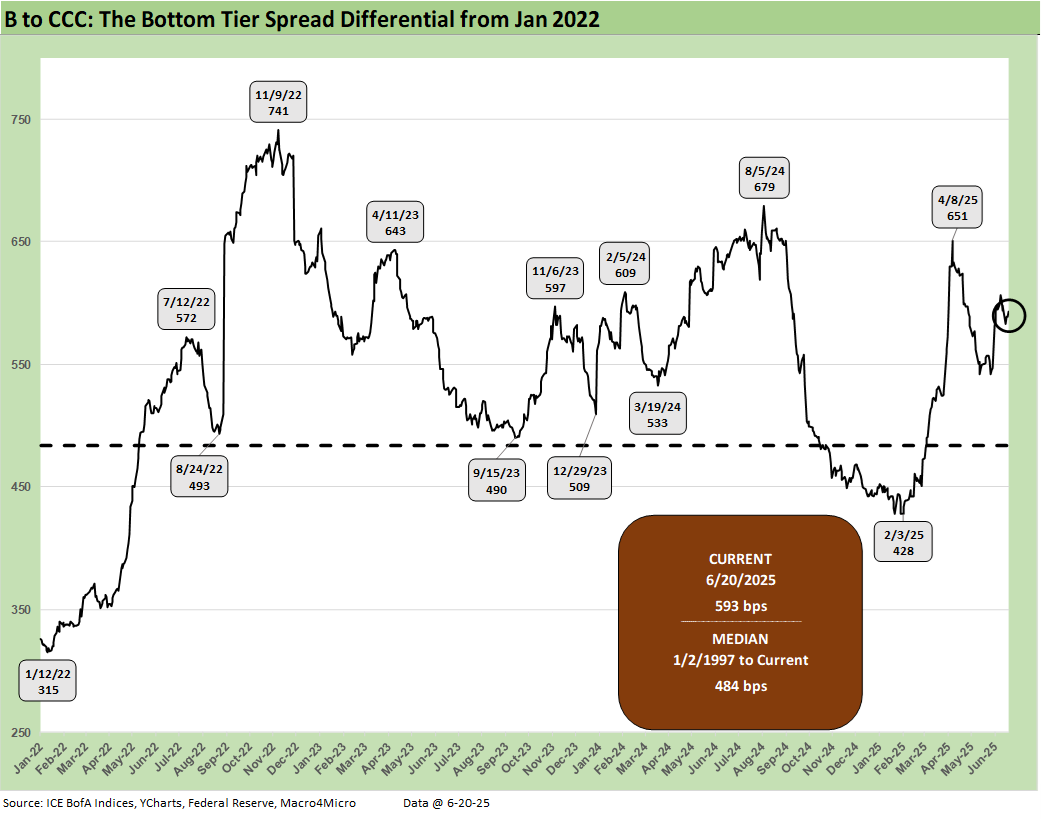
The above chart frames the “B vs. CCC tier” quality spread differential across the short timeline for better granularity. Spreads widened with a vengeance since the low of Feb 2025 at +428 bps even if quality spreads recovered from the early April spike to +651 bps on April 8.
A look at yields…

Moving away from spreads, which are well below long-term medians this week, yields for both IG and HY have a more complex story in historical context given the post-crisis distortions of ZIRP and “normalization.” The normalization period of Dec 2015 to Dec 2018 never really got on track with the economic weakness and Fed easing of 2019 followed by a COVID crisis and return to ZIRP in Mar 2020 (ZIRP ended March 2022).
The current IG YTW at 5.18% (vs. 5.21% last week) decreased as the UST decrease pushed yields lower and remains below the 6.1% pre-ZIRP median on overall YTD UST curve moves.
The HY YTW decreased to 7.33% (from 7.43%) vs. a pre-ZIRP 9.3% median. We consider the pre-ZIRP years the most rational frame of reference in light of the post-crisis ZIRP and QE as well as the COVID Fed reactions.
Spreads will remain a key swing factor for reaching those yield medians of pre-ZIRP years, and we just saw material volatility in credit risk pricing in HY since early April. UST yields are a tougher call with the tariff backdrop that still threatens stagflation as well as the potential for technically driven UST curve shifts on supply-demand fears.
Stagflation risk remains in the debate. Away from stagnation + inflation, old fashioned recession risk would pressure UST rates lower and credit spreads higher, but this is no ordinary cyclical turn. We cover the UST shapeshifting in our separate Footnotes publication on yields as the UST curve lowered this week on the economic data.
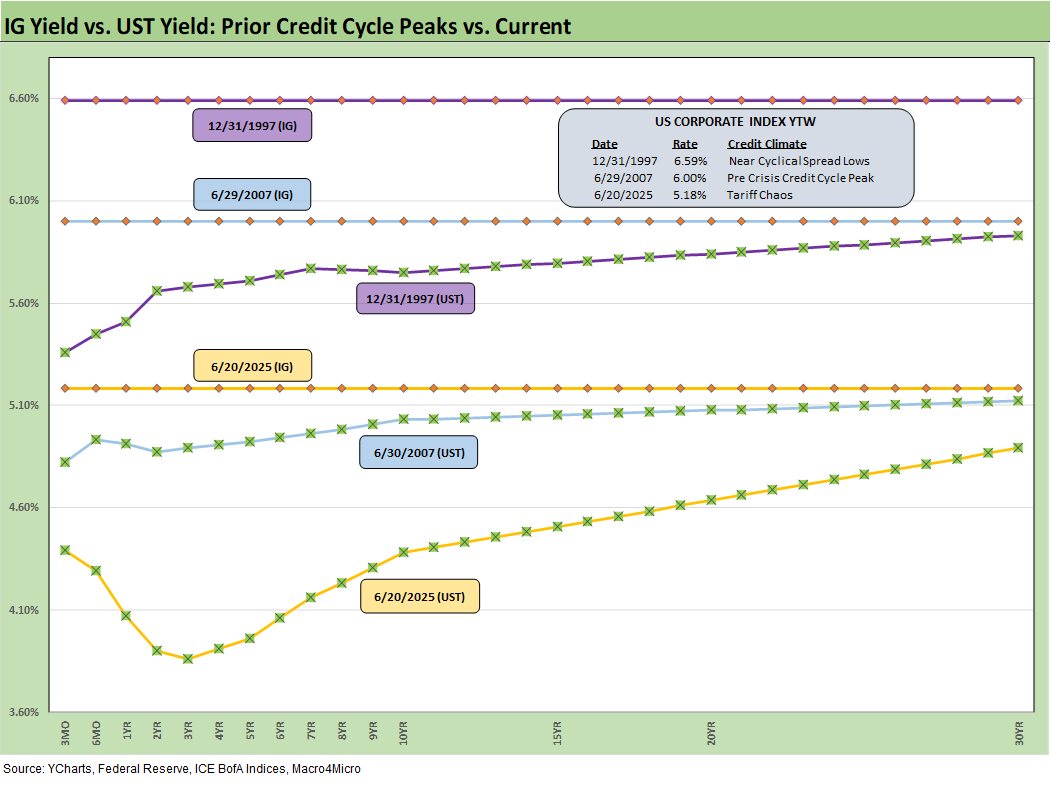
The above frames current IG index yields vs. previous credit peaks along with their respective UST curves. We include both prior credit peaks in June 2007 and Dec 1997 for context as prior peak credit cycles when high risk appetites saw investors chasing yields. Those 1997 and 2000 markets saw poor risk symmetry and low spreads.
Today’s UST curve is still low in those historical credit peak contexts. We saw a recent glimpse of rising long yields along the timeline and the return pain that comes with it. The focus remains on the budget deficit and UST supply as the main driver for risk here as we get clarity on the size of the projected deficit increase and how the debt ceiling will be addressed. Stagflation risks stay in the mix with the current market beyond the credit cycle peak after the tariffs, and long dated yields still could go higher with spreads widening again for another round of return pain.
The short to intermediate IG market is still the safest bond game for now. The funds that are asset class constrained to HY can take refuge in the higher quality layers. Overall corporate default risks in HY bonds remain in check (private credit is its own distinct story and mix).

The final chart does the same 1997 and 2007 drill but for HY index yields. This week’s UST move leaves current HY index yields now below prior peak credit cycles at 7.33% vs. 7.96% in June 2007 and 8.60% in Dec 1997. The recent spread widening had moved HY index yields higher, but the recent reversal and rolling UST moves leave the current HY index YTW below both the 2007 peak and 1997 HY index levels.
The widening early this month gave flashbacks to the volatility and major spread moves of the 1997-98 and 2007-08 periods that also posted triple-digit widening months. The sheer speed of risk repricing that has happened in earlier cycles offers reminders even if those moves were for very different reasons.
Finding the catalyst for downside…
Below we roll forward some updated commentary on the credit cycle…
The challenge is identifying a fundamental transmission mechanism to a default cycle. Identifying a catalyst for pain is more visible now with tariffs hitting the macro drivers (the consumer) and micro drivers (“buyer pays” hits corporate margins with expenses or requires higher prices). This is the essence of the stagflation question not seen since 1980-1982. Economic contraction with higher prices is the worst-case scenario to be avoided.
The recent tariff strategy is both unpredictable and unprecedented in modern capital markets, but at least the banks are much healthier. US-China trade talks calmed some troubling trade nerves and put out a fire, but the most recent Section 232 hike to 50% on steel and aluminum is still a fresh wound. Those are fighting words with key allies (see US Trade in Goods April 2025: Imports Be Damned 6-5-25, Tariffs: Testing Trade Partner Mettle 6-3-25). The next trigger will be when reciprocals get handed down or if discussions with the EU fail. A big risk with the EU would be Section 232 on pharma.
The overall uncertainty in getting trade deals over the line remains a threat. Reciprocal tariffs could end up being “assigned” again rather than negotiated. The clock is ticking. Those reciprocal tariffs will still need their day at SCOTUS based on the IEEPA challenge. SCOTUS continues to drag its feet on the tariff legal challenges.
We also see higher quality levels in the HY bond index as a starting point vs. 2007 and the late 1990s TMT bubble years. The reality is the tariff impacts and supply-side disruptions are only now just beginning in substance. It is hard to reflect forward-looking risks when so few know (including the White House) what those risks will be as “pauses” near the finish line and trade partner conflict could get better or worse. China was a rough lesson for the markets. It also revealed that the White House had a poor grasp on the risks involved.
The EU is on the pause clock that can be terminated or extended with ease. In contrast, Mexico and Canada have outstanding trade war risks (fentanyl, autos, steel, aluminum, lumber on deck, reciprocals, etc.) as the effects of tariffs roll in. Domestic political pressure will rise for leaders to stand up to Trump as the full economic pain is felt by their constituents.
While Trump enjoys playing his hand with pauses as the mood moves him in his own murky game theory plan, corporate investment, big ticket purchase decisions by consumers, and FOMC policy setting can also take a protracted break beyond the tariff pause. The Fed will wait for the data capturing tariff cause-and-effect.
The bad old days…
Looking back even more, the turn in the credit cycle always comes at some point and often with an external trigger or “assist” that can set it off. During 1990, securities firms started to collapse including Drexel’s Chapter 11 in Feb 1990 and bridge loan related bailouts of Shearson Lehman, First Boston, and Kidder Peabody. We do not face that type of financial intermediary meltdown risk here. In a protracted stagflation bout, eyes will return to the regional banks.
The summer of 2007 was the start of major problems in the credit markets with asset risk and leveraged counterparty exposure and bank/broker interconnectedness risk soaring. Despite a backdrop that worsened in August 2007, the equity markets and S&P 500 and NASDAQ kept rallying into Oct 2007. Later in the turmoil and well after the fact, the start of the recession was tagged as Dec 2007 (see Business Cycles: The Recession Dating Game 10-10-22).
The 2007 experience reminded the market that credit leads the cycle and equity lags. The same was true in 1999 with the HY default cycle underway and NASDAQ at +86% that year. This time around, the credit markets did not expect the tariff insanity and is still making up its mind. The real economic effects are more geared to the periods ahead when tariffs will be rolling in at the transaction level. That will be the reality point. We expect HY to stay unhappy with the tariff impact and spreads to average wider as the tariffs roll into actual corporate fundamentals.
There are no frictionless wheels in high tariffs. The buyer pays the tariff at customs (literally “writes the check”). How that gets spread around the economic chain from the seller to buyer to wholesaler and end customer has a lot of moving parts. The “seller pays” and “selling country pays” has been a clear lie from the Trump camp, and he admitted as much when he demanded that Walmart “eat” the tariff cost. Why would there be anything to eat if the seller pays?
Shady and misleading discourse is never new to Washington. Substitute the question “Who writes the check to customs?” for the question “Who pays the tariff?” and it is then easier to corral those who play semantics and tweak key words.
The reality is that Trump never “collected hundreds of billions” from selling countries. That is pure falsehood.
Trump recently highlighted yet again the hundreds of billions he collected from selling countries. He even cited “$600 billion” in one recent live interview. We cannot tell what Trump remembers as a fact and what he made up.
Until the tariff deals are put to bed, outsized “surprise risk” in tariffs remains high on the worry list. And even then, since Trump breached the USMCA, any Trump deal should be viewed with skepticism, especially with Congress allowing him to declare an emergency at will. SCOTUS will need to decide at some point, but they keep delaying the case.
See also:
Footnotes & Flashbacks: State of Yields 6-22-2025
Footnotes & Flashbacks: Asset Returns 6-22-2025
Mini Market Lookback: FOMC Spoke Clearly, Iran and Trump up next 6-21-25
Lennar 2Q25: Bellwether Blues 6-20-25
FOMC Day: PCE Outlook Negative, GDP Expectations Grim 6-18-25
Home Starts May 2025: The Fade Continues 6-18-25
May 2025 Industrial Production: Motor Vehicle Cushion? 6-17-25
Retail Sales May 25: Demand Sugar Crash 6-17-25
Footnotes & Flashbacks: Credit Markets 6-16-25
Footnotes & Flashbacks: State of Yields 6-15-25
Footnotes & Flashbacks: Asset Returns 6-15-25
Mini Market Lookback: Deus Vult or Deus Nobis Auxilium 6-14-25
Credit Snapshot: Hertz Global Holdings 6-12-23
CPI May 2025: The Slow Tariff Policy Grind 6-11-25
Mini Market Lookback: Clash of the Titans 6-7-25
Payrolls May 2025: Into the Weeds 6-6-25
Employment May 2025: We’re Not There Yet 6-6-25
US Trade in Goods April 2025: Imports Be Damned 6-5-25
Past-Prologue Perspective for 2025: Memory Lane 2018 6-5-25
JOLTS April 2025: Slow Burn or Steady State? 6-3-25
Tariffs: Testing Trade Partner Mettle 6-3-25
Mini Market Lookback: Out of Tacos, Tariff Man Returns 5-31-25
PCE April 2025: Personal Income and Outlays 5-30-25
Credit Snapshot: Meritage Homes (MTH) 5-30-24
1Q25 GDP 2nd Estimate: Tariff and Courthouse Waiting Game 5-29-25
Homebuilder Rankings: Volumes, Market Caps, ASPs 5-28-25
Durable Goods Apr25: Hitting an Air Pocket 5-27-25
Mini Market Lookback: Tariff Excess N+1 5-24-25
New Home Sales April 2025: Waiting Game Does Not Help 5-23-25
Existing Home Sales April 2025: Soft but Steady 5-22-25
Credit Snapshot: Lithia Motors (LAD) 5-20-25
Credit Spreads: The Bounce is Back 5-13-25