
Footnotes & Flashbacks: Asset Returns 6-22-2025
Equity benchmarks had a rough 1-month even after a reasonable week while debt benchmarks are modestly positive for 1M, 3M, and 6M.


A new first, but now the question is “What comes next?”
The newest Middle East war could be upon us, or we are just seeing a fine tuning of the war on terror and relief of the nuke weapon risk. The upside surprise risk (more a shock and Santa Claus sighting) would be a full deal to disarm the nuke program in exchange for oil supply relief and lifting sanctions.
The risks run the full gamut from temporary (Strait of Hormuz) to escalatory (attacks on regional US assets and outsized US retaliation) to protracted anxiety over asymmetric risk and terrorism across proxies (the car bomb and vest crowd). We check off a few risk factors below.
The past week return mix became ancient history when the bombs dropped but now it is time to turn back to a massive queue of Section 232 tariffs, the clock ticking on reciprocal deals, the slow roll of current tariffs into the working capital cycle, and the return to the immigration controversies as Trump and Miller move on to Chicago and NYC for the next round of toxic politics.
This week we get Existing Homes Sales, Consumer Confidence, New Home Sales, the final numbers for 1Q25 GDP, and PCE numbers for May.

The above table updates the high-level equity and debt benchmarks we look at every week. We cover the broader multi-horizon return story in more detail further below. We discussed the main trends already in Mini Market Lookback: FOMC Spoke Clearly, Iran and Trump up next (6-21-25).
The general takeaway from the above is debt has been muddling along in positive range for the 1-month and 3-months period in all the volatility. As we detail further below, all 7 bond ETFs in our peer group of 32 benchmarks and ETFs were positive YTD. Meanwhile, equities have struggled the past month but with growth stocks making a healthy rebound over 3 months. The result still show 6-month returns on the grim side. Budget deficits, uncertainties around tariffs, and recent Middle East stress all have weighed although the weekend headlines just took geopolitics up more than a few notches.
Iran joins tariffs on the high priority short list ahead of earnings season…
The world keeps turning, but the stakes of warfare again have the word “nukes” in the title. The first US bombing of a nuclear site is now checked off the bucket list. Up to now, the concept of conflict between Israel and Iran with a possible US bombing had left the asset markets remarkably calm this past week. Now that it has happened, we get the next round of testing how a limited war with Iran could shape sentiment for those putting forward risk premiums on assets across equities, credit spreads, the UST, the dollar, gold, crypto, etc. We will get a fresh gut check this week now that a broader war could be underway and the handicapping of Iranian responses heats up.
Last week is old news as we add Iran to short list behind tariffs…
The past week was constructive in equities and the UST curve rallied (see Mini Market Lookback: FOMC Spoke Clearly, Iran and Trump up next 6-21-25). We look at those comparisons across the benchmarks and ETFs further below, but we thought we should lead with some of the anxiety checklists that might be making the rounds this week in internal conversations about how to frame the post-Bunker Buster risks. Iran is in the top 20 nations in population and has a fanatical hatred of Israel and the US. We just bombed their stealth nuclear weapons programs. They are allied with China and Russia. That is a new one.
Iran retaliation: under the heading of “most glaringly obvious variable” is what Iran does in response to the bombing. Will they fire missiles at regional US bases or stay focused on Israel. Trump made it clear that any retaliation would be met with a disproportionate response. They now know that Trump broke the seal by challenging the MAGA base anxiety on war in the Middle East, so he has the “in for a dime, in for a dollar” dilemma if Iran gets aggressive. There’s no turning back now.
Oil: the recurring worry is threatening the passage of oil through the Strait of Hormuz. Iran has already stated they plan to shut it down. We will see how that plays out. The oil price shock would be a negative with the usual multiplier effects along the corporate sector and households. That said, the effect would not be new given the oil prices seen before the oil price crash of late 2014. E&P investment in North America would pick up, and there would be an interesting dynamic for Team Trump to consider alternatives for Russia supply. Will Russian oil get freed up?
In other words, there would be cost pain and inflation threats to evaluate in US economic context, but the oil shock of today is not like the oil shocks of late 1973/1974 or 1979-to-1981 or the brief 1990 spike. It is a very different world today with US and longer term Canadian production potential.
Aggressive Iran response against US military assets in the Middle East: This is where the US retaliates on a major scale and then markets start reminding themselves how expensive Middle East military action can be. After the post-2001 actions that started under Bush and lasted two decades, the problem was “budget busters.” Heavier military outlays in 2025-2026 would start the game clock on UST supply fears and how to pay for more military outlays. The budget does not need another trillion dollar invoice. The GOP might even have to think about income taxes and corporate taxes and a revenue line (oil taxes anyone?).
The terrorism and asymmetric risk factors: Iran and its proxies are big on the bomb vest crowd (as long as the leaders don’t have to wear them). Heightened security and budget needs are hopefully considered for both red and blue states. These days, that is hardly assured as security details were pulled by Trump on his adversaries or former allies who offended him. As someone who lived across the street from the World Trade Center on 9/11, the sensitivity to terrorism can affect consumer habits and risk aversion can flow into some industries more than others (notably travel and leisure). The world is heartier now than it was in such years as late 1990/early 1991 when air travel tanked with the Gulf War and iconic airlines such as Pan Am and Eastern Airlines filed Chapter 11 or liquidated – or both.
In the end, the mentality of the US on Middle East wars has changed so dramatically since 1990 when harsh language was enough to send oil $10 higher. Iran is a new milestone for sure. It ranks in the Top 20 countries in the world in population and has a very high threat factor given the radicalism in place since the Shah fled in early 1979 and the “Iranian Hostage Crisis” made Ted Koppel a rockstar. Iran’s recurring death chants calling for the destruction of Israel and the “Great Satan” is hard to ignore. Those two enemies of Iran have just demonstrated some serious skill sets in warfare and a willingness to do it on a larger scale, so there is a peace to be had for the people of Iran if the extremists avoid an excessive response.
The missing pieces and what has not been found: The experts were all over the media today discussing how nuclear material has been moved around in expectation of this event and there could be more sites yet undiscovered. The expectation is most investors will bet on Mossad. If that unfolds or is discovered, many will assume there will be more bombing and that works for no one.
We see mild weakness in the pre-market as we go to print. The UST flight to quality factor will be interesting to watch and frame in coming days how that might dovetail with inflation fears and UST supply jitters as the debt ceiling debate gets into the home stretch.
The rolling return visual
In the next section, we get into the details of the 32 ETFs and benchmarks for a mix of trailing periods. Below we offer a condensed 4-chart view for an easy visual on how the mix of positive vs. negative returns shape up. This is a useful exercise we do each week looking for signals across industry groups and asset classes.
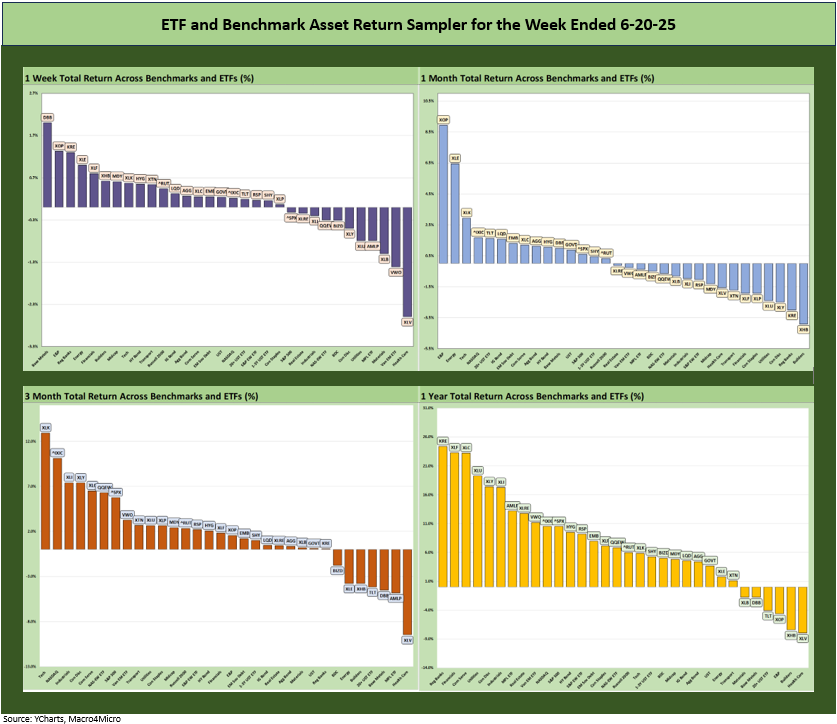
The symmetry in the above charts is visually reassuring when viewed in the context of the sensory overload of tariffs and Middle East threats. The latter just notched up exponentially with the bombing.
The next few weeks will bring the Iranian reaction question to a head, but the more immediate issues will be the rolling working capital effects of current tariffs, some potential resolution on the reciprocals, and the next wave of Section 232 tariffs (pharma, semis, aircraft/parts, copper, and lumber). The intrinsic risks of trade partner retaliation run alongside these tariff decisions.
The LA experience and mobilization of the National Guard and Marines will also be coming to a “blue city near you” and that will raise political toxicity to the highest level since 1860. That by itself is a busy dance card (as in slam dancing). We assume a budget and tax bill will be done soon, but that is not assured.
The Magnificent 7 heavy ETFs…
Some of the benchmarks and industry ETFs we include have issuer concentration elements that leave them wagged by a few names. When looking across some of the bellwether industry and subsector ETFs in the rankings, it is good to keep in mind which narrow ETFs (vs. broad market benchmarks) get wagged more by the “Magnificent 7” including Consumer Discretionary (XLY) with Amazon and Tesla, Tech (XLK) with Microsoft, Apple, and NVIDIA, and Communications Services (XLC) with Alphabet and Meta.
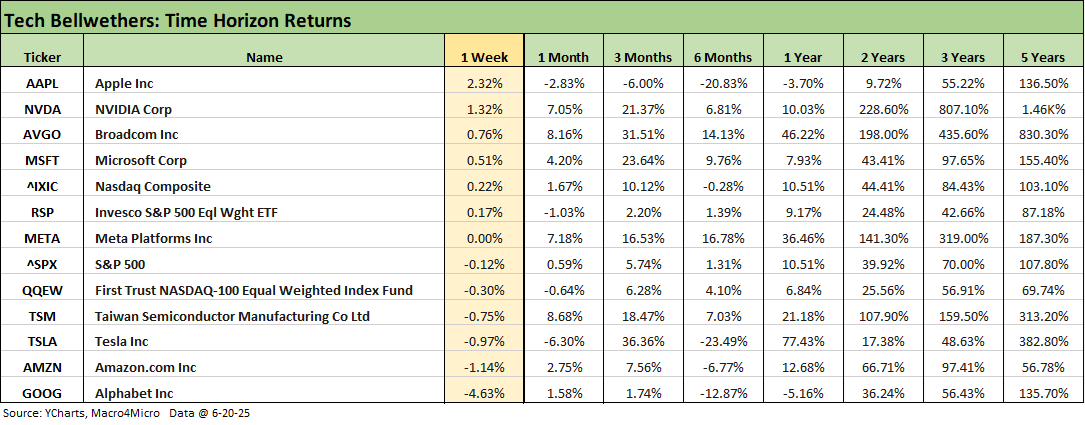
We looked at the tech bellwethers in Mini Market Lookback: FOMC Spoke Clearly, Iran and Trump up next (6-21-25). We see the volatility of this recent market backdrop in the mixed 1-month, favorable 3-months, and fairly ugly 6-months. That is coming off the bullish 2023-2024 that saw the best back-to-back markets since the late 1990s.

We looked at the 1-week lineup above in Mini Market Lookback: FOMC Spoke Clearly, Iran and Trump up next (6-21-25). The 21-11 score for the week saw all bond ETFs positive. Energy ETFs (XOP, XLE) and financials (KRE, XLF) and Base Metals ETF (DBB) took the Top 5 spots. Health Care (XLV) continues to be abused by the mix of risk factors. Health Care (XLV) was in dead last for the week and for the rolling 3 months and 1-year time horizon while also in the bottom quartile for 1-month and YTD.

The 1-month timeline was more balanced but slightly negative at 15-17. Equities took the market swings harder than bonds with 3 bond ETFs in the top quartile including the long duration UST ETF (TLT) and IG Corporates (LQD) and EM Sovereigns (EMB). The other 4 bond ETFs were in the second quartile. We see the Homebuilder ETF (XHB) sitting on the bottom after a string of weak-ish housing indicators (see Home Starts May 2025: The Fade Continues 6-18-25) and poor earnings report this past week and soft guidance from Lennar. LEN is a good bellwether as one of the Big 2 builders alongside D.R. Horton (see Lennar 2Q25: Bellwether Blues 6-20-25).

The 3-months return tally started shortly before Liberation Day and posted up a 25-7 score as the smoke cleared on the tariff panic and China battles of April. We see a tech comeback with the Tech ETF (XLK) at #1 just ahead of NASDAQ at #2, Consumer Discretionary (XLY) at #4 with a rebound from Tesla and rally from Amazon. The top quartile also included Communications Services (XLC) and the Equal Weight NASDAQ 100 (QQEW) and the Mag 7 heavy S&P 500. Industrials (XLI) posted a solid #3 in the top tier.
The UST steepener on the long end took its toll on the long duration 20+Y UST ETF (TLT) as that bond ranked in the bottom quartile with Homebuilders (XHB). All other bond ETFs were positive. Health Care (XLV) again sits on the bottom of the return ranking at a -9.5% return. Health Care will be in for more excitement ahead this summer when the pharma Section 232 process could be underway.

The YTD return score came in at 24-8 this past week with all bond ETFs positive and a well-diversified top quartile led by EM Equities (VWO), Industrials (XLI), Utilities (XLU), Communications Services (XLC), the Equal Weight NASDAQ 100 (QQEW) in the top 5. Rounding out the top quartile was the high-income Midstream ETF (AMLP), EM Sovereign Debt (EMB), and Energy ETF (XLE).
The Hi-Low range for YTD returns was almost 20 points, so there were plenty of selection opportunities to win and lose. The median return in the mix of 32 asset lines was around 2.7%, and that is an unimpressive period coming off two banner years.
The low-end YTD saw the weakest performance from Transports (XTN) with all the trade volume disarray as well as airlines tailing off after two very strong travel seasons in 2023 and 2024. We also see interest rate sensitive sectors such as Homebuilders (XHB) take a beating after a stretch where XHB had been near the best performing sector for the LTM period ending 3Q24. The small cap Russell 2000 (RUT) and Midcaps (MDY) were negative and in the bottom quartile with Regional Banks (KRE), so that is showing some US-centric cyclical jitters.
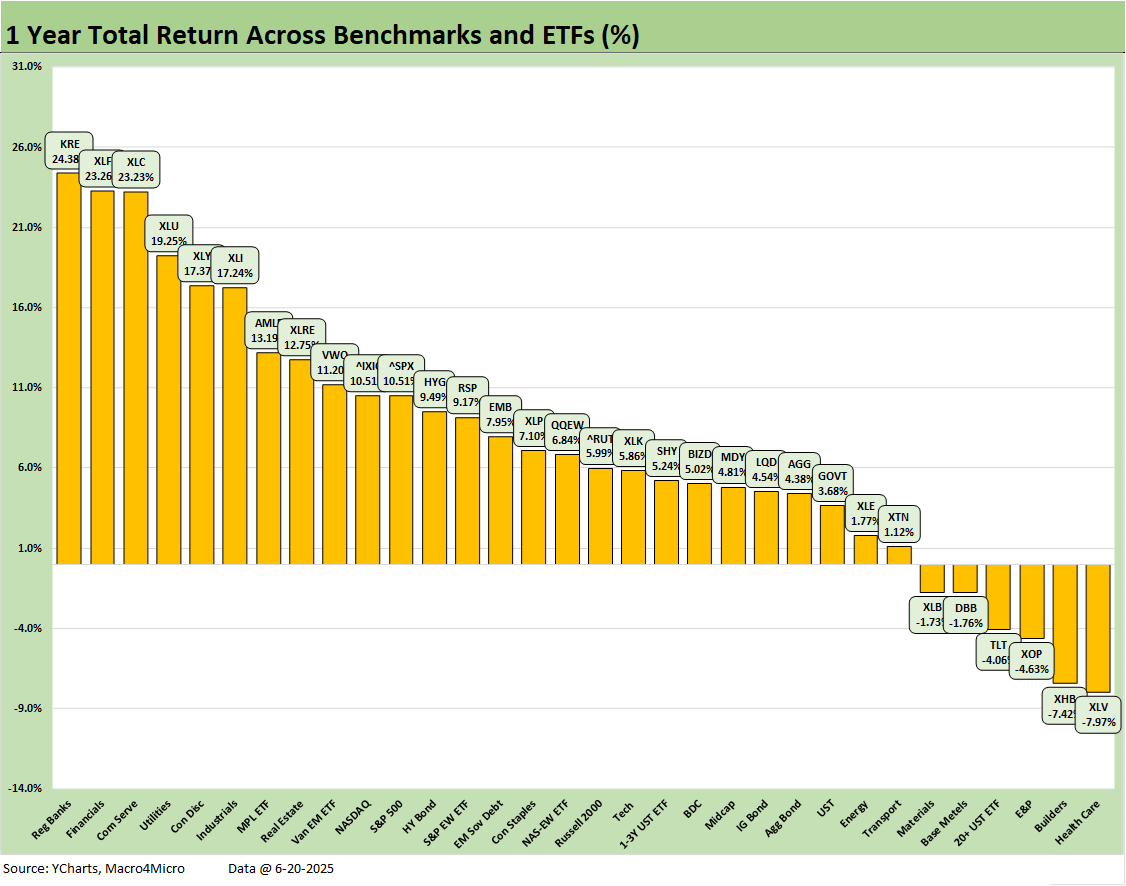
The 26-6 score for trailing 1 year is hanging in well enough after so much strength in FY 2024. The fact that the long duration UST 20+Y ETF (TLT) is negative underscores the UST steepener challenge since the Sept 2024 lows but with all other bond ETFs in positive range. Health Care (XLV) setbacks are clear enough again at almost -8% in last place vs. +24.6% for Regional Banks (KRE) at #1.
The median of around +6.4% is not impressive vs. the FY 2024 performance median of around 10% (see Footnotes & Flashbacks: Asset Returns for 2024 1-2-25). FY 2024 also saw +25% for the S&P 500 vs. the current LTM run rate above of only 10.5%. The YTD return in 2025 of +2.1% cut the broad market benchmark down to size for the LTM period.
See also:
Mini Market Lookback: FOMC Spoke Clearly, Iran and Trump up next 6-21-25
Lennar 2Q25: Bellwether Blues 6-20-25
FOMC Day: PCE Outlook Negative, GDP Expectations Grim 6-18-25
Home Starts May 2025: The Fade Continues 6-18-25
May 2025 Industrial Production: Motor Vehicle Cushion? 6-17-25
Retail Sales May 25: Demand Sugar Crash 6-17-25
Footnotes & Flashbacks: Credit Markets 6-16-25
Footnotes & Flashbacks: State of Yields 6-15-25
Footnotes & Flashbacks: Asset Returns 6-15-25
Mini Market Lookback: Deus Vult or Deus Nobis Auxilium 6-14-25
Credit Snapshot: Hertz Global Holdings 6-12-23
CPI May 2025: The Slow Tariff Policy Grind 6-11-25
Mini Market Lookback: Clash of the Titans 6-7-25
Payrolls May 2025: Into the Weeds 6-6-25
Employment May 2025: We’re Not There Yet 6-6-25
US Trade in Goods April 2025: Imports Be Damned 6-5-25
Past-Prologue Perspective for 2025: Memory Lane 2018 6-5-25
JOLTS April 2025: Slow Burn or Steady State? 6-3-25
Tariffs: Testing Trade Partner Mettle 6-3-25
Mini Market Lookback: Out of Tacos, Tariff Man Returns 5-31-25
PCE April 2025: Personal Income and Outlays 5-30-25
Credit Snapshot: Meritage Homes (MTH) 5-30-24
1Q25 GDP 2nd Estimate: Tariff and Courthouse Waiting Game 5-29-25
Homebuilder Rankings: Volumes, Market Caps, ASPs 5-28-25
Durable Goods Apr25: Hitting an Air Pocket 5-27-25
Mini Market Lookback: Tariff Excess N+1 5-24-25
New Home Sales April 2025: Waiting Game Does Not Help 5-23-25
Existing Home Sales April 2025: Soft but Steady 5-22-25
Credit Snapshot: Lithia Motors (LAD) 5-20-25