
JOLTS April 2025: Slow Burn or Steady State?
We look at April JOLTS with its 1-month lag as Openings rose, Hires rose, Layoffs/Discharges rose, and Quits declined.


Sometimes the late innings can get scary.
The critical court decisions and closing some key trade deals in tariffs are keeping the crowd on edge as we enter the late innings. To beat the metaphor senseless, the late stage of any game can bring surprises, rain delays, and even the occasional bench-clearing brawl.
We see very little in the monthly headline numbers and JOLTS data that show preemptive cost cutting nerves or signals of defensiveness in the aggregate jobs numbers. Employers remain relatively unflappable to this point in terms of hiring and firing decisions and framing openings.
Whether it is a “call me when you get there” mentality around the tariff transaction impacts and resultant flow-through effects or because pricing power cures a lot of ills, the industry jobs deltas in April are not seeing the aggregate needle move much on tariff and cyclical anxiety. May payroll comes Friday.
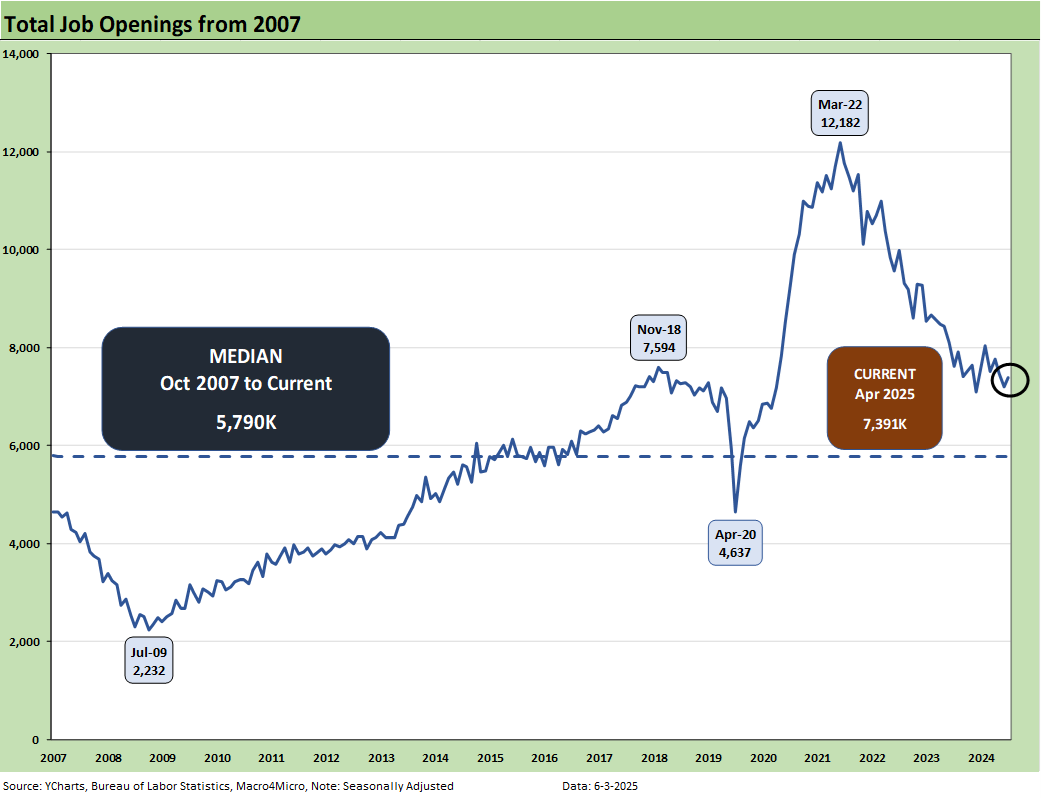
JOLTS is at a 1-month lag, so we still look to this Friday’s payroll release for a more timely read. We see the number for Job Openings holding in well enough for April data at 7.4 million, which in turn marks an uptick of 191K. That 7.4 million is down YoY from 7.6 million. That current 7.4 mn is not that far from the peak number of 7.6 mn during Trump 1.0 but well off the 12.2 million peak opening of March 2022 as detailed in the chart above. Many of those peak openings in 2022 have been filled along the way as we detail in the monthly payroll commentaries.
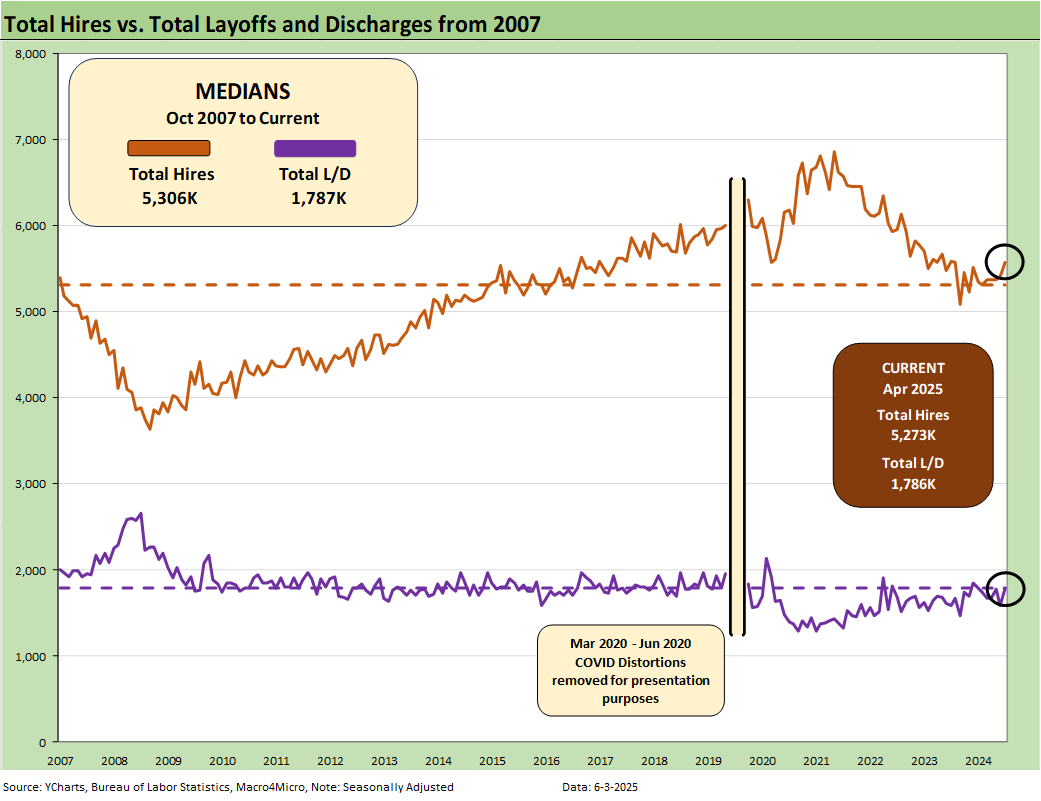
The above chart plots Hires vs. Layoff/Discharges on a SAAR basis. We remove the COVID numbers from this chart to support the visual value for “normal” periods. Those COVID impacts are detailed further below. Hires were up sequentially by 169K and essentially flat (down very slightly) YoY. Layoffs/Discharges were higher by 196K MoM and higher by 199K YoY, so that is a mixed result overall for “hires vs. fires.” These days – and given the tariff headlines – the absence of major reductions in openings and signs of balanced hires and layoffs/discharges constitute constructive news.
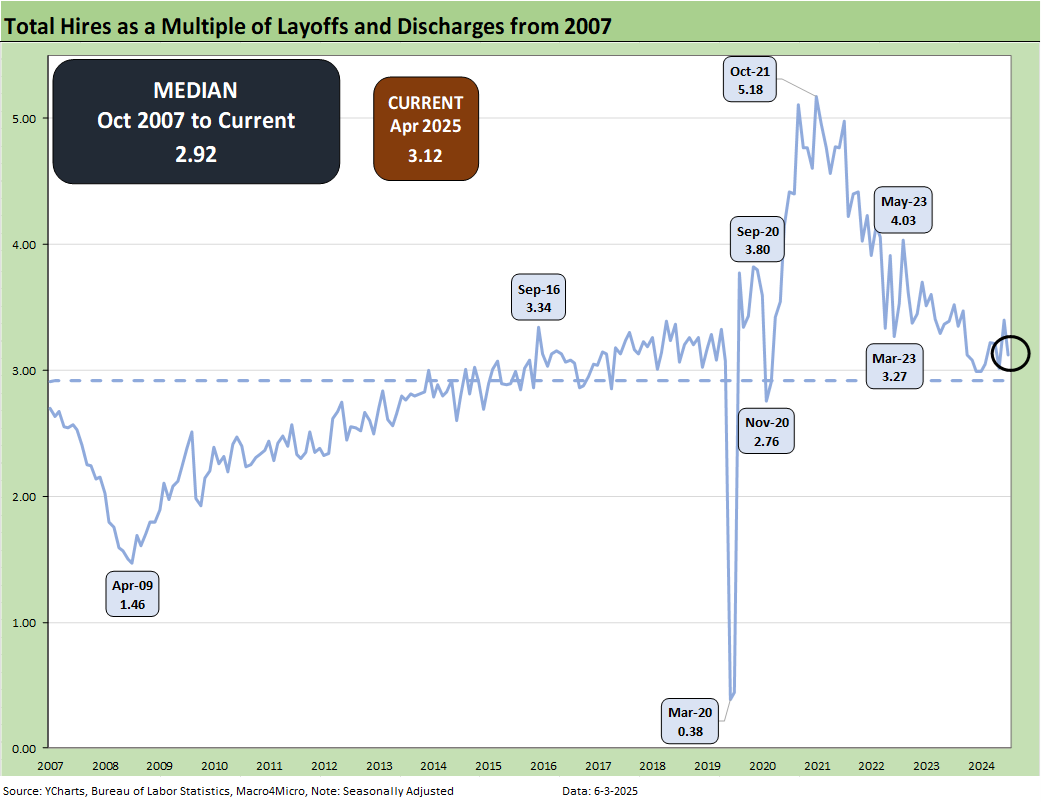
The above chart updates the ratio of Hires to Layoffs/Discharges. The relationship moved lower this month to 3.12 from 3.47 in March and is above the long-term median presented from 2007. That post-2007 period includes the longest recession since the Great Depression and the COVID pandemic.
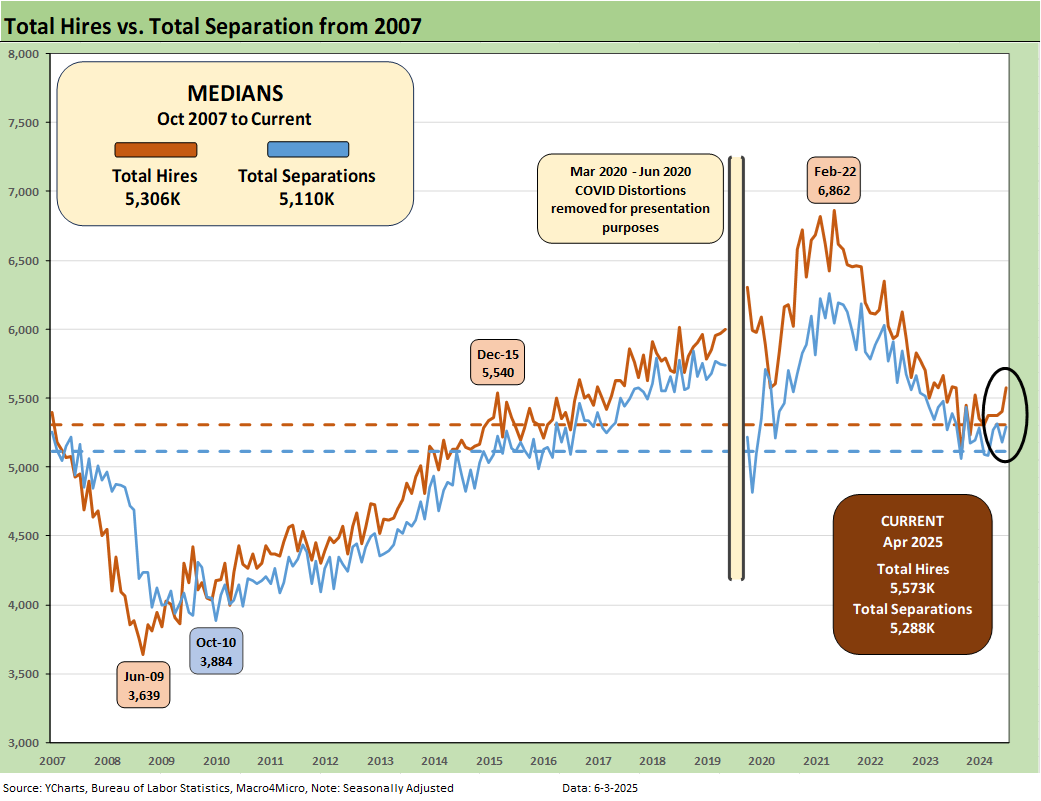
The above charts plots Hires vs. Total Separations on a SAAR basis. Separations include Quits, Layoffs/Discharges, and “Other Separations.” We remove the COVID numbers from this chart to support the visual value for “normal” periods. Those COVID impacts are detailed further below. Separations in total were higher by 105K sequentially, which was high relative to last month’s decrease. Separations were down by -100K YoY.
We typically do not find “Total Separations” very interesting as a multi-line net number. The most important moving parts are Hires and Layoffs/Discharges. “Other Separations” could get more interesting in a world of mass deportation when people get “disappeared.” Did they “quit” by not showing up for work or did they get “othered.” For April, “other separations” are not telling much of a story but moved higher by 60K to 308K.
There is also the uncertainty of how the de facto labor force gets measured and how many are “off the books.” As the year goes on, those questions could be more important. “Other Separations” were up by 60K in April after declining in March. April 2024’s total “Other Separations” of 386K in total or 78K higher than April 2025.
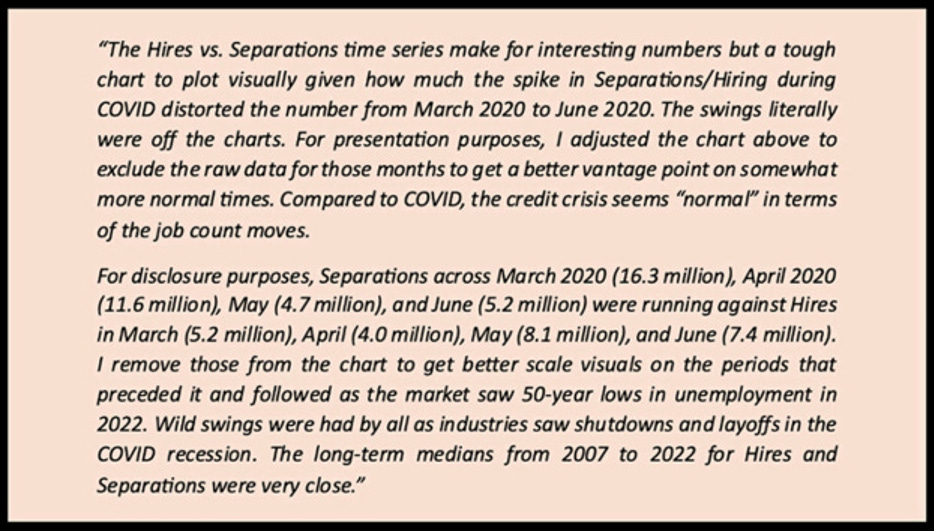
The above text box is our recurring recap of the COVID period. Almost 28 million Separations combined in March-April 2020 was a brutal reminder of that period. That hopefully will be the last time we ever see that. With RFK at the helm, you can never say never.
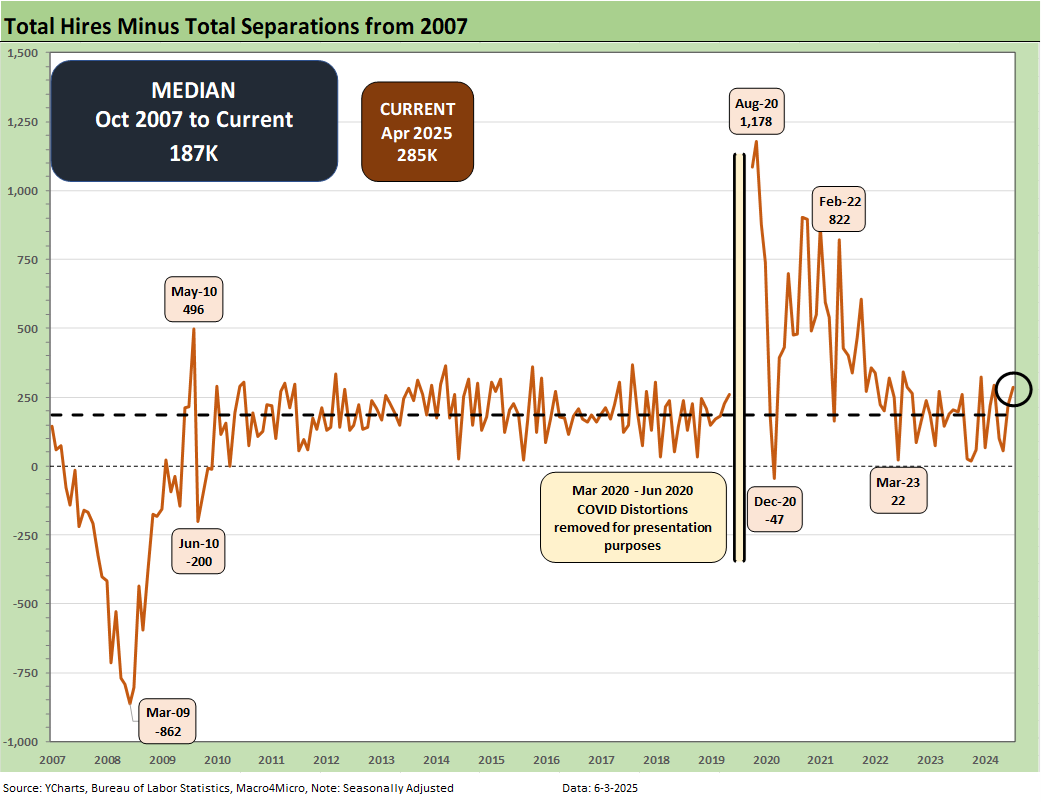
The Hires minus Total Separations differential is plotted above. Hires moved higher and total Separations moved higher. The net number moved higher sequentially MoM to +285K and remains well above the long-term median of +187K.
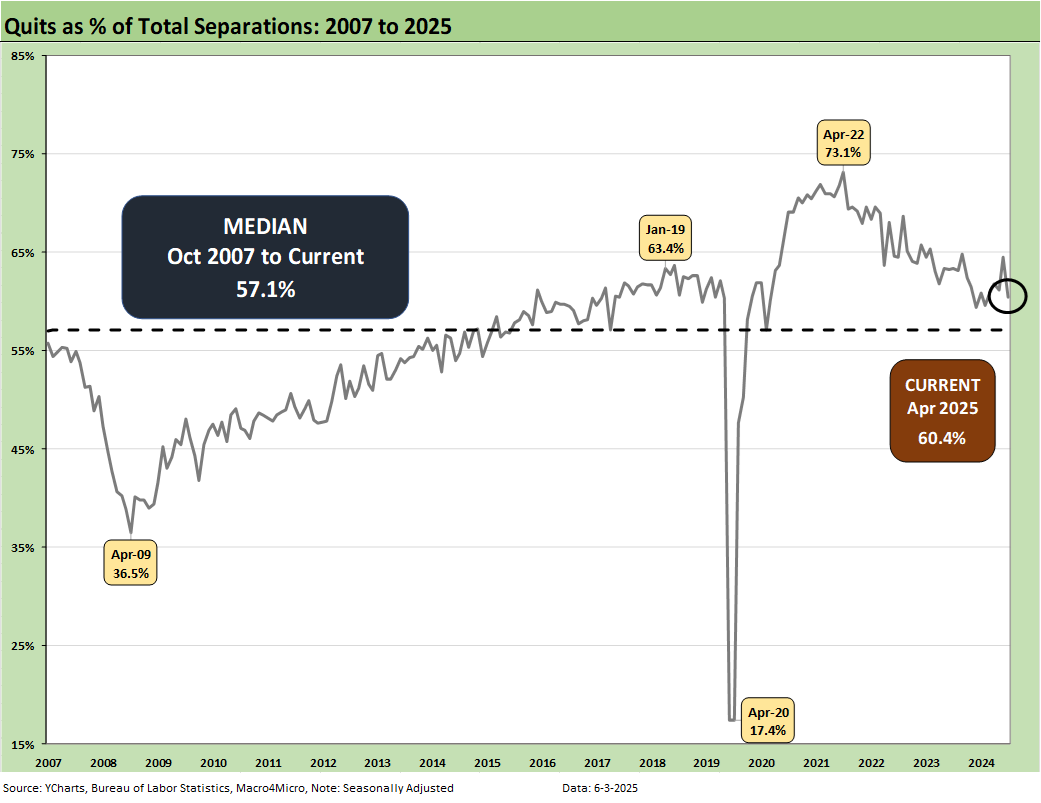
The time series for Total Quits as a % of Separations (SAAR basis) moved lower MoM to 60.4% from 64.9% and is well above the long-term median of 57.1%. The classic “Quits Rate” is measured by Total Quits as a % Total Employment, and that metric ticked lower on the month to 2.0% from 2.1% in March. The Quits rate is down to 2.0% YoY from +2.2%.
See also:
Tariffs: Testing Trade Partner Mettle 6-3-25
Footnotes & Flashbacks: Credit Markets 6-2-25
Footnotes & Flashbacks: State of Yields 6-1-25
Footnotes & Flashbacks: Asset Returns 6-1-25
Mini Market Lookback: Out of Tacos, Tariff Man Returns 5-31-25
PCE April 2025: Personal Income and Outlays 5-30-25
Credit Snapshot: Meritage Homes (MTH) 5-30-24
1Q25 GDP 2nd Estimate: Tariff and Courthouse Waiting Game 5-29-25
Homebuilder Rankings: Volumes, Market Caps, ASPs 5-28-25
Durable Goods Apr25: Hitting an Air Pocket 5-27-25
Mini Market Lookback: Tariff Excess N+1 5-24-25
New Home Sales April 2025: Waiting Game Does Not Help 5-23-25
Existing Home Sales April 2025: Soft but Steady 5-22-25
Credit Snapshot: Lithia Motors (LAD) 5-20-25
Home Starts April 2025: Metrics Show Wear and Tear 5-19-25
Industrial Production April 2025: CapUte Mixed but Time Will Tell 5-15-25