
Employment May 2025: We’re Not There Yet
May payroll numbers were mixed but reflect patience by employers avoiding preemptive moves with variables still up in the air.


We are getting closer to more layoffs and cost cutting. Be patient.
The 139K in payroll adds from the Establishment Survey surpassed more bearish worries, but the downward revisions included March at -65K (185K to 120K) and April at -30K (177K to 147K).
That level of job adds still leaves the market in a wait-and-see mode around FOMC reactions since it does not sway the dual mandate focus from the inflation threat to full employment pressure. The FOMC data waiting game is linked to eventual tariff schedules and working capital management cycles (inventory liquidation and restocking, contracts, etc.), a major pipeline of Section 232 tariffs in the queue (notably pharma, semis, aircraft/parts, lumber, copper), and an inevitable date with SCOTUS on reciprocal tariffs and IEEPA authority.
The tariffs in process are before considering potential retaliation risks, which will remain high over the near term and also ties into the final reciprocal outcomes. That is when supply-demand imbalances rise with effects beyond the tariff costs (where the importer/buyer “writes the check”).
At sea level, the flat 4.2% unemployment rates from the Household Survey comes after a +71K increase in the unemployed ranks to 7.24 million set against a -625K decline in the civilian labor force to 170.5 million (participation rate .2% lower to 62.4%). Total employed in the labor force declined by -696K to 163.3 million. A smaller labor force and lower number of bodies employed offers little to cheer even at a flat 4.2%.
The occupational line items in the Establishment Data posted the +139K, but Manufacturing was lower, Construction was flat, and notably Retail declined modestly in the face of tariff fears. We will be out with the occupational breakdown in Part 2 of our monthly payroll commentary later today. Once again, Health Care and Social Assistance (+78K) and Leisure and Hospitality (+48K, with 30K of that in Food Services and Drinking Places) did the heavy lifting.
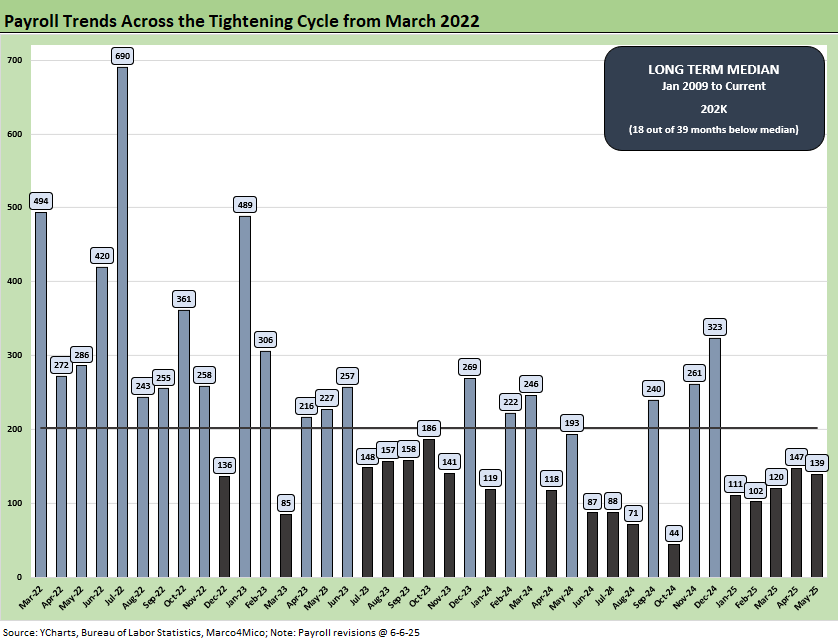
The above chart updates the monthly payroll adds since March 2022 when the tightening cycle started. The 139K is well below the long-term median from Jan 2009 (202K) and leaves a lot of room for interpretation relative to lower expectations. Those optimists hoping for major tariff retrenchment as the pauses and court activity ends are likely to be disappointed. There are no signs of Trump backing off yet and in fact he has many high tariffs coming in the Section 232 pipeline as noted in the bullets above. If he wins his eventual IEEPA case at SCOTUS, there will that much more flexibility to pile on.
We see a mediocre YTD 2025 for payroll adds in the chart above but still solid relative to the fears. All months have been positive in adds. That had followed a weak summer of 2024 that gave the Fed an excuse to ease (even if it eased too much) in Sept 2024 that sent the UST curve and mortgage rates to brief lows (see Footnotes & Flashbacks: State of Yields 6-1-25 ). The payroll adds exceed what most would see as more than keeping up with demographic needs.
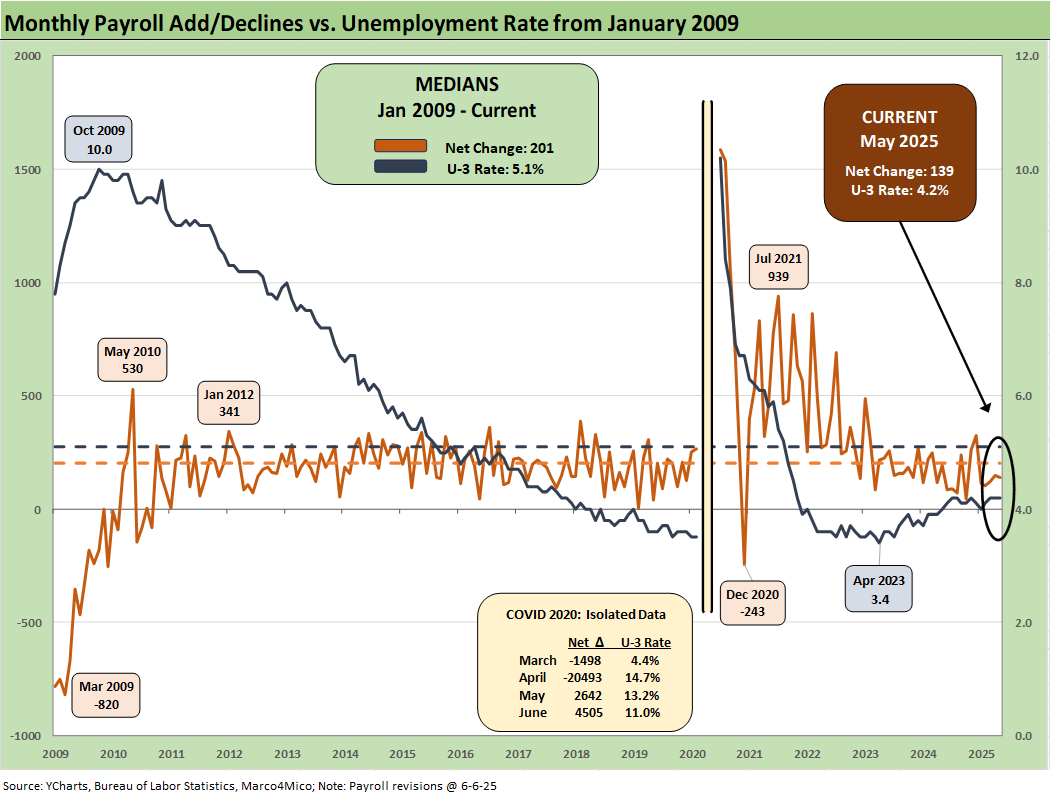
The above chart plots the running job adds/decline since Jan 2009 against the unemployment rate, which was flat at 4.2% MoM for the third straight month. We isolate the worst months of the COVID dislocations in the box for better visuals in the other periods.
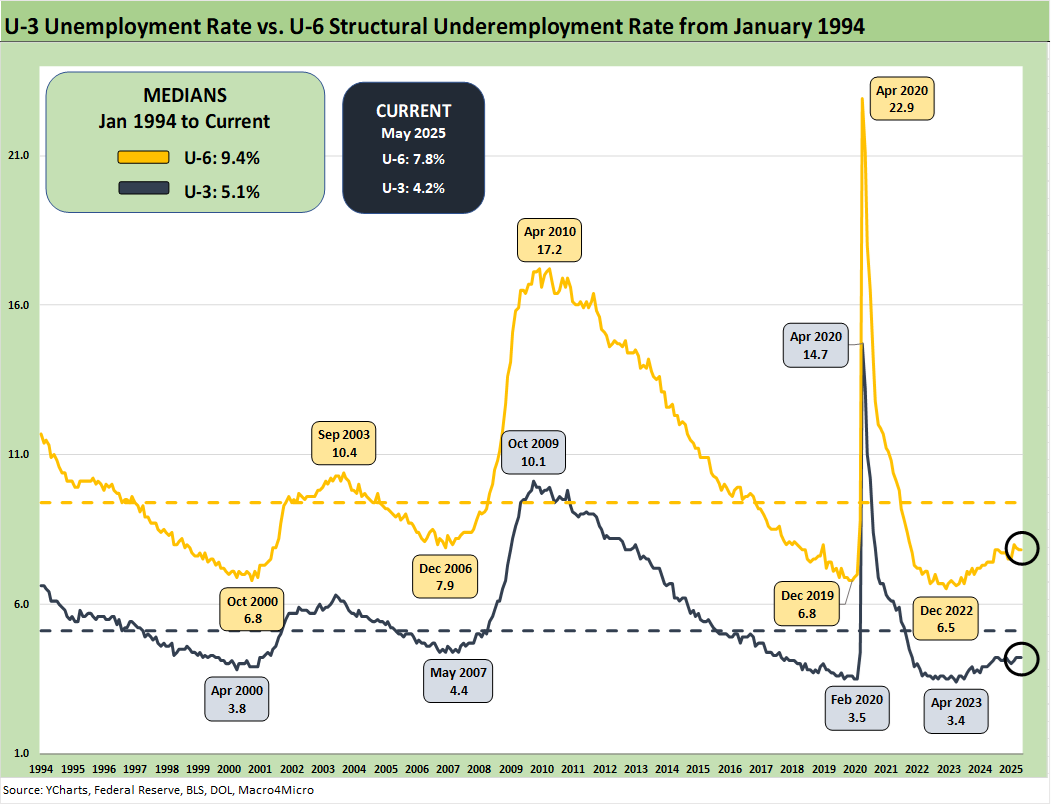
The above chart updates the time series for the U-3 unemployment rate and U-6 structural underemployment rate across the years from 1994. The current U-3 rate was flat at +4.2% As a reminder, the U-6 metric is defined with the numerator as “total unemployed + persons marginally attached to the labor force + total employed part time for economic reasons.” The denominator is “civilian labor force + workers marginally attached to the labor force.”
The U-6 ticked was flat 7.8%. The U-6 rose sharply in Feb 2025 to 8.0% from 7.5% in Jan 2025. The current 7.8% is well above the 6% handles seen in spring of 2023. The U-6 is also up from the 7.4% level of last year during May 2024. The 7.8% U-6 is below the median from 1994 of +9.4%. That 9.4% includes the post-crisis shock and the longest recession since the Great Depression.
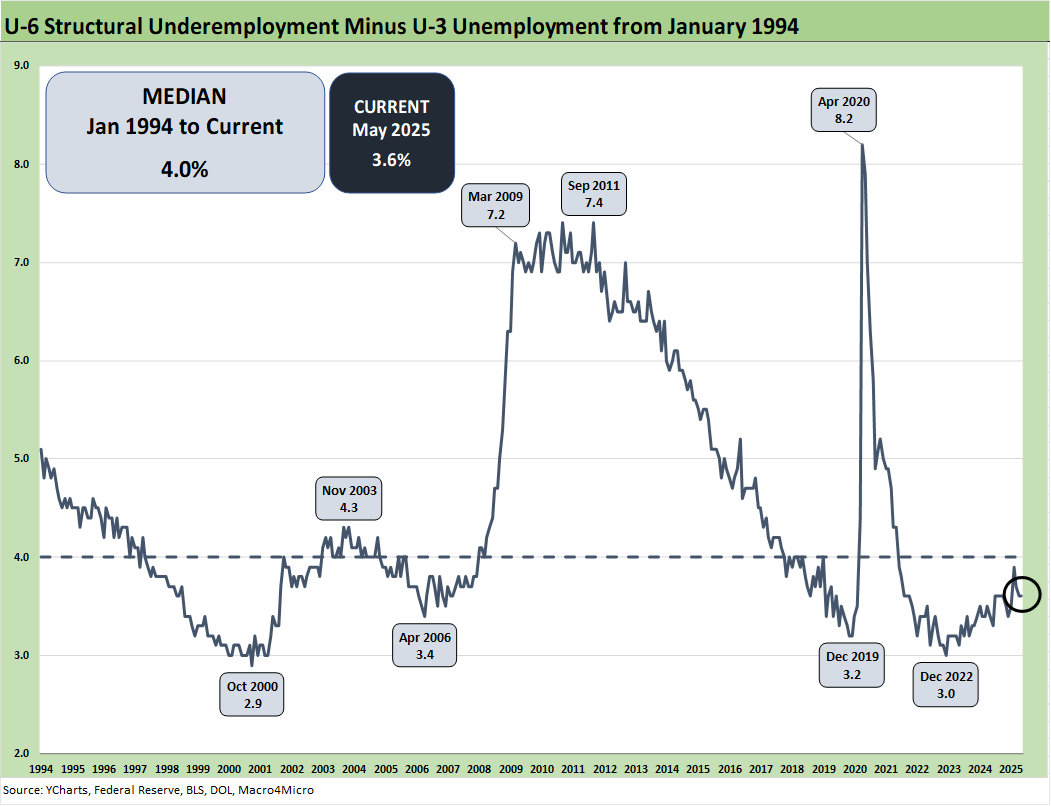
The time series above updates the U-6 minus U-3 differential as a measure of relative employment quality and to flag risks of major dislocations in large swaths of the economy (think oil patch in the late 1980s, tech bubble imploding 2001-2003, financial services and automotive in 2009). The current 3.6% differential is modestly below the long-term median of 4.0%. The job ranks are steady now but in an eerie stretch of time as the tariffs get worked out and employers make decisions on offsets to mitigate the tariff damage if they are not passing along the cost in prices or want to mitigate the scale of the price increase to customers.
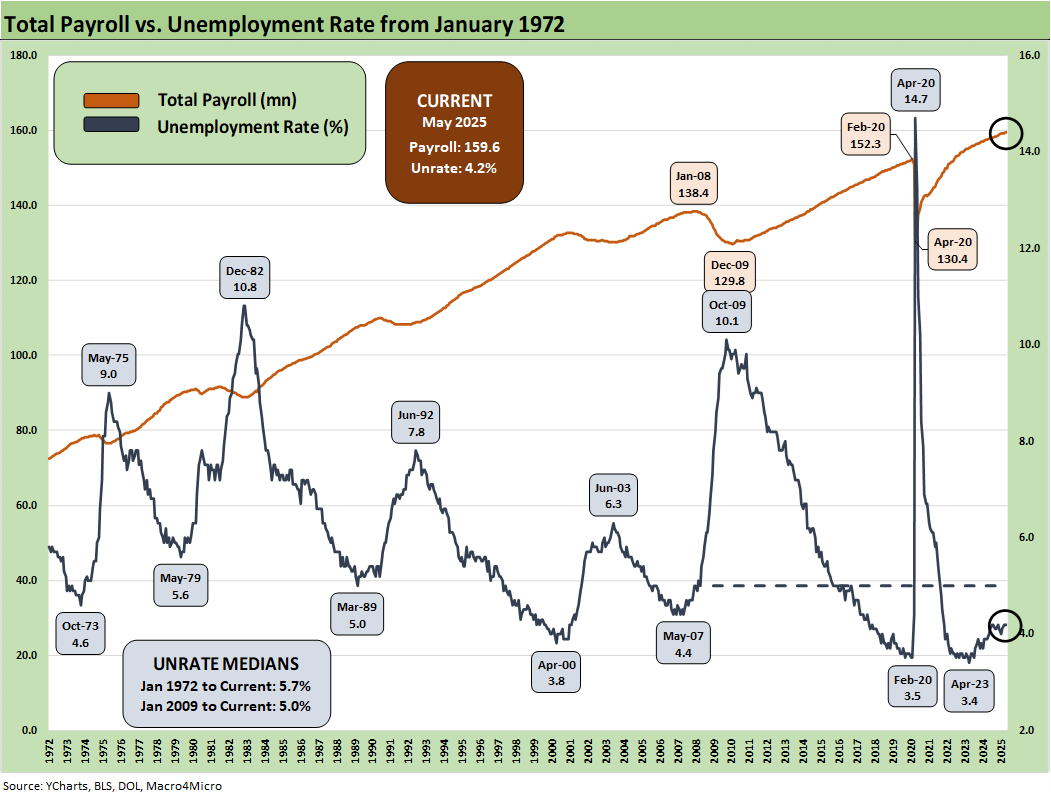
The above chart updates total payroll vs. the unemployment rate. More bodies with more paychecks is always by definition a good thing. The trick from here is how the consumer deploys that paycheck. The consumer has ample reasons to get defensive and push saving rates much higher than what we saw in the monthly PCE numbers. Consumption showed some fade this past PCE release but income was strong (see PCE April 2025: Personal Income and Outlays 5-30-25). We also saw some PCE softening in the 2nd estimate for 1Q25 GDP (see 1Q25 GDP 2nd Estimate: Tariff and Courthouse Waiting Game 5-29-25).
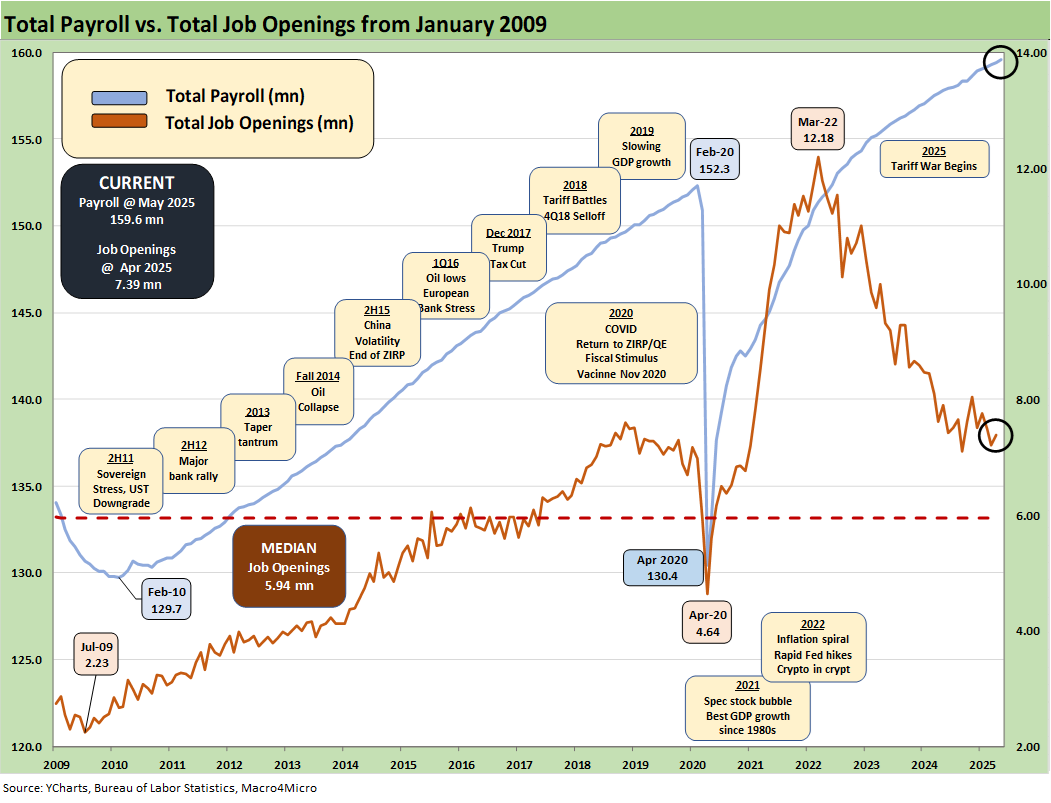
The above chart updates the total payroll number vs. job openings. The most recent JOLTS number was favorable and just below the highest level posted under Trump in his first term when he saw 7.5 million in Nov 2018 (see JOLTS April 2025: Slow Burn or Steady State? 6-3-25). The 7.4 million this past week was solid.
The 1Q25 earnings season including the later Retail reporting period have been solid at the median with some signs of trouble in more vulnerable sectors such as retail and numerous auto players. The management teams have a lot of moving parts to factor into guidance whether quantitative or qualitative.
The color in the trade literature and in economic releases such as the Beige Book that drill down into the weeds are clearly signaling the tariffs are a major problem. For some (notably retail and many small businesses), the threat can be existential. The cash drain in “writing the tariff check” and the hit to earnings from the expense line can impair trade credit and fuel bank credit problems for small businesses that are the backbone of payroll counts in the US.
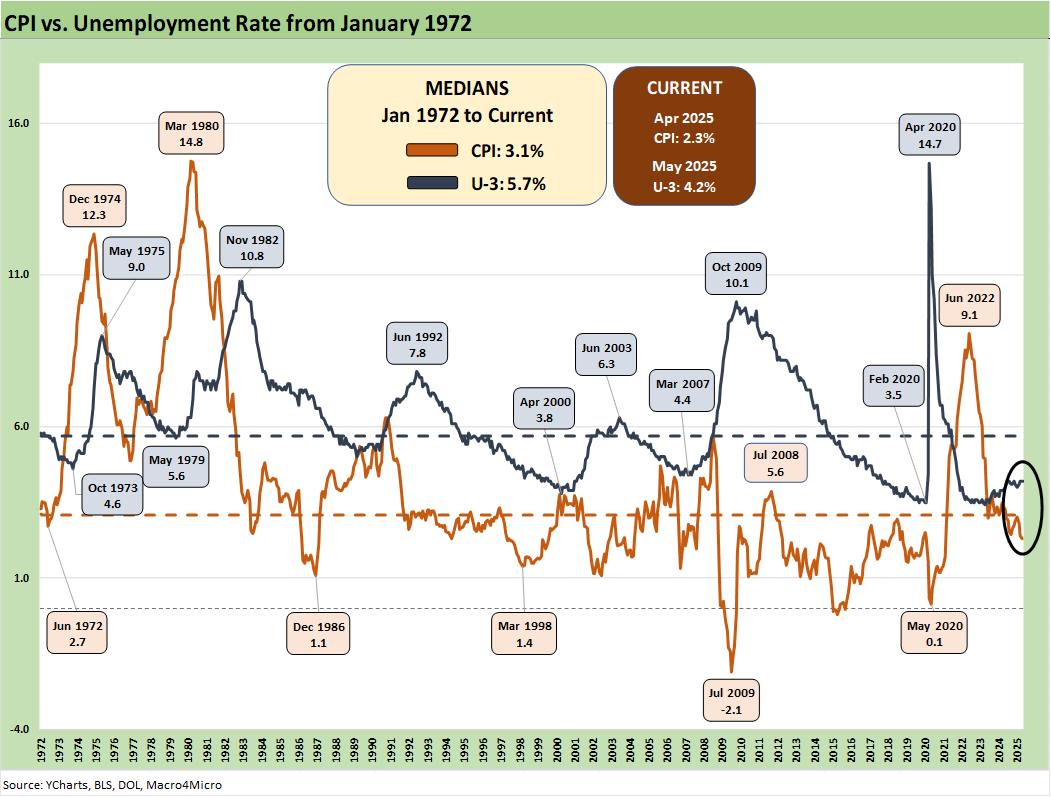
The CPI vs. Unemployment Rate time series will start getting more focus as stagflation debates get louder and the focus on upward pricing pressure from tariffs get more reliably framed against potential layoffs and downsizings. At 4.2% on the U-3 in May 2025, that frames up favorably vs. the long-term median of 5.7% while the April 2025 headline CPI of 2.3% (2.8% Core CPI) remains under the long-term median of 3.1% (see CPI April 2025: 1st Inning for Tariffs and CPI 5-13-25).
Inflation reports have generally brought good news given the scale of the forward threat. If there was no tariff threat, the FOMC would be easing more rapidly. Trump complains, but he does not even admit that the buyer writes the tariff check. He is easing into admitting it indirectly, but then he defaults to the theme of collecting “hundreds of billions” from selling counties in Trump 1.0.
The 4.2% U-3 is in line with metrics that in the 1990s would have been called full employment. Being competitive in U-3 levels with the 1990s is a good thing, but we expect unemployment to rise across 2H25 as tariffs elicit reactions. The 1990s was actually the greatest economy in postwar US history and crushed the numbers of the post-2000 Presidents. That gets into the broader discussions of how high sovereign systemic debt can undermine growth and the post-2000 years have been a case study in rising US sovereign leverage.
See also:
US Trade in Goods April 2025: Imports Be Damned 6-5-25
Past-Prologue Perspective for 2025: Memory Lane 2018 6-5-25
JOLTS April 2025: Slow Burn or Steady State? 6-3-25
Tariffs: Testing Trade Partner Mettle 6-3-25
Footnotes & Flashbacks: Credit Markets 6-2-25
Footnotes & Flashbacks: State of Yields 6-1-25
Footnotes & Flashbacks: Asset Returns 6-1-25
Mini Market Lookback: Out of Tacos, Tariff Man Returns 5-31-25
PCE April 2025: Personal Income and Outlays 5-30-25
Credit Snapshot: Meritage Homes (MTH) 5-30-24
1Q25 GDP 2nd Estimate: Tariff and Courthouse Waiting Game 5-29-25
Homebuilder Rankings: Volumes, Market Caps, ASPs 5-28-25
Durable Goods Apr25: Hitting an Air Pocket 5-27-25
Mini Market Lookback: Tariff Excess N+1 5-24-25
New Home Sales April 2025: Waiting Game Does Not Help 5-23-25
Existing Home Sales April 2025: Soft but Steady 5-22-25
Credit Snapshot: Lithia Motors (LAD) 5-20-25
Home Starts April 2025: Metrics Show Wear and Tear 5-19-25
Industrial Production April 2025: CapUte Mixed but Time Will Tell 5-15-25
Retail Sales April 25: Shopping Spree Hangover 5-15-25
Credit Spreads: The Bounce is Back 5-13-25