
3Q25 GDP: Morning After Variables to Ponder
3Q25 was overhyped on headline distortions, but PCE and fixed investment levels are constructive.


You are all 4.3% richer! Best economy in history!
During a holiday shortened week, 3Q25 GDP results offered a hot topic for political spin. 3Q25 GDP showed a much lower level of distortion than what has been seen in 2025 so far in the 1Q25 and 2Q25 numbers.
With the aggressive tariff program, dramatic swings in imports, and distorting impact of the working capital volatility, there were notable anomalies in the numbers. Headline GDP saw big moves as pre-tariff inventory spiked and swings in import totals drove major deltas in the import line and in working capital build and subsequent downsizing. Even in 3Q25, net export moves alone added almost +1.6% to the headline GDP of +4.3%. (We always highlight that a substantial decline in imports also implies an inability to capture low-cost sourcing opportunities and thus raises cost to US-based buyers. At the same time, this bumps GPD higher.)
The growth story and cyclical drivers are found in Personal Consumption Expenditures (PCE) at 68% of GDP and another 1/3 of GDP essentially split between Gross Private Domestic Investment (over 17%) and Government Consumption and Investment (~17%). As detailed below, the net exports gets the total back to 100%.
The PCE contribution to GDP in 3Q25 was lower than 3 of 4 quarters in 2024. That did not get mentioned much. The reality is the numbers from 2023 as well as 2024 put up better PCE growth numbers than 2025. For fixed investment, 2025 beats 2024 across the main buckets as detailed below, but 2023 (not included in these charts) beat 2025.
Trump’s latest Jedi Mind Trick on how great 3Q25 was just the usual politics. The good news is that 2025 is not flashing recession signals since that type of downside will take more damage across payrolls and industrial markets than what we see now.
In the end, the idea that the economy in 2025 is a great economy is absurd but the same holds true for the comments that say 2025 is “collapsing.” The most moronic statement would be that 2023 and 2024 were economies of a “dead country.” The numbers don’t say that at all.
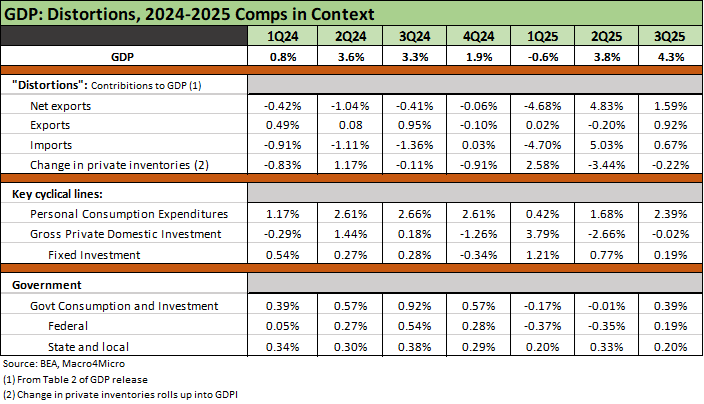
The above chart plots the main moving parts of the 3Q25 GDP performance, and we also include those lines for each quarter from 1Q24 through the latest 3Q25 results from this week’s release. The second chart further below details Fixed Investment lines for each quarter.
3Q25 overall was a solid quarter with the headline GDP less distorted by tariff effects from inventory than that seen in 1Q25 or 2Q25. The low adjustment for inventories was -0.22% in 3Q25. In contrast, pre-tariff inventory builds and GDP distortions seen in 1Q25 posted a +2.58% boost to GDP ahead of the rapid liquidation of inventory that reduced GDP by -3.44% in 2Q25. With aggressive tariff policies flowing into working capital management, 2025 has been highly unusual on both the net export and inventory lines. Those are distortions in reading the trend even if they reflect real economic events.
The goal in looking at the moving parts of GDP is to frame sea level growth, and that is driven by the multiplier effects of the PCE line (68% of GDP), GPDI (over 17% of GDP), and the Government line (17%). Those three buckets add up to just over 102% of GDP. Net exports of -2.5% then brings you back to 100%.
As we covered in a separate post on LinkedIn, the GDP discussion usually leaves out the distortions unless the headline number is a bad one and the White House wants to talk the number up. We heard “it is higher than it looks” from the White House after the 1Q25 GDP of -0.6%, but we did not get the “lower than it looks” speech after 2Q25 when GDP was boosted by the net export line with +5.0% from lower imports after the pre-tariff order boom in 1Q25.
Consumer and Fixed Investment not signaling “Golden Years”
The PCE growth for 3Q25 was solid in 2025 context but posted lower contributions to 3Q25 GDP than 3 of the 4 quarters in 2024 (yes, the year Trump claims the US was “dead.”) . Consumers are not dead yet as covered in the GDP numbers, Retail Sales reports, and PCE Income and Outlays.
On the other hand, this is not 2021 with all its high flying pent-up demand. Calling up the quarterly PCE from the BEA data set is not rocket science, and the 2025 consumer engine is mediocre. Whether stagflation risks (payrolls, consumer prices, tariffs, health care premiums, etc.) eat up more of the household budget allocation in 2026 still needs to play out. Having health care could be a zero-sum game for many that hits the PCE goods and services lines. The risk symmetry is not good at this point.
GPDI growth in 3Q25 was slightly negative with fixed investment growth in 3Q25 lower than 3 of 4 quarters in 2024. The Government contribution % to GDP was the highest of 2025 but lower than 3 quarters of 2024. Fixed investment lines have posted notable variances during the post-COVID stimulus period, but were low in 3Q25 at +0.19%, which is less than 3 of 4 quarters in 2024. Residential investment was negative for all 3 quarters in 2025.
GDP commentary often turns into an axed, political interpretation, but some adjustments should always be considered. The numbers are at least objective even if there are some BEA assumptions and models in the storyline.
Declining imports (“less negative” net exports) bolsters GDP (2Q25 by +4.83%, 3Q25 by +1.59%). Recall that lower imports alone added +5.03% in 2Q25 but only +0.67% in 3Q25 after shaving off -4.70% in the negative GDP quarter (-0.6%) of 1Q25 when buyers were front-loading pre-tariff imports.
Exports rose in 3Q25 after posting negative growth in 2Q25. That +1.59% net export contribution is a big chunk of the +4.3% headline GDP in what is a 2% handle GDP economy in the new millennium. Take out the net exports distortion and you are back under the 3.0% line. The “2% economy” curse in general has been a fact of life since the 2000 elections with some exceptions. Many attributed it to high government debt since the Clinton surplus. An “other worldly” supply of UST debt and massive budget deficits will only get worse ahead under Trump (or anyone else in the seat).
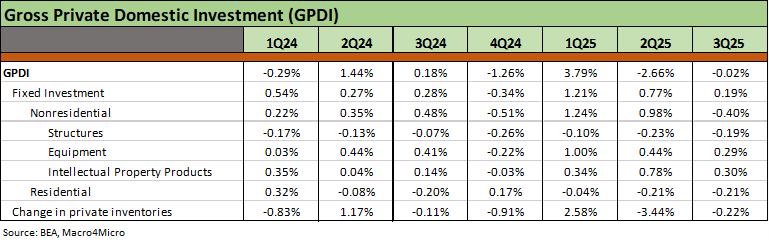
The above table breaks out the GDP contributions across the key GPDI and Fixed Investment lines. There is little to signal the arrival of a Golden Age or even anything close to the best recovery year since COVID. While the tax bill (capex tax deductions, etc.) should encourage investment and tariffs should bolster reshoring (auto OEMs. Pharma, etc.), that is not jumping off the page at this point. Capex is tied to economics first and tax second. For the trillions and trillions of trade partner investment promises, the old expression of “call me when we get there” is evident in the above chart. Elections and the IEEPA SCOTUS decision (and Trump policy reactions) will be 2026 variables.
The AI boom should sustain solid numbers, but the more immediate impact of tariffs will be headwinds for company budget planning, pain for small businesses, and higher costs. It is worth noting that the Structures line is negative for all 3 quarters while Equipment was positive but not well ahead of 2024. Equipment has many challenges from the tariff impacts as evident in weak manufacturing payroll performance. Intellectual Property is always a strong line in the tech boom and is having a solid 2025.
For all the debate on the timing of the “benefits” from tariff expenses paid by the buyer, the reality is that tariffs only guarantee that a tariff payment expense will need to be paid by the buyer. That tariff cost is an expense or rolls into cost of sales. That means profit margins go down, prices go up, and/or other expenses are taken out in some form (often payroll for small businesses).
That inherent tariff expense vs. price vs. cost-cutting dynamics will continue into 2026. Partisan economists tend to spin that topic. That economic reality goes in the category of “you can run but you can’t hide” from the tariff costs (footnote to Joe Louis, heavyweight champion).
Most everything else in the tariff debate is a theory and not a hard fact. The worst of the lies (“seller pays the tariff”) will echo across economic history to the embarrassment of those that have any shame at all (a dwindling population of zero in White House economists). The “selling nation pays” is a blanket statement by Trump and a general “seller pays” favor comes from so many in Washington. That falsehood is one of the lead stories of 2025 and arguably will be for the entire term. “Someone pays somewhere” starting with the buyer.
The main tariff question is whether the seller cut prices to offset the tariff, and that has very little empirical support. Massive buyers with market clout can try to extract price concessions. That comes down to a range of issues such as the existence of substitutes and the usual supplier chain checklist of factors.
Small businesses are screwed. The expected boom in reshoring jobs and investments are clearly not here yet in the GDP numbers or payrolls (see Payrolls Nov 25: Into the Weeds 12-16-25, Employment Nov 2025: Bad News is Bad News 12-16-25). We are still playing catch-up on payroll data. The December jobs data for small businesses from ADP will be a useful data point along with the usual BLS data.
The tariffs drive price increases to consumers cited by the bears will remain a market test as time unfolds for the economic assumptions list. That tariff price recovery question is still playing out into 2026 with the USMCA review also on the horizon. Many tariff fans want to pretend that debate is over and that the game clock has run out. In fact, prices are higher overall and materially higher for many product lines. Trump can rely on the red hats and political bobbleheads to agree with him, but prices in aggregate are higher for those located on the planet Earth with positive inflation.
See also:
Durable Goods Oct25: Core Capex Still in Gear 12-23-25
Market Lookback: Last Call for Unusual Behavior 12-22-25
Existing Home Sales Nov 2025 12-21-25
November CPI: Tricky Navigation 12-18-25
Payrolls Nov 25: Into the Weeds 12-16-25
Employment Nov 2025: Bad News is Bad News 12-16-25
The Curve 12-15-25
Market Commentary: Asset Returns 12-14-25
Market Lookback: FOMC Fragments, Rate Debates Murky 12-13-25
FOMC: Dot Plot Scatters for 2026 12-10-25
PCE, Income & Outlays: Calendar Gap Closing 12-5-25
Simplifying the Affordability Question 11-11-25
CPI September 2025: Headline Up, Core Down 10-24-25.
2Q25 GDP Final Estimate: Big Upward Revision 9-25-25
1Q25 GDP Advance Estimate: Roll Your Own Distortions 4-30-25
Trump’s “Greatest Economy in History”: Not Even Close 3-5-25
Gut Checking Trump GDP Record 3-5-25