
Footnotes & Flashbacks: State of Yields 5-4-25
The UST made an adverse move off a very hectic week of macro releases, trade speculation, and earnings reports.


Tariff and trade negotiation hypnosis. Repeat after me…
The past week showed a modestly adverse move for duration as the UST curve shifted higher on constructive macro news including solid payroll and more than a few signs of steady consumer spending.
We get an FOMC meeting this coming week in the home stretch of what was a constructive 1Q25 earnings season.
After this week, there is little reason for the FOMC to move and the market will keep getting wagged by trade and tariff speculation and what will come out the other side of the pause. For now, speculation on tariff outcomes still rules the roost.

The above chart plots some key cyclical transition periods from the Carter inversion of 1978 across the Volcker years, the credit cycle peak in 1989, the TMT cycle in 2000, and the housing bubble in 2006. We then jump beyond the crisis period and the ZIRP years with the QE and normalization distortions to the Oct 2023 UST peak date on the 10Y UST. The UST rates now are very low by any historical standard but well off the Sept 2024 lows.
With the mix of payroll, PCE inflation, and 1Q25 GDP first estimate, there is minimal reason to expect a move by the Fed. If anything, the week was reassuring on the current economic run rates, consumer and fixed investment. That means speculation around trade deals and generally unreliable Trump mind-reading is the main event ahead of another FOMC meeting this week.
While we get the themes and spin from the White House that tariff dealmaking prospects are bright (“I gotta wear shades” etc.), life revolves around the Big 4 at 60% of trade (EU, Mexico, Canada, China). There are no signs of a rapid deal in any of those making progress while Japan and South Korea also remain open. Japan has been pushing back. Japan has termed their UST holdings “a card.” They hold over $1 trillion. Essentially, Trump reneged on a deal he negotiated with South Korea (KORUS) during Trump 1.0.

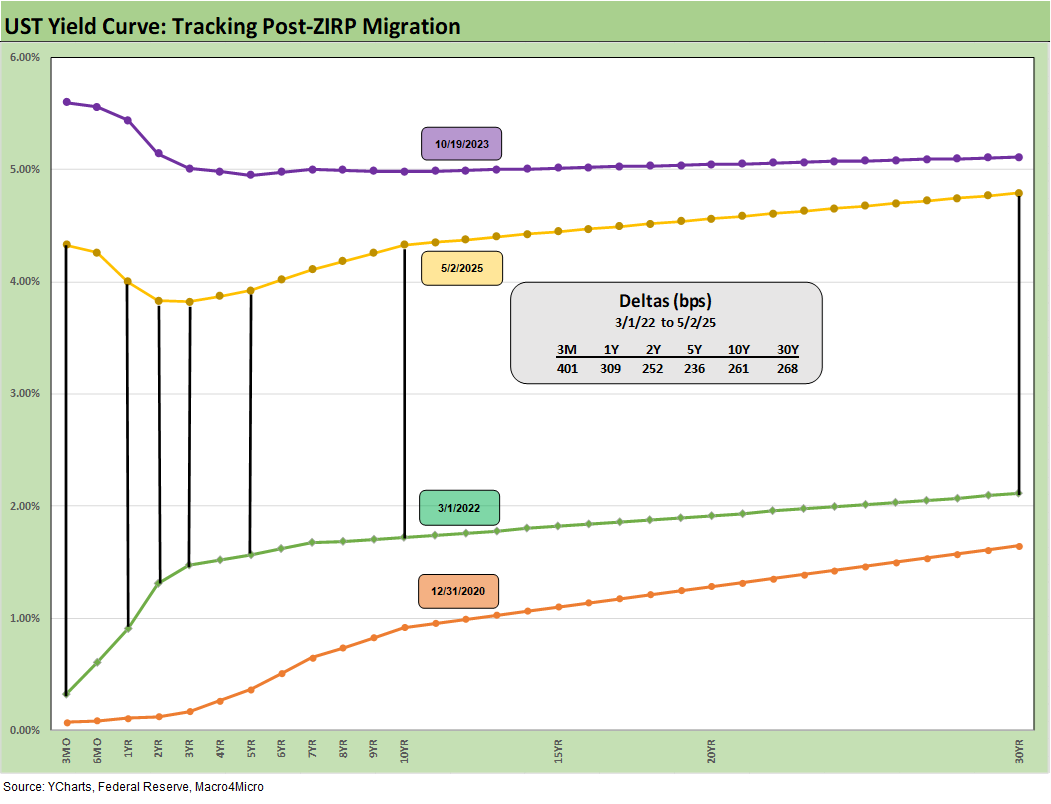
The above chart replays our weekly chart detailing the migration of the UST curve from 12-31-21 with memory boxes detailing the tightening dates and magnitude and more recently the easing. The UST curve seems to intermittently mix bear steepening patterns and flattening rallies since the Sept 2024 lows, but fear was creeping into the shapeshifting after Liberation Day before calming down with the pause.
We had another modest move higher this past week after a heavy wave of critical macro releases including PCE inflation + Income/Outlays, payrolls, JOLTS, 1Q25 GDP, and Employment Cost index (see links at bottom). We saw some weakness in construction (see Construction: Singing the Blues or Tuning Up for Reshoring? 5-1-25) and the payroll and income/outlays report made everyone quickly forget the worst Consumer Confidence reading since Oct 2011.
We get some more color from the FOMC this week, but it is not a dot plot date with forecasts. Trump will make noise about the lack of Fed easing, but he might help himself If he stopped saying “seller pays” the tariff. It does not enhance the ability to make his case and has the opposite effect with those who know even a little about tariffs. The FOMC needs to be sensitive to stagflation risk and nothing in recent weeks or in the March macro numbers changes that risk.

The above chart details the material move from the peak UST curve of 10-19-23 down into the UST bull rally of Nov-Dec 2023 and then eventually into the lows of Sept 2024. The Sept 2024 low tick only came after a bear steepener hit the curve through the summer of 2024. We then move back into the bear steepener mode until the tariffs roiled the UST markets and initially sent 2Y to 30Y lower on cyclical fears.
Rate volatility moved materially higher with the tariffs and the policies sent the markets into fresh debates on UST supply-demand running alongside nerves around dollar weakness in the global market. The ensuing chaos and UST and USD volatility drove a Trump reciprocal tariff pause (see Footnotes & Flashbacks: State of Yields 4-13-25). His impressive discussion on his underlying thought process was that people were getting “Yippy.” We refer you to those earlier Footnotes publications. The volatility still leaves the 10Y UST well inside 2025 highs.

The above UST deltas for the past week reflect some constructive hard macro numbers, a good earnings season despite the inability to frame confident guidance (in many cases, suspended guidance) and some hopeful tariff news flow on the China-US trade war.
The China trade war relief is arguably a very “soft” hope with a longer tail to completion. Any resolution is likely to be only on the other side of depleting inventories, some empty shelves, and global dislocation and disarray in shipping, freight and logistics.
The PCE price index (see PCE March 2025: Personal Income and Outlays 4-30-25) and Employment Cost Index, i.e., the ECI (see Employment Cost Index 1Q25: Labor is Not the Main Worry 5-1-25) were both reassuring on the inflation front as to where we stand as of March 2025 ahead of the coming tariff explosion. The lack of wage inflation or goods/serves pressures in the ECI and PCE numbers did not move the needle on Fed timing and the same for solid payroll numbers (see Payrolls April 2025: Into the Weeds 5-2-25, Payroll April 2025: Moods and Time Horizons 5-2-25). The ECI was moving lower while they outpaced inflation, and thus workers were seeing real increases.
The GDP lines for 1Q25 first estimate had some notable anomalies with the inventory whipsaw (added 2.25% to GDP) set against the import spike which by itself was a -5.0% to GDP contribution (Table 2 of the GDP release). The net exports of Goods and Services had an impact of -4.83% contribution to GDP. The main takeaway to us is that higher inventories imply higher forward sales expectations but also can mean inventory liquidation and negative growth in that GDP line when imports will be coming down in coming months as evidenced in the empty ports and empty ships.
In other words, there will be some big and currently uncertain moving parts ahead from sales volumes and prices to import and export lines for 2Q25. The UST watchers will be looking for contraction risk and also upward price pressure – notably on goods.

The YTD UST delta shows the rally from 2Y to 10Y with a minimal move in 30Y. This has bolstered the bond ETF performances vs. equities (see Footnotes & Flashbacks: Asset Returns 5-4-25). We look at the 2Y to 10Y UST slope time series later in this commentary.
The post-Sept 2024 bear steepener is broken out above. The pressure of the FOMC to ease needs at the very least a bad jobs report to give the FOMC room to navigate toward the other side of the dual mandate. The payroll and JOLTS data this past week killed that idea. Meanwhile, the March income and outlays data showed resilience even if we can find lower growth rates along many GDP line items.
The White House noise is a headache for Powell, but the clock is ticking on tariffs, and those are not tariffs set by the FOMC. If trade deals break down, the trick will be in the price impact. Trump says “the seller pays” as he clearly stated in his Time Magazine interview (see Mini Market Lookback: Earnings Season Painkiller 4-26-25). That is factually incorrect.
Trump would prefer some FOMC involvement to keep the tariff topic as murky as possible as opposed to a clear case of a factual misstatement that shows his lack of basic understanding of trade economics and industry pricing dynamics. His economics team fall into line on any combination of fear or the need for power. It will be fleshed out in time after the buyer pays the tariff and various markets show how that cost is dispersed across the transaction chain.

The above chart updates the mixed steepener since the end of 2023 through today with a big rally on the front end and a more restrained modest upward move in rates beyond 5Y. The end of 2023 had seen an impressive rally of the UST curve and combined duration and credit risk home run in Nov-Dec 2023 as detailed often in past commentaries. The longer end of the UST curve has been stubborn as the crow flies despite the fall 2024 rally.
The big fear that we keep hearing is that economic stagnation comes along with goods inflation tied to tariffs. Then “stagflation” will be a very frequently used term, Stagflation is much worse than inflation, and the topic would get very toxic and political very quicky. The Fed has policy weapons to combat inflation. In contrast, stagflation is a market Godzilla.
The inventory drawdown during 2Q25 with the China trade disruptions has the risk of turbocharging the inflation effects with supply-demand imbalances above and beyond the tariff costs. That combined effect has not gained much airtime, but we got a taste after COVID in some major product groups.

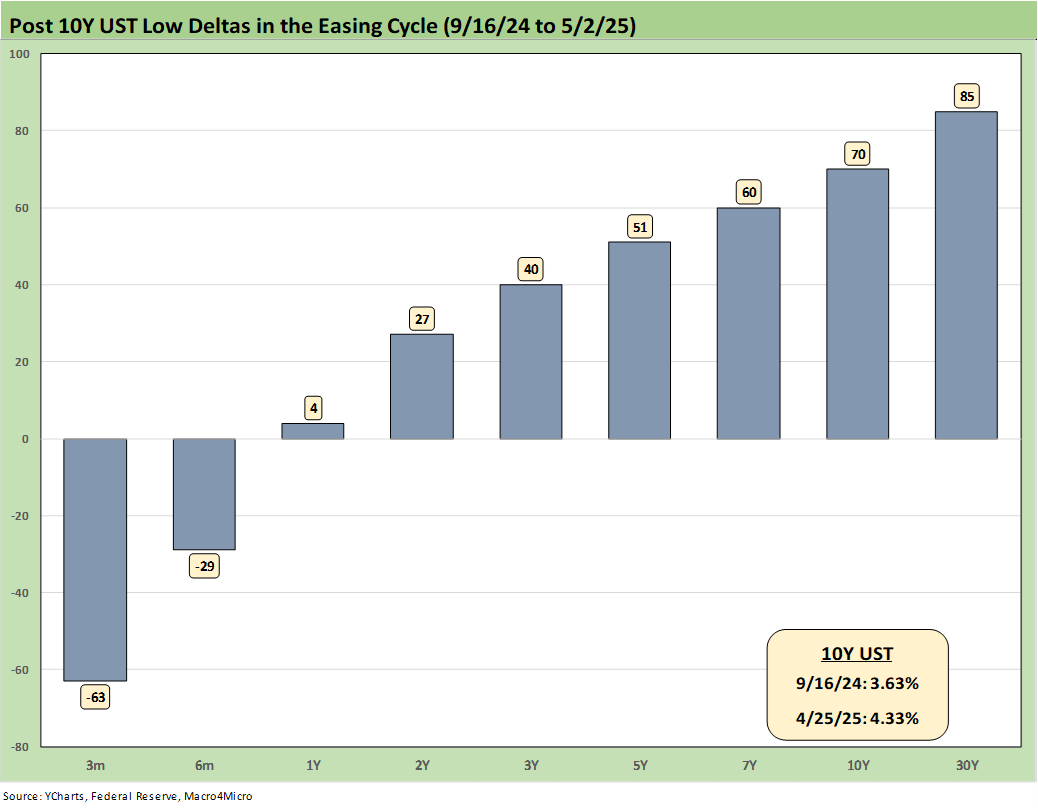
The above chart breaks out the running UST deltas since the peak date of the 10Y UST (10-19-23). Wiping out that 10Y UST delta of -65 bps since the peak in Oct 2023 would take some very bad news on inflation or a more sustained erosion of confidence in the US macro picture (weak dollar, erosion of buyers, net sellers, etc.). The weaker dollar is not helping any more than the record deficits, soaring interest bill, and UST supply needs.

The above chart updates the UST curve for this past Friday and the Freddie Mac 30Y Mortgage benchmark rate (noon Thursday release). We include two useful historical periods including the peak homebuilder year end of 2005 and mid-2006 when RMBS quality concerns were catching headlines as the housing bubble was peaking. We post UST curves for each period in the chart.
The past week was 6.76% for Freddie’s noon Thursday pricing. That is down by -5 bps from the prior week and below the 1Q25 average of 6.83%. Some other surveys by Friday close got back near 6.9% after the payroll numbers and more bullish tone on the economy.
We recently added a column above detailing the differential between the Freddie Mac 30Y and the 10Y UST. That differential moved lower this week to +243 bps from +252 bps last week. The year 2005 posted a differential of +100 bps and makes a statement on what the mortgage market was like in 2005 in terms of how “hot” (i.e. excessive and risk blind) the mortgage market was during that peak homebuilding year. RMBS had run amok.

The above chart updates the time series for the 2Y to 10Y UST slope. We see an upward sloping curve segment at +50 bps relative to the post-1984 median of +91 bps. We are a long way from the -108 bps inversion of July 2023.
In the box within the chart, we also include the other UST segment slopes we watch along with the medians.

The above chart uses a shorter timeline from the start of 2021 during ZIRP for better granularity in recent trends. We see the peak slope at +159 bps near the end of March 2021 and then the plunge to the -108 bps inversion in July 2023 after an earlier peak inversion of -107 bps in March 2023 just ahead of the regional bank crisis.
We wrap this week’s State of Yields with an update of the running UST deltas since March 1, 2022 just ahead of the end of ZIRP (effective 3-17-22). We include the 12-31-20 UST curve and 10-19-23 peak UST curve as frames of reference.
See also:
Footnotes & Flashbacks: Asset Returns 5-4-25
Mini Market Lookback: Inflated Worry or Slow Train Wreck? 5-3-25
Payrolls April 2025: Into the Weeds 5-2-25
Payroll April 2025: Moods and Time Horizons 5-2-25
Construction: Singing the Blues or Tuning Up for Reshoring? 5-1-25
Employment Cost Index 1Q25: Labor is Not the Main Worry 5-1-25
1Q25 GDP: Into the Investment Weeds 4-30-25
PCE March 2025: Personal Income and Outlays 4-30-25
1Q25 GDP Advance Estimate: Roll Your Own Distortions 4-30-25
JOLTS Mar 2025: No News is Good News 4-29-25
Tariffs: Amazon and Canada Add to the Drama 4-29-25
Credit Snapshot: D.R. Horton (DHI) 4-28-25
Footnotes & Flashbacks: Credit Markets 4-28-25
Mini Market Lookback: Earnings Season Painkiller 4-26-25
Existing Home Sales March 2025: Inventory and Prices Higher, Sales Lower 4-24-25
Durable Goods March 2025: Boeing Masking Some Mixed Results 4-24-25
Equipment Rentals: Pocket of Optimism? 4-24-25
Credit Snapshot: Herc Holdings (HRI) 4-23-25
New Home Sales March 2025: A Good News Sighting? 4-23-25
Mini Market Lookback: The Powell Factor 4-19-25
Ships, Fees, Freight & Logistics Pain: More Inflation? 4-18-25
Home Starts Mar 2025: Weak Single Family Numbers 4-17-25
Credit Snapshot: Service Corp International (SCI) 4-16-25
Retail Sales Mar25: Last Hurrah? 4-16-25
Industrial Production Mar 2025: Capacity Utilization, Pregame 4-16-25
Credit Snapshot: Iron Mountain (IRM) 4-14-25
Mini Market Lookback: Trade’s Big Bang 4-12-25
Tariffs, Pauses, and Piling On: Helter Skelter 4-11-25
CPI March 2025: Fodder for Spin 4-10-25
Credit Snapshot: Avis Budget Group (CAR) 4-9-25