
Footnotes & Flashbacks: Credit Markets 4-28-25
Credit spreads post another contraction week, making progress back to pre-“Liberation Day” levels.


Does skill or luck beat the odds?
The week saw a broad credit spread contraction of -7 bps for US IG and -35 bps for US HY. The odds and timing of tariff severity has been erratic since “Liberation Day” with the US HY index moving from +461 bps to +367 bps as of this past Friday close for just shy of 100 bps tightening but still +48 bps wider for the rolling 1-month.
The nature of the rally this week was more favorable for risk with the tightening magnitude highest for CCCs at -64 bps, then B at -39 bps, and BB at -25 bps. Sector differentiation was limited on the week, with Autos seeing slightly more tightening than others.
While it gets repetitive, there is no getting past the sheer scale of tariff backdrop erosion with minimal progress with China, an election in Canada that could smoke out some real responses in the aftermath, and a clock ticking for the EU somewhat tied into the Trump pause but with an inevitable reaction on the way at some point. For Mexico, the mystery of a response plan continues with manufacturing pain soon to set in by the summer. Mexico sees political pressure to act if Canada and EU pull some triggers.
This week sees the 1Q25 GDP advance estimate, PCE inflation (with the income and outlays numbers), JOLTS/payroll, and more tariff signals from factory orders and the final durables tally.

The above chart updates the running 1-week and 1-month credit deltas across IG and HY and for the BBB to CCC tiers. The 1-month trailing widening has reduced significantly from the initial tariff news and at +13 bps for US IG and +48 bps for US HY, it is still a painful stretch. Against this backdrop, relatively favorable tariff developments and the absence of major earnings-driven sentiment shifts contributed to a further tightening of -7 bps for IG and -35 bps for HY.
After this week, we are now closer to pre-tariff levels of +305 bps in late March (3/24) than the +461 bps level (4/7) reached at the worst of the trade scenario spinning. We laid out our most recent thoughts on the evolving trade drama already with US-China the new focus and how little Trump’s Time interview did to reassure nerves. We think that there is too much confidence in a rational outcome on trade from here.

The above chart covers total and excess returns across HY, IG, and their respective credit tiers. All except for CCC have returned to positive total returns on the year amidst the spread rally and a little more help from the curve this week. On the other hand, the widening on the year still brings all the above indices into negative excess return territory. The above is a good reminder of the more traditional rationale to hold bonds amidst market volatility that broke down in 2022 as spreads gapped and yields rose.

IG spreads ended the week another -7 bps tighter and now down to +104 bps as we near the end of April. Spreads remain a stretch away from the longer-term medians but as we look across time above a level around here was only maintained in the stretch leading into the GFC. We do not see remotely similar risk here, but spreads at this level are vulnerable as we saw earlier this month.
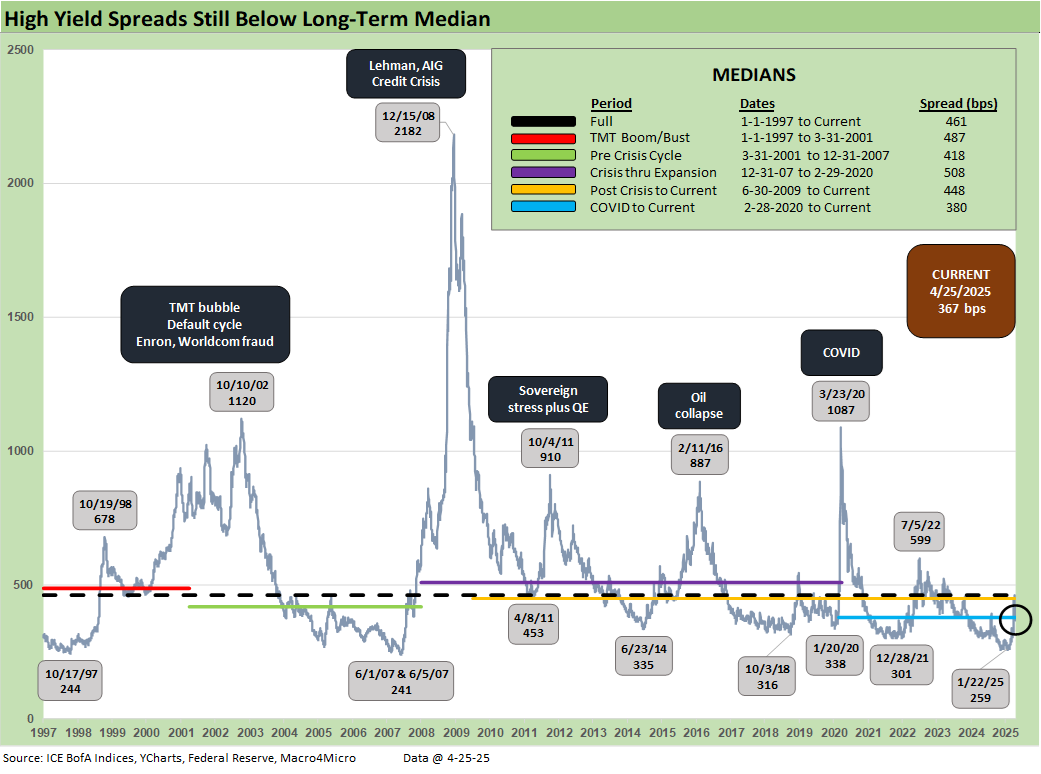
Another solid week for risk and HY narrowly sees -35 bps of tightening to the +367 bps level and below all the long-term medians listed above, including the +380 bps post-COVID median. Even within a historically higher-quality HY index, we view risks as skewed toward renewed widening, given persistent tariff uncertainty and the delayed impact of current measures. As the most recent whipsaw reminded, spreads will gap wider quickly and these relatively better levels provide an opportunity to selectively derisk.

The differential between HY OAS and IG OAS (quality spreads) moved -28 bps this week with the risk rally driving further compression. The recent history has been towards a tighter relationship between these two measures as IG quality skews further towards BBB and HY quality skews towards BB. This most recent compression brings us back below the long-term medians listed above but still far from the +178 bps low earlier this year.

The “BB OAS minus BBB OAS” quality spread differential narrowed again this week by -17 bps to +102 bps. The current levels return to below all the medians listed above this week but still well off lows reached late last year.

The BB tier compressed -25 bps since last Thursday to +233 bps and is now over 50 bps below the long-term median. As with many of the measures, the recent move is below the post-COVID median as well
The BB tier is relatively less exposed to cash flow shortfalls at many tariff targets than the B tier, but the BB tier also could be joined by more than a few BBB tier fallen angels if the tariff backdrop and economic fallout “head south.” Autos and commodity-based BBB tier names with full yield curves of unsecured bonds can roil BB tier spreads under more than a few fallen angel scenarios.
The BB tier shows larger weightings of Financial Services, Media, and Leisure. The B tier has higher leverage and more volatile industry level earnings mix. In other words, no tier would escape the wrath of a major tariff fallout and stagflation scenarios. That would mean material quality spread decompression from BB to CCC. Even a simple, old-school economic contraction without high inflation would do damage to these spread levels. In that scenario, the Fed jumps in with two feet.

The B tier compressed -39 bps this week down to +378 bps and now back below the medians listed above. The whipsaw this month saw spreads briefly touch above the long-term median at +486 bps, tightening 108 bps since then.

The B vs. CCC tier OAS time series is plotted above. The timeline for B and CCC spreads highlights the points of major divergence along the way (see The B vs. CCC Battle: Tough Neighborhood, Rough Players 7-7-24).
The current CCC tier OAS at +975 bps tightened by -64 bps the past week and remains above the long-term median of +953 bps. It comes as no surprise that the tariff chaos and potential economic damage could be another moment of B vs. CCC divergence as we wade further into this mess.
The CCC YTW moved below the 14% line to 13.68% but the underlying constituents are widely dispersed across a 80.10 composite dollar price. The CCC tier is still in the pricing zone of equity risk-returns with such yields at this point. CCC investing at this point demands careful capital structure analysis and rigorous issuer-level relative value research. Subject to how these tariffs play out and how the stagflation wildcard unfolds, the distressed players are warming up.

The shorter timeline from Jan 2022 just ahead of the end of ZIRP and start of the tightening cycles gives better granularity on the movements from a low for CCCs of +659 bps in Jan 2022 to a peak of +1226 bps in July 2022 and 1289 bps to end Sept 2022 down to the Jan 2025 tights of +690 bps ahead of the recent spike to current levels.

The B vs. CCC tier differential is broken out above with the current +597 bps still above the long-term median and above the distinct markets shown above with the exception of the TMT HY credit cycle with its +702 bps median.
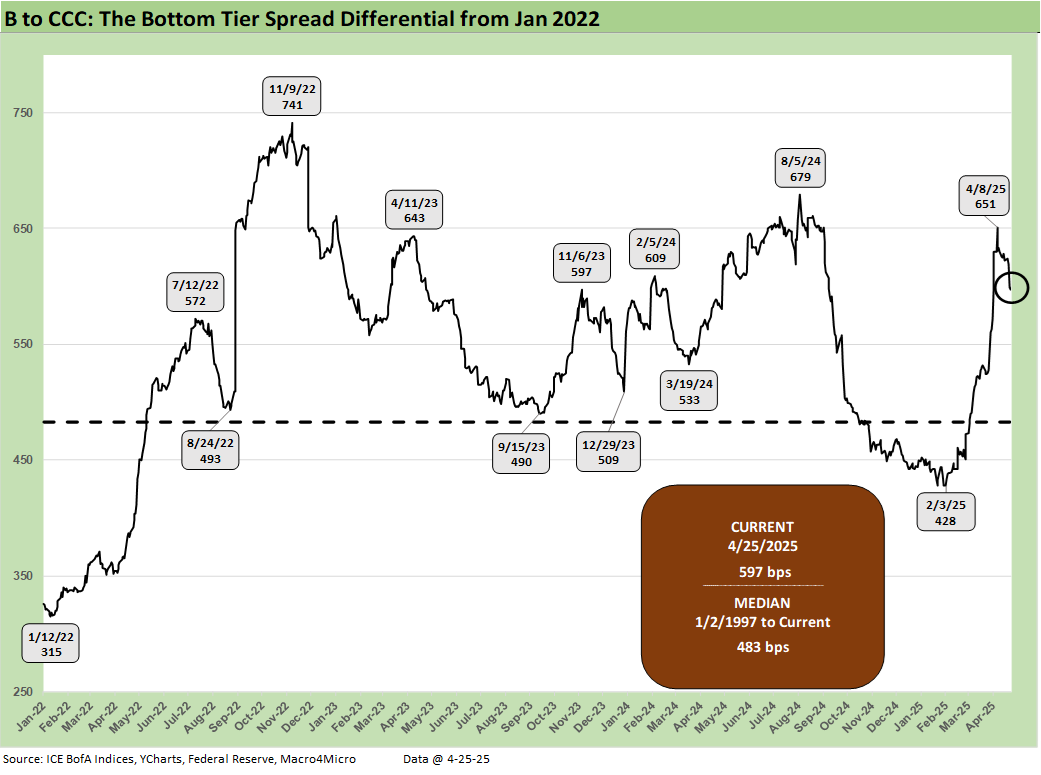
The above chart frames the “B vs. CCC tier” quality spread differential across the short timeline for better granularity. Spreads widened with a vengeance since the low of Feb 2025 at +428 bps even if it has recovered a little.
A look at yields…

Moving away from spreads, which are a little further below long-term medians this week, yields for both IG and HY have a more complex story in historical context given the post-crisis distortions of ZIRP and “normalization.” The normalization period of Dec 2015 to Dec 2018 never really got on track with the economic weakness and Fed easing of 2019 followed by a COVID crisis and return to ZIRP in Mar 2020.
The current IG YTW at 5.22% (vs. 5.35% last week) has come down on the lower UST curve and spread tightening and are now moving back away from the 6.1% pre-ZIRP median. The HY YTW lowered this week to 7.77% (from 8.13%) vs. a pre-ZIRP 9.3% mark. We consider the pre-ZIRP years the most rational frame of reference in light of the post-crisis ZIRP and QE as well as the COVID Fed reactions.
Spreads will remain a key swing factor for reaching those yield medians of pre-ZIRP years, and we just saw material credit risk pricing action on HY the past four weeks. UST yields are a tougher call with the tariff backdrop that still threatens stagflation as well as a technically driven upward shift on the supply-demand fears.
In theory, old fashioned recession risk would pressure UST rates lower and credit spreads higher, but this is no ordinary cyclical turn. We cover the UST shapeshifting in our separate Footnotes publication on yields as the UST curve rallied modestly this week again (see Footnotes & Flashbacks: State of Yields 4-27-25).

The above frames current IG index yields vs. previous credit peaks along with their respective UST curves. We include both prior credit peaks in June 2007 and Dec 1997 for context as prior peak credit cycles when high risk appetites saw investors chasing yields. Those 1997 and 2000 markets saw poor risk symmetry and low spreads.
Today’s curve is still low in those historical credit peak contexts. With stagflation risks back in the mix and the current market beyond the credit cycle peak after the tariffs, the next stretch could see long yields rising as spreads widen out for renewed return pain. The short to intermediate IG market is still the safest bond game for now. The funds that are asset class constrained to HY can take refuge in the higher quality layers.
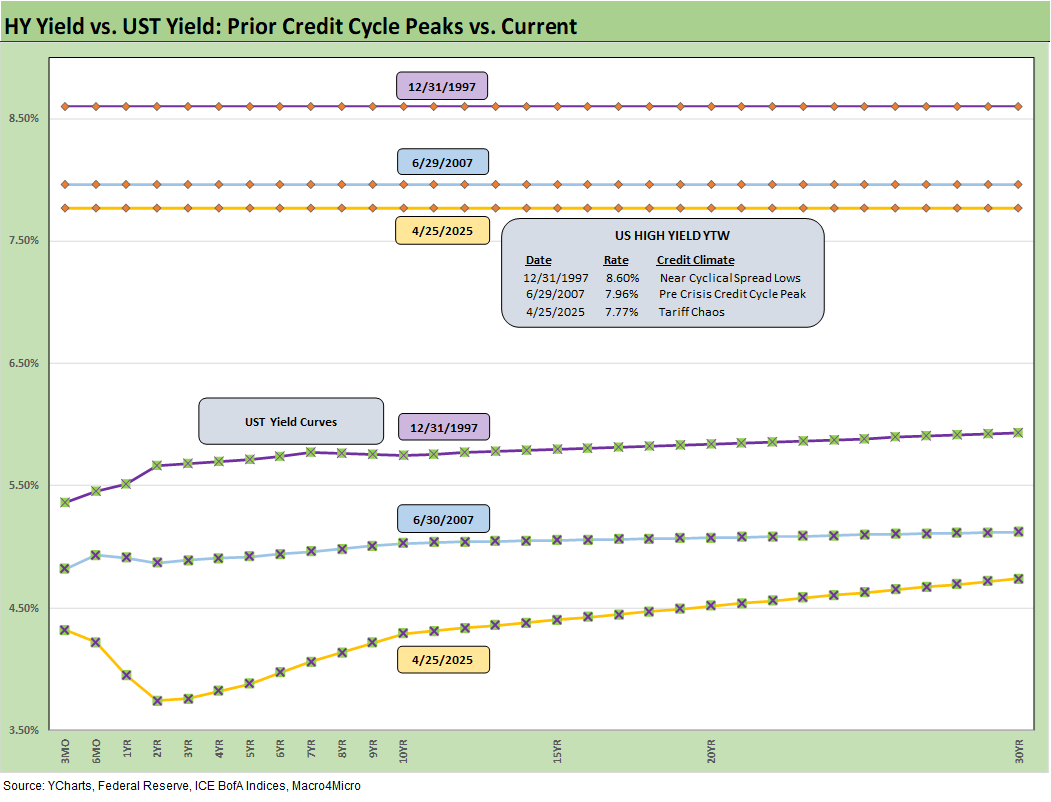
The final chart does the same 1997 and 2007 drill but for HY index yields. This week’s UST move leaves current HY index yields still in line with prior peak credit cycles at 7.77% vs. 7.96% in June 2007 and 8.60% in Dec 1997. The recent spread widening had moved HY index yields higher, but the past week spread rally and UST move lower left the current HY index YTW below both the 2007 peak and1997 HY index levels.
The widening early this month gave flashbacks to the volatility and major spread moves of the 1997-98 and 2007-08 periods that also posted triple-digit widening months. The sheer speed of risk repricing has happened in earlier cycles even if those moves were for very different reasons.
The challenge is identifying a fundamental transmission mechanism to more trouble for financial metrics and relative risks of default. Identifying a catalyst for pain now is easy with tariffs hitting the macro drivers (the consumer) and micro drivers (“buyer pays” hits margins or requires higher prices). The tariff shock is unprecedented in modern capital markets, but at least the banks are much healthier. We also see higher quality levels in the HY bond index as a starting point vs. 2007 and the late 1990s TMT bubble years.
Looking back even more, the turn in the credit cycle always comes at some point and often with an external trigger or “assist” that can set it off. During 1990, securities firms started to collapse including Drexel’s Chapter 11 in Feb 1990 and bridge loan related bailouts of Shearson Lehman, First Boston, and Kidder Peabody. We do not face that type of financial intermediary meltdown risk here (at least not yet!).
The summer of 2007 was the start of major problems in the credit markets with asset risk and leveraged counterparty exposure and bank/broker interconnectedness risk soaring. Despite that backdrop that worsened in August 2007, the equity markets and S&P 500 and NASDAQ kept on rallying into Oct 2007. Later in the turmoil and well after the fact, the start of the recession was tagged as Dec 2007 (see Business Cycles: The Recession Dating Game 10-10-22).
The 2007 experience reminded the market that credit leads the cycle and equity lags. The same was true in 1999 with the HY default cycle underway and NASDAQ at +86% that year. This time around, the credit markets did not expect the tariff insanity and is still making up its mind. The real economic effects are more geared to the periods ahead in 2Q25 and 3Q25 when tariffs will be registered at the transaction level. That will be the reality point. We expect HY to stay unhappy and spreads to average wider as the tariffs roll into actual corporate fundamentals.
See also:
Footnotes & Flashbacks: State of Yields 4-27-25
Footnotes & Flashbacks: Asset Returns 4-27-25
Mini Market Lookback: Earnings Season Painkiller 4-26-25
Existing Home Sales March 2025: Inventory and Prices Higher, Sales Lower 4-24-25
Durable Goods March 2025: Boeing Masking Some Mixed Results 4-24-25
Equipment Rentals: Pocket of Optimism? 4-24-25
Credit Snapshot: Herc Holdings (HRI) 4-23-25
New Home Sales March 2025: A Good News Sighting? 4-23-25
Footnotes & Flashbacks: Credit Markets 4-21-25
Footnotes & Flashbacks: State of Yields 4-20-25
Footnotes & Flashbacks: Asset Returns 4-20-25
Mini Market Lookback: The Powell Factor 4-19-25
Ships, Fees, Freight & Logistics Pain: More Inflation? 4-18-25
Home Starts Mar 2025: Weak Single Family Numbers 4-17-25
Credit Snapshot: Service Corp International (SCI) 4-16-25
Retail Sales Mar25: Last Hurrah? 4-16-25
Industrial Production Mar 2025: Capacity Utilization, Pregame 4-16-25
Credit Snapshot: Iron Mountain (IRM) 4-14-25
Footnotes & Flashbacks: Credit Markets 4-13-25
Footnotes & Flashbacks: State of Yields 4-13-25
Footnotes & Flashbacks: Asset Returns 4-12-25
Mini Market Lookback: Trade’s Big Bang 4-12-25
Tariffs, Pauses, and Piling On: Helter Skelter 4-11-25
CPI March 2025: Fodder for Spin 4-10-25
Credit Snapshot: Avis Budget Group (CAR) 4-9-25
Payroll March 2025: Last Call for Good News? 4-4-25
Payrolls Mar 2025: Into the Weeds 4-4-25
Credit Snapshot: AutoNation (AN) 4-4-25
JOLTS Feb 2025: The Test Starts in 2Q25 4-2-25
Credit Snapshot: United Rentals (URI) 4-1-25
 |
|