Footnotes & Flashbacks: Asset Returns 5-4-25
We look at asset returns with another week of healthy stock performances and weak bond ETFs on the curve move.
This next part could get tricky whether higher or lower.
The market sentiment remains fragile even if on hold waiting for higher or lower tariffs and anything resembling progress so they can better frame the risk variables. The more days go by, the more quickly stockpiles and inventories get run down with ships not arriving/unloading.
The swings in the UST curve around headlines continued this past week with favorable jobs and a mixed 1Q25 GDP with good and bad news despite the headline negative of -0.3%. The PCE price index was favorable for the inflation story while the Income and Outlays part of the release showed a resilient propensity for consumers to consume for the month (see Payrolls April 2025: Into the Weeds 5-2-25, Payroll April 2025: Moods and Time Horizons 5-2-25, PCE March 2025: Personal Income and Outlays 4-30-25).
The pre-tariff spike in imports and negative hit to GDP of -5.0% for imports comes with a massive inventory build. That keeps some critical questions above the fray for now as transaction level impacts flow into business costs and consumer prices. The +2.25% increase in GDP from inventory will give way to liquidation in 2Q25 if the trade clash does not subside (see 1Q25 GDP Advance Estimate: Roll Your Own Distortions 4-30-25, 1Q25 GDP: Into the Investment Weeds 4-30-25).
In the end, the lack of guidance from so many companies in an otherwise good earnings season is the confirmation of the tariff risk. Uncertainty is a short walk to risk aversion on household consumption and capital budgeting if the final decisions are bad for consumer and business economics.
The above chart updates the time horizon returns for the high-level debt and equity benchmarks we watch. For the 1-month time horizon, the rally in equities off the reciprocal tariff beatdown had the reverse effect on the UST market with 3 of 4 benchmarks above in the red and HY barely positive on the spread rally. The rolling 3-months still show bonds all positive with equities still in ugly mode.
For all the headlines on the equity recovery since the post-Liberation Day tanking, the measurement period above still captures a slice of the initial shock in the 1-month period. The 3-months is negative, the 6-months has only one very slightly positive line with Russell 3000 Growth, so it has been a rough stretch for equity repricing.
The rolling return visual
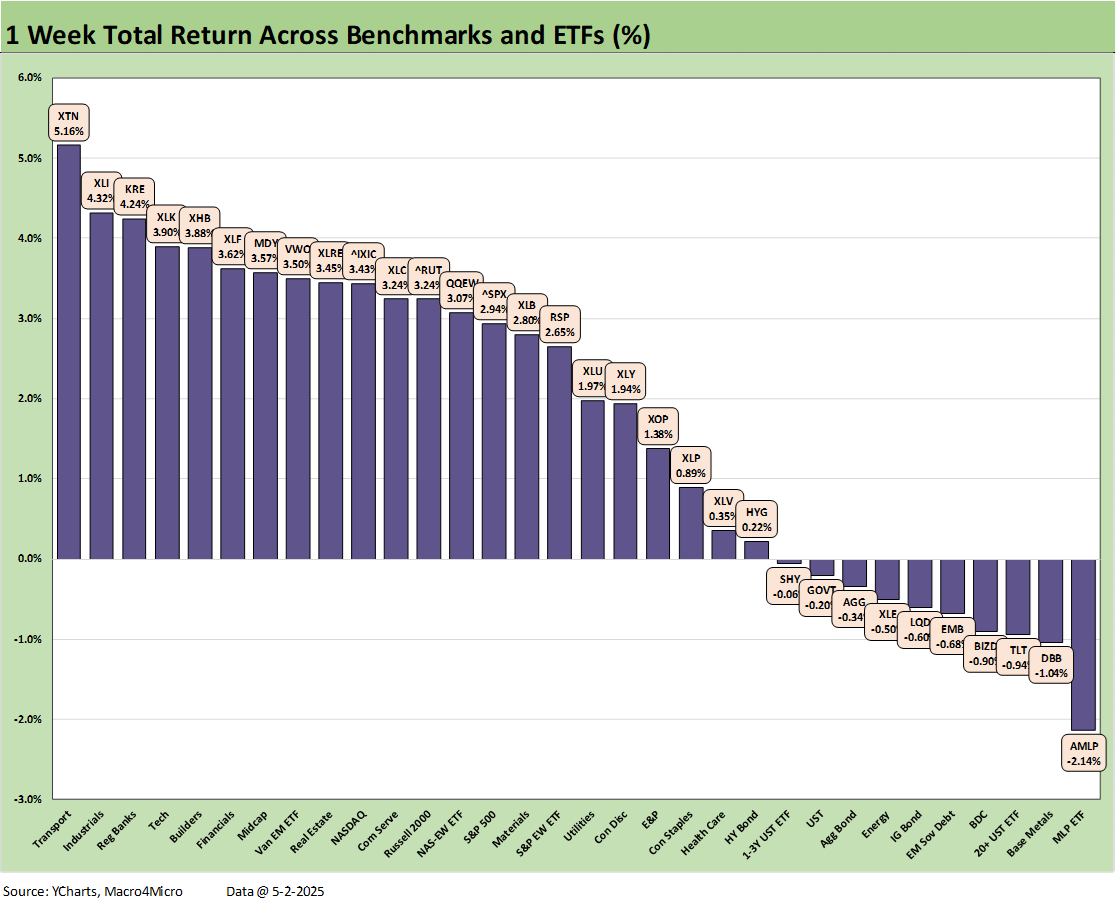
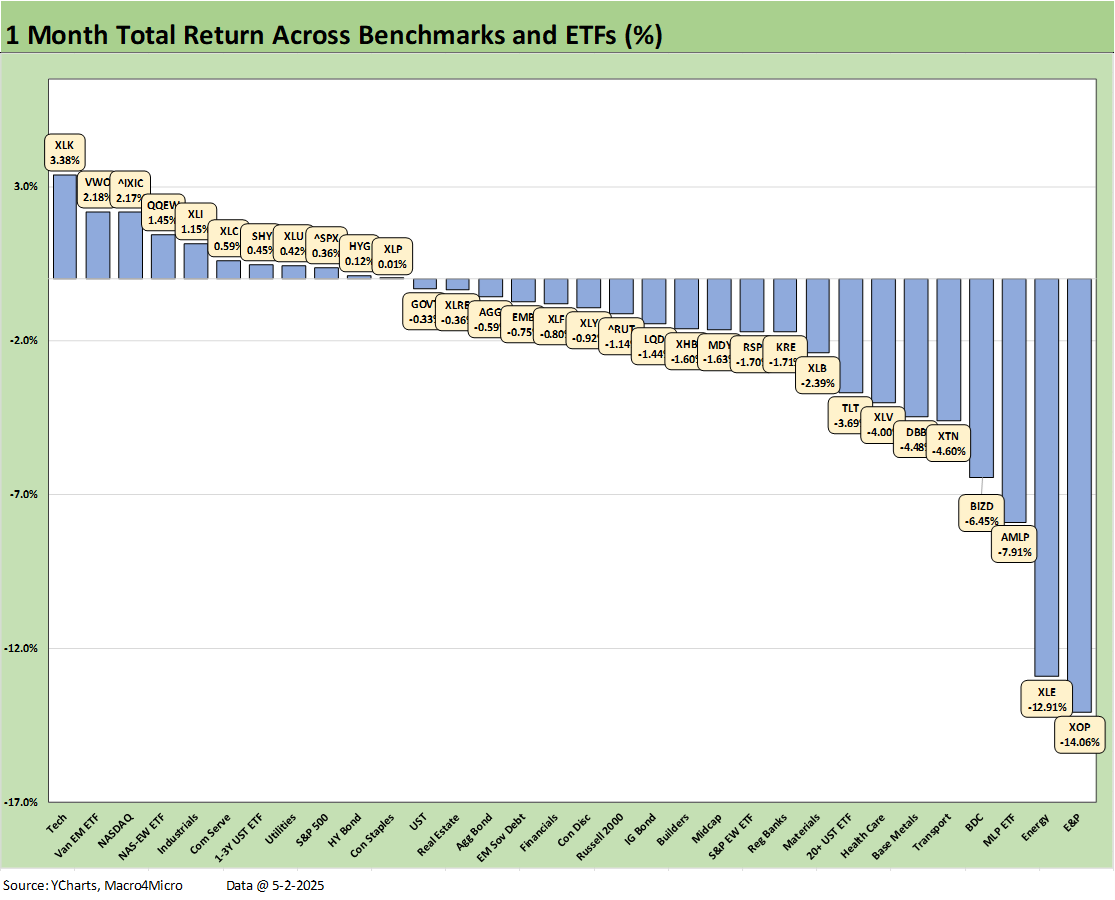
In the next section, we get into the details of the 32 ETFs and benchmarks for a mix of the trailing periods. Below we offer a condensed 4-chart view for an easy visual on how the mix of positive vs. negative returns shape up. This is a useful exercise we do each week looking for signals across industry groups and asset classes.
The symmetry of positive and negative keeps reshaping week by week, but the negative trend has been clear as we wade into 2025. The 1-month and 3-months are self-evident. The strength of 2024 will take a while to chip away at as we cover below. We also detail a YTD chart below (not shown above) which is more balanced after the recent rally, but the broad market benchmarks are all in the red YTD across the S&P 500, the NASDAQ, Midcaps, and Russell 2000.
The biggest line items by market cap reflect the scale of the challenge right now with tariff chaos hanging over the markets and in need of some relative policy coherence and specifics. We are now just getting started on pharma (a guaranteed trade war with Europe if Trump pulls that lever) and semiconductors still a strange work-in-progress disaster waiting to happen.
The good news is that Trump makes tariffs “permanent and not negotiable,” until they are up for immediate negotiation, pauses, and revisions. That makes capital budget planning and assessing project economics somewhat of a challenge, especially with all the tariffs on materials used in construction and the higher costs those bring (see Construction: Singing the Blues or Tuning Up for Reshoring? 5-1-25).
The Magnificent 7 heavy ETFs…
Some of the benchmarks and industry ETFs we include have issuer concentration elements that leave them wagged by a few names. When looking across some of the bellwether industry and subsector ETFs in the rankings, it is good to keep in mind which narrow ETFs (vs. broad market benchmarks) get wagged more by the “Magnificent 7” including Consumer Discretionary (XLY) with Amazon and Tesla, Tech (XLK) with Microsoft, Apple, and NVIDIA, and Communications Services (XLC) with Alphabet and Meta.
We look at the tech bellwether performance for the week in Mini Market Lookback: Inflated Worry or Slow Train Wreck? (5-3-25). Earnings season was mixed to date for the Mag 7 earnings reactions with Microsoft and Meta big winners and Apple getting smacked this week as the only 1-week negative above. As a reminder, we line the above up in descending order of total returns for 1-week. Looking back over 3-months, we see 6 of the Mag 7 in the red and 4 of 7 negative over 6-months.
We already detailed the 1-week numbers in Mini Market Lookback: Inflated Worry or Slow Train Wreck? (5-3-25). The score of 22-10 saw 6 of the bond ETFs in the red with HY (HYG) just across the line at the bottom of the positive ranks. Transports (XTN) jumped to #1 on trade hopes but is dead last YTD and 3 off the bottom for the trailing 1-year just ahead of Energy (XLE) and the beaten down E&P sector (XOP) that we detail further below. We see a healthy diversified mix of industries and benchmarks in the top quartile above.
The 1-month timeline is still looking sick at 11-21 with bond ETFs to be found in each quartile with the short duration UST 1Y-3Y ETF (SHY) in the top quartile and the long duration UST 20+Y ETF (TLT) in the bottom quartile. We highlight that the NASDAQ made the top quartile with an unimpressive +2.17% in the #3 spot behind the Tech ETF (XLK) at #1 and EM Equities (VWO) at #2. The S&P 500 was in the second quartile while the Russell 2000 and Midcaps were in the third quartile.
Energy is holding down the bottom 3 position with E&P (XOP) at -14.1% and sitting on the bottom with Energy (XLE) just behind it at -12.9%. Oil prices have taken a beating on weak economic outlooks for demand and OPEC supply issues. That is even before the Russian supply wildcard gets fully worked out ahead. Trump is ramping up pressure on Iran but any incentive that China might have had to play ball on Iran has diminished with the trade war.
The 3-months scoresheet is the same as 1-month at 11-21. We see 7 of the 11 positive returns are bond ETFs. We see EM Equities (VWO) at #1 despite the trade wars and the defensive Consumer Staples (XLP) at #2 and Utilities (XLU) at #3. Rounding out the non-bond ETFs was Real Estate (XLRE) at #5 with a paltry +1.87% as income stocks got some support.
We see the Russell 2000 (RUT) and Midcaps (MDY) in the bottom quartile with NASDAQ (IXIC) edging across the line into the 3rd quartile joined by the S&P 500 (SPX). We see no tech-centric Mag 7 heavy ETFs or benchmarks in the top two quartiles.
YTD returns are more balanced at 17-15 but the 4 major benchmarks are negative for the S&P 500, NASDAQ, Midcap S&P 400 ETF (MDY), and small cap Russell 2000 (RUT). The top performers cut across defensive exposures (XLU, XLP) and rate-sensitive or income-oriented industries (XLRE, XLF, AMLP).
Transports (XTN) and E&P (XOP) took a beating with tech-oriented ETFs and benchmarks sprinkled across the bottom quartile with NASDAQ and XLK. Homebuilders (XHB) felt the stubborn mortgage rate backdrop and a clear demonstration in 4Q24 and 1Q25 earnings season of margin pressure and order weakness.
The 1-year return numbers still look good at 26-6 after a great run in 2024-2025. They are not the typical 30’ish positive often seen, but fond memories keep the “buy the dip” crowd in the game as they await tariff clarity.
Oil prices have been crushed on dimming outlook for the US and global economy as Trump ironically takes credit for lower oil (a rare time he has been factual of late, but for the wrong reason). With the E&P ETF (XOP) seeing oil around $59 WTI, the prices are in a range that does not inspire drill, drill, drill by the US E&P sector.
Russian and Iranian oil supply will be a geopolitical wildcard ahead as well. Asian demand is a key swing factor. On a supply note, the purchasers of Iranian oil are running out of incentives to play ball with Trump given his trade war tactics. You could even say the same about Europe and sanction enforcement. Eventually, you need some allies who are treated like allies. Or you need to be able to issue threats on tariffs that have not already been issued.
See also:
Mini Market Lookback: Inflated Worry or Slow Train Wreck? 5-3-25
Payrolls April 2025: Into the Weeds 5-2-25
Payroll April 2025: Moods and Time Horizons 5-2-25
Construction: Singing the Blues or Tuning Up for Reshoring? 5-1-25
Employment Cost Index 1Q25: Labor is Not the Main Worry 5-1-25
1Q25 GDP: Into the Investment Weeds 4-30-25
PCE March 2025: Personal Income and Outlays 4-30-25
1Q25 GDP Advance Estimate: Roll Your Own Distortions 4-30-25
JOLTS Mar 2025: No News is Good News 4-29-25
Tariffs: Amazon and Canada Add to the Drama 4-29-25
Credit Snapshot: D.R. Horton (DHI) 4-28-25
Footnotes & Flashbacks: Credit Markets 4-28-25
Footnotes & Flashbacks: State of Yields 4-27-25
Footnotes & Flashbacks: Asset Returns 4-27-25
Mini Market Lookback: Earnings Season Painkiller 4-26-25
Existing Home Sales March 2025: Inventory and Prices Higher, Sales Lower 4-24-25
Durable Goods March 2025: Boeing Masking Some Mixed Results 4-24-25
Equipment Rentals: Pocket of Optimism? 4-24-25
Credit Snapshot: Herc Holdings (HRI) 4-23-25
New Home Sales March 2025: A Good News Sighting? 4-23-25
Mini Market Lookback: The Powell Factor 4-19-25
Ships, Fees, Freight & Logistics Pain: More Inflation? 4-18-25
Home Starts Mar 2025: Weak Single Family Numbers 4-17-25
Credit Snapshot: Service Corp International (SCI) 4-16-25
Retail Sales Mar25: Last Hurrah? 4-16-25
Industrial Production Mar 2025: Capacity Utilization, Pregame 4-16-25
Credit Snapshot: Iron Mountain (IRM) 4-14-25
Mini Market Lookback: Trade’s Big Bang 4-12-25
Tariffs, Pauses, and Piling On: Helter Skelter 4-11-25
CPI March 2025: Fodder for Spin 4-10-25
Credit Snapshot: Avis Budget Group (CAR) 4-9-25


