
Footnotes & Flashbacks: State of Yields 9-15-24
We update the UST curve action ahead of an important week that will bring the first move by the FOMC since July 2023.


Lessons from the Exorcist… slower is better on the steps.
After a very mild bull steepener on the week, the table is set for the front-end inversion to start a slow move towards a flattening from 3M out the curve as the FOMC’s fed funds anchor tweaks short UST rates.
The Freddie Mac 30Y benchmark notched down to 6.20% for the Thursday update with 30Y mortgages edging down some more on Friday as the 10Y UST and 30Y mortgage are well off the highs (see A Strange Policy Risk Week: Mini Market Lookback 9-14-24).
The time horizon returns on bond benchmarks and bond ETFs have been favorable for fixed income allocation strategies with duration returns playing catchup in recent months (see Footnotes & Flashbacks: Asset Returns 9-15-24).
We update the 2Y to 30Y slope as we start to creep closer to what can be called a normalization process from the 2Y UST out the curve.
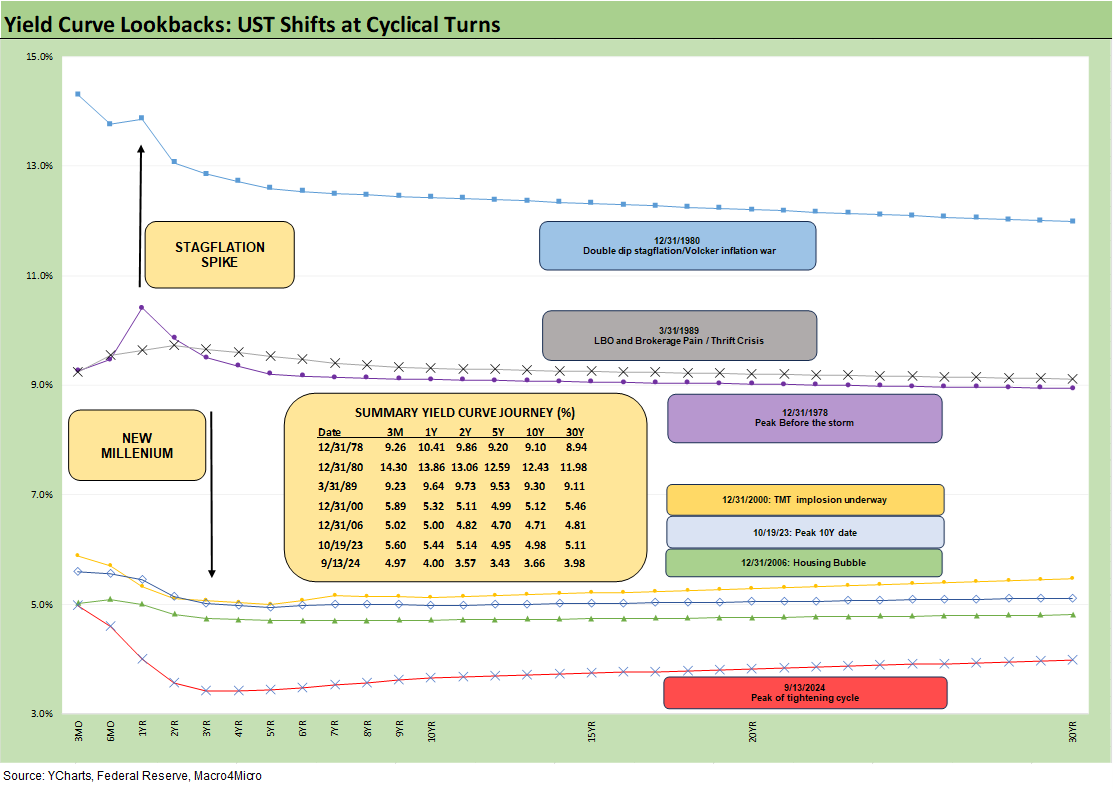
The above chart updates the UST curve across the cycle from the 1978 Carter inversion around the cyclical peak and then across cycles where the Fed was not in ZIRP mode or just coming out of ZIRP/QE periods with normalization moves. In other words, we frame current levels vs. pre-crisis periods.
The easy takeaway is that the current UST curve is extremely low by historical standards as you move beyond the short end with its Fed-driven inversion. When Trump says he will cut interest rates in half, he might want to cite which part of the UST curve he is referring to. The FOMC can take rates meaningfully lower, but good luck getting the 10Y UST down to 2.0% without a recession.
The FOMC could see a GOP White House seek to take control of fed funds rate setting as Trump has been discussing. That will create an interesting interplay with inflation fears tied to tariffs and a White House driven monetary policy to ease on the front end. The markets would certainly react to that.
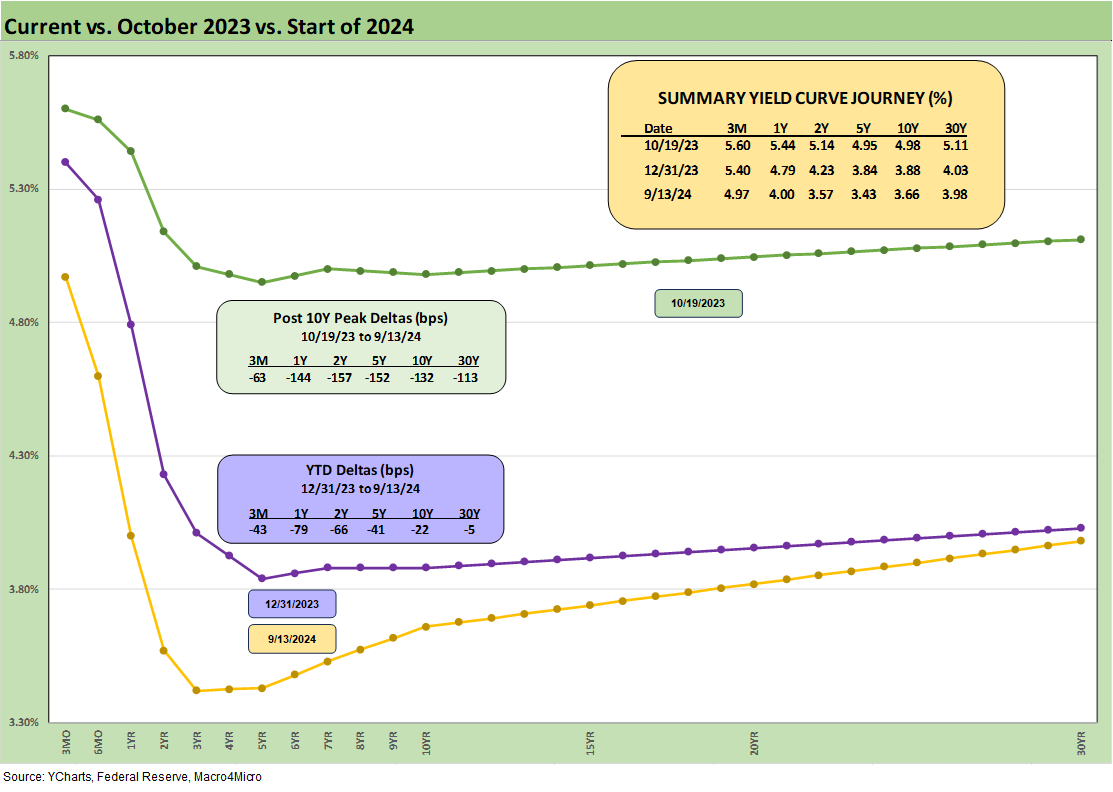
The above chart updates the UST deltas from the 10-19-23 peak in the UST 10Y and from the start of the year. We include the curves for each date and the running deltas in the box along with the actual rates in the top box.
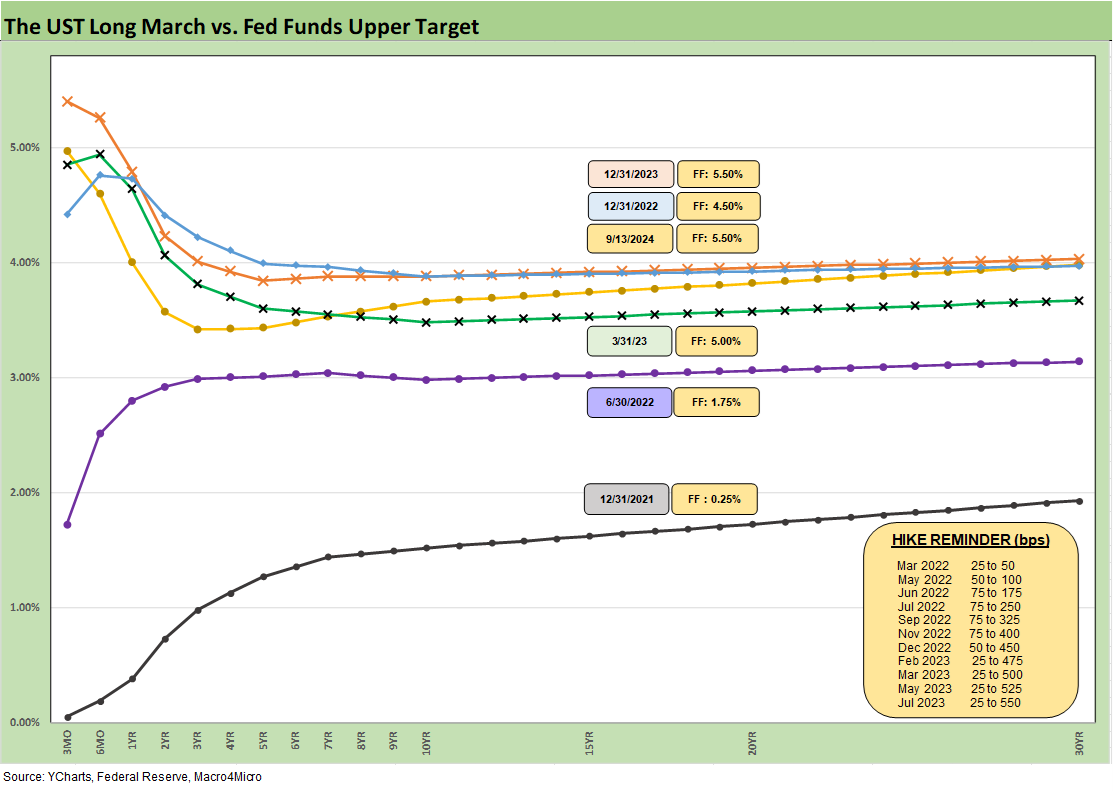
The above chart plots some notable UST curve dates since 12-31-21 through the tightening cycle. We also include a “memory box” detailing the tightening actions along the timeline from the end of ZIRP in March 2022.
When the 10Y UST rates converged for the 12-31-22 and 12-31-23 dates despite the 100 bps differential in fed funds, the natural question was around how much the 10Y UST would move in the event of fed easing. We will start seeing some answers to that question.
Will we see a bull steepening with modest movement from here in 10Y or see more of a bull UST market tied to a downward shift, a flattening from 3M, or a steepening with the entire curve lower? We expect more of a steepening with the 10Y UST more restrained. All bets are off if we see the scale of tariffs under consideration in the Trump plan in 2025.
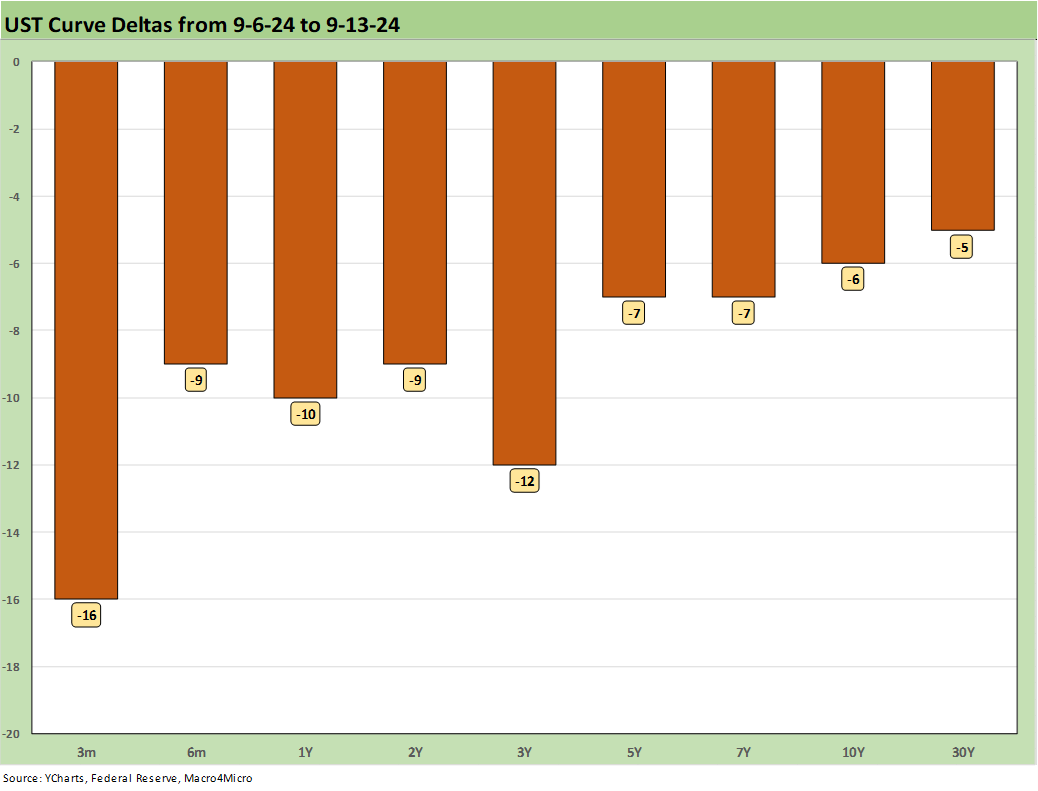
The above chart frames a visual on the UST deltas this past week as we see another favorable move for duration but less pronounced than the prior week. With a cut of -25 or -50 bps expected from the FOMC this coming week, the handicapping exercise is what impact the FOMC will have along the UST curve and how the new dot plot shapes perceptions. We expect -25 bps.
For the broader fixed income corporate markets, liability management planning will be a hot topic in corporate huddles around refinancing and extension. Meanwhile, the IG and HY spread analysis will consider what this will mean for asset allocation and the willingness of investors to move out along the curve, take more credit risk in BBs and lower, or take more duration risk and credit risk out the curve.
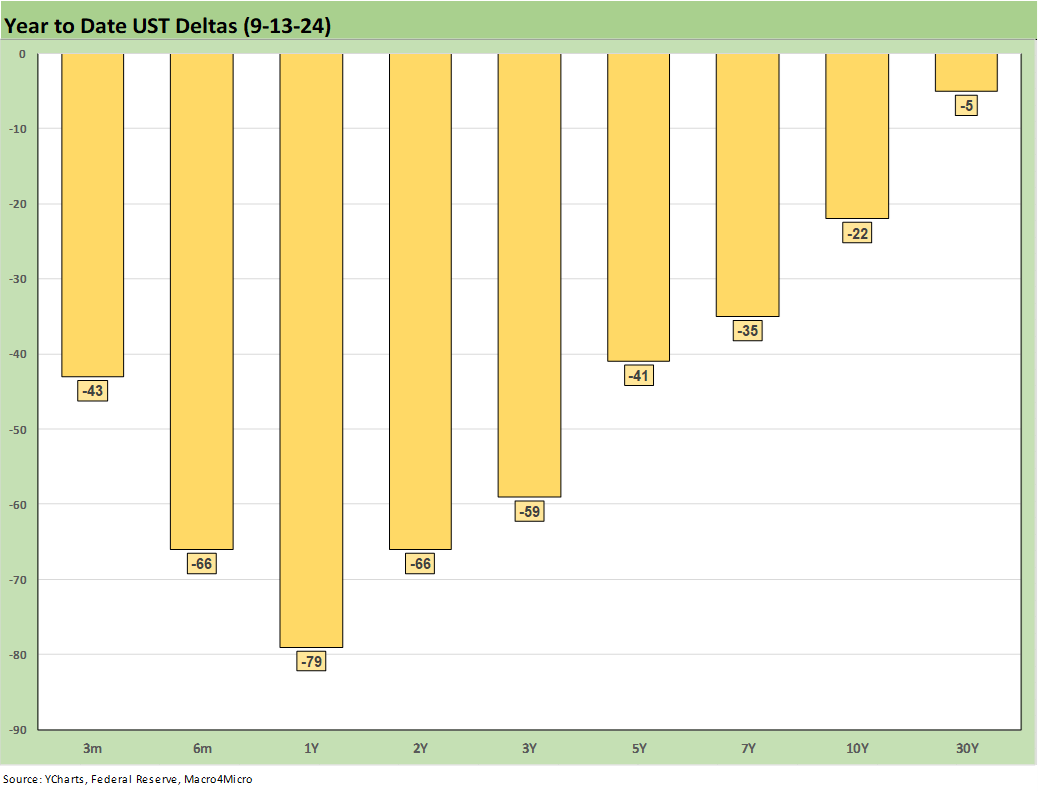
The above chart offers a different angle on the YTD UST deltas and the pronounced bull steepener from 1Y and 2Y out to 30Y. We look at the various return performances in the related Footnotes Asset Returns publication (see Footnotes & Flashbacks: Asset Returns 9-15-24). For YTD returns, we see EM Sovereigns (EMB) beating HY (HYG) in the group of 7 bond ETFs with IG Corporates (LQD) at #3 of the 7 bond ETFs with AGG, GOVT, TLT and SHY trailing in the return rankings.
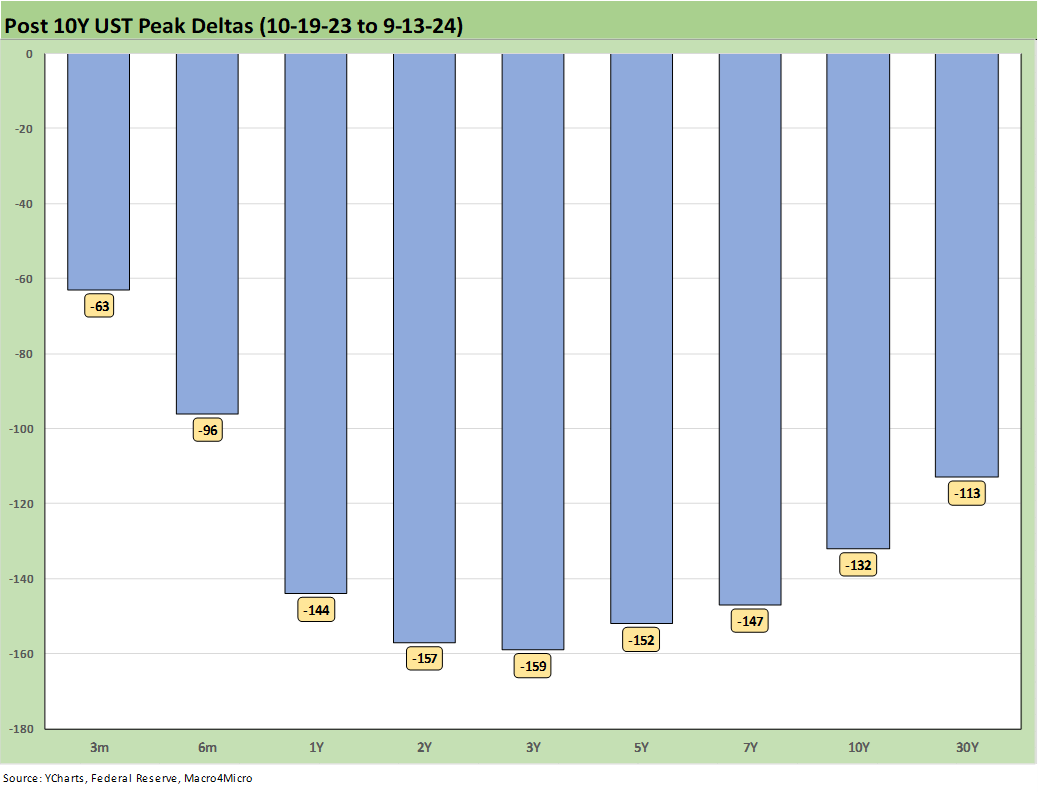
The above chart shows the running UST deltas from the 10-19-23 peak date for the 10Y UST. The time horizon includes the very impressive rally in duration and equity returns during Nov-Dec 2023 (see Footnotes & Flashbacks: Asset Returns 1-1-24, Footnotes & Flashbacks: Asset Returns 12-3-23). For the LTM time horizon, we see stronger returns than the YTD 2024 chart but the same order in the Top 3 with EMB #1 in the bond ETF returns at +15.5%, HYG #2 at +13.1% and LQD #3 at +13.0%.
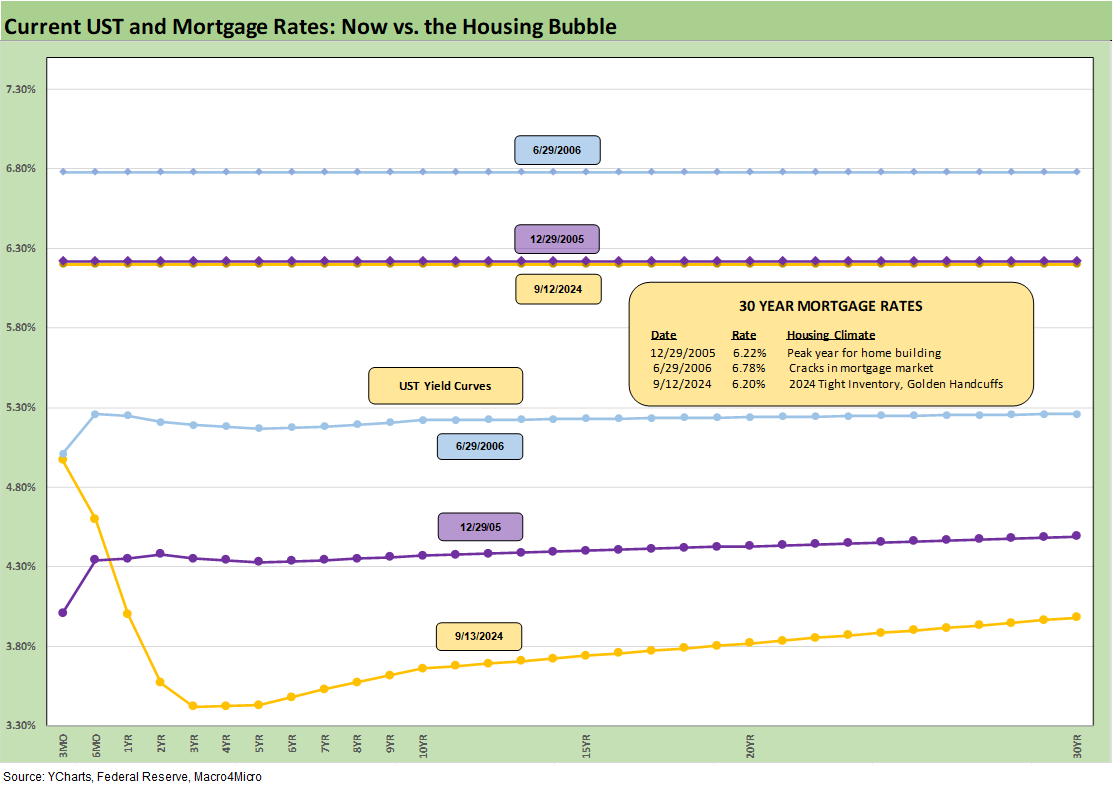
The above chart updates the Freddie Mac 30Y mortgage benchmark on the horizontal line (comes out each Thursday) as of this past week and for the end of 2005 (peak homebuilding year during the housing bubble) and for mid-2006 (RMBS starting to show material risks). We then add the UST curves for each of those dates.
The UST curve as of now is in a different zip code at a much lower 10Y UST and presents a radically different shape. The current Freddie 30Y mortgage rate edged down under that posted at the end of 2005 and is more materially below mid-2006. The UST is the key driver.
The steep inversion is way out of line in this history. All of these markets were in periods of high-risk appetites, but 2005-2006 marked a period of easy credit and a very different backdrop as to what constitutes sticker shock on rates with today’s markets still having 3% and 4% mortgage rates in their memory in a ZIRP world. Home prices are also materially higher today but with a demand imbalance and higher quality mortgage assets with substantial home equity. Something has to give, and it needs to be mortgage rates.
The 6.2% mortgage rate can drive a lot of demand in the new home market if builders keep using the mortgage buydowns and fee incentives, but these rates are not low enough to drive a high volume of existing home sales inventory unless more sellers capitulate on price. We will see how this plays out in the coming months for the all-in mortgage rate as well as existing home sales prices and builder incentives.
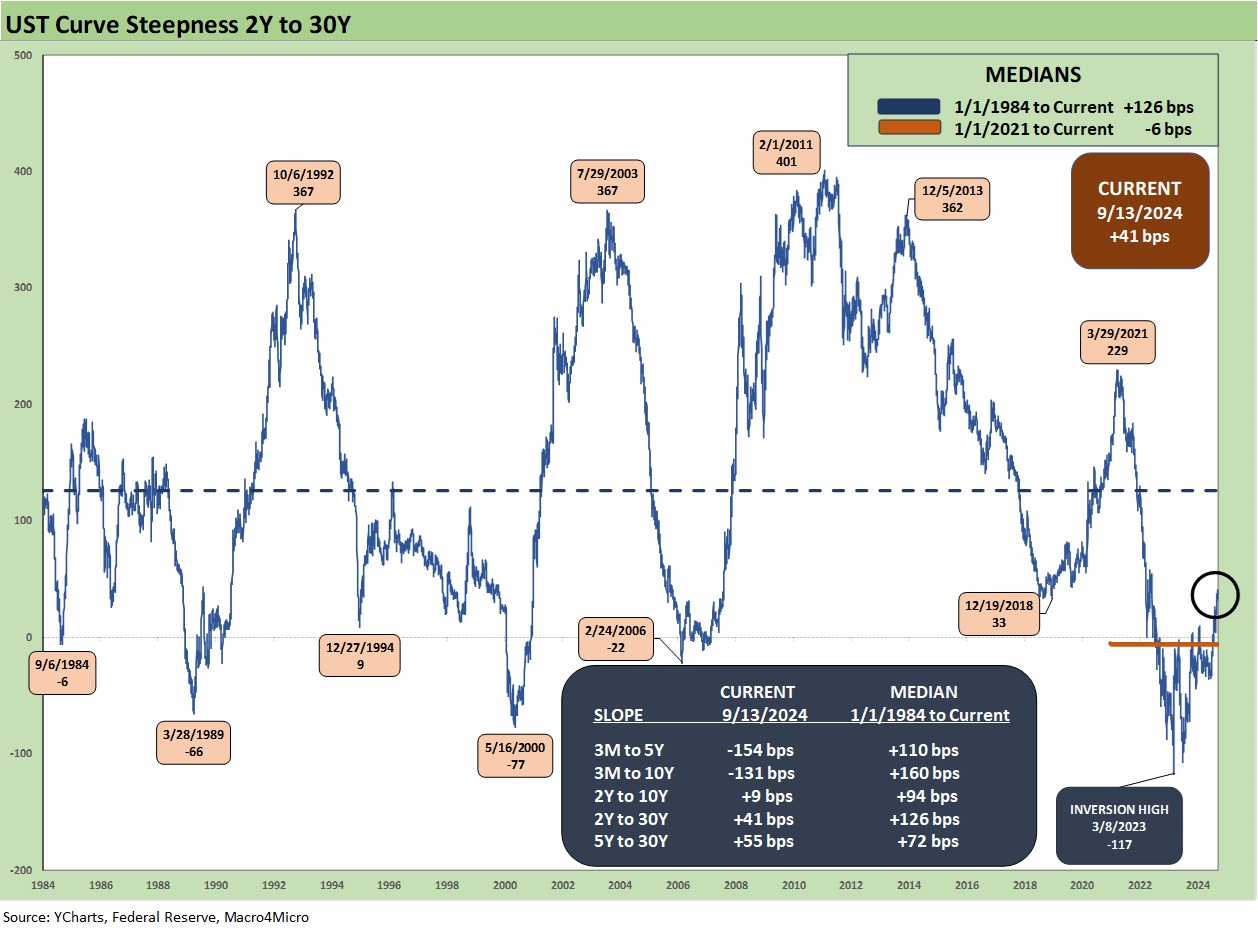
The above chart updates the long-term 2Y to 30Y UST slope, where we now see +41 bps slope. Three of the five UST segment slopes that we watch are now upward sloping. It is no coincidence those start at 2Y UST, where the market has better control of rates with the Fed controlling the short end via fed funds and thus the 3M UST and cash returns. We are still well below the long-term post-1984 median of +126 bps for 2Y to 30Y as noted in the box embedded in the chart.
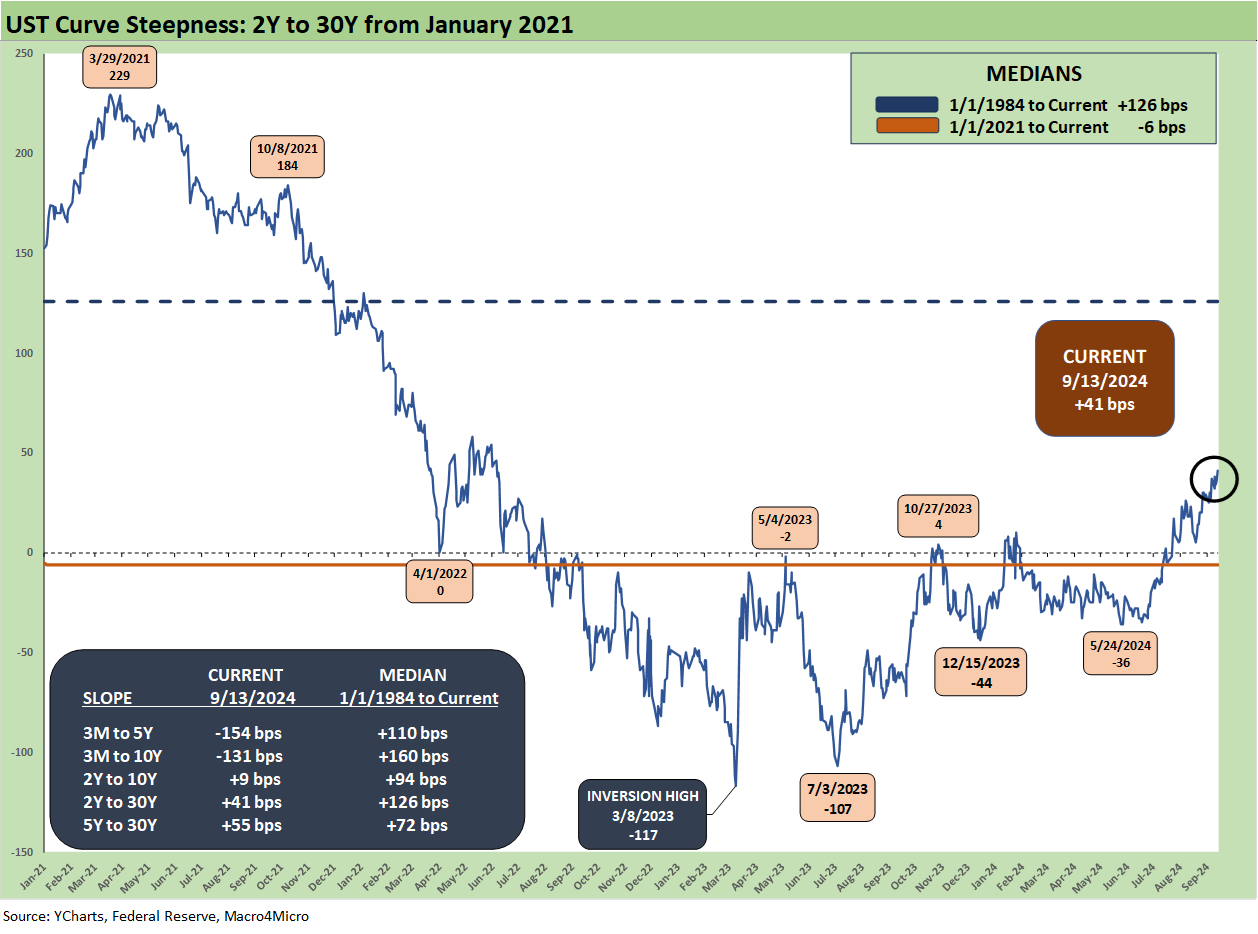
The above chart shortens up the timeline starting from the beginning of 2021 and ZIRP for a more granular view of the ride across the tightening cycle. The peak slope was +229 bps back in March 2021 before the journey to the -117 bps inversion in March 2023.
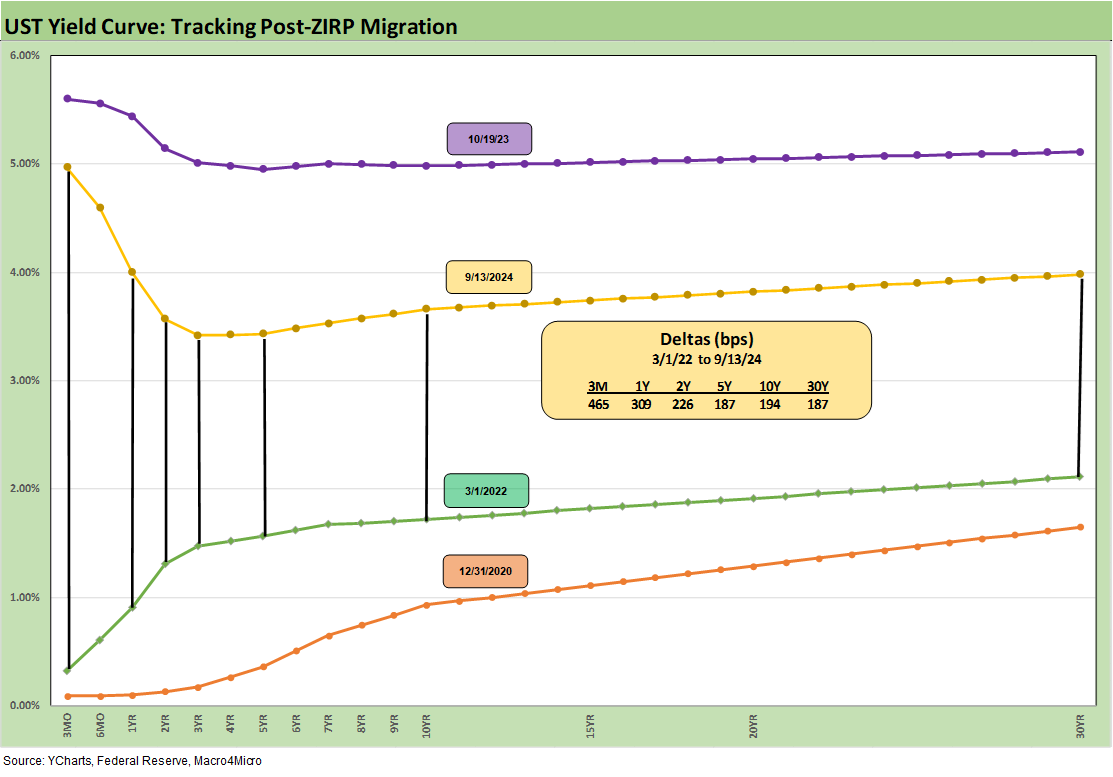
The wrap-up chart plots the UST deltas from the start of March 2022. We also include a 12-31-20 UST curve as a frame of reference and plot the UST curve as of the 10-19-23 peak 10Y UST. The Fed will start whittling down on that +465 bps move on 3M UST, and a major variable for mortgages will be how much that +194 bps move in 10Y UST will move along with the short end moving lower.
The FOMC meeting and dot plot will be very interesting this time since you cannot help but wonder how the FOMC thinks about inflation risk and whether Powell will field questions on how massive tariffs were considered in forecasts (or not). We would expect “transitory” would not be a word used in discussing tariffs. We also assume the FOMC knows that the “buyer pays” in apparently contrast to what we hear from trade policy architects and the Trump team. That press conference should be interesting. Failure to discuss the election policy risks or tariffs will be interesting by itself.
See also:
Footnotes & Flashbacks: Asset Returns 9-15-24
A Strange Policy Risk Week: Mini Market Lookback 9-14-24
Consumer Sentiment: Inflation Optimism? Split Moods 9-13-24
CPI Aug 2024: Steady Trend Supports Mandate Shift 9-11-24
Facts Matter: China Syndrome on Trade 9-10-24
Tariffs: Questions that Won’t Get Asked by Debate Moderators 9-10-24
Footnotes & Flashbacks: Credit Markets 9-9-24
Footnotes & Flashbacks: State of Yields 9-8-24
Footnotes & Flashbacks: Asset Returns 9-7-24
Another Volatile Week: Mini Market Lookback 9-7-24
August 2024 Payrolls: Slow Burn, Negative Revisions 9-6-24
Trump's New Sovereign Wealth Fund: Tariff Dollars for a Funded Pool of Patronage? 9-5-24
Goods and Manufacturing: Fact Checking Job Rhetoric 9-5-24
JOLTS July 2024: Mixed Bag, Hires Up, Layoffs/Discharges Up, Quits Flat 9-4-24
Construction Spending: A Brief Pause? 9-3-24
Labor Day Weekend: Mini Market Lookback 9-2-24
PCE July 2024: Inflation, Income and Outlays 8-30-24
2Q24 GDP 2nd Estimate: The Power of 3 and Cutting 8-29-24
Harris Housing Plan: The South’s Gonna Do It Again!? 8-28-24
New Home Sales July 2024: To Get by with a Little Help from My Feds? 8-25-24
Payroll: A Little Context Music 8-22-24
All the President’s Stocks 8-21-24