
Footnotes & Flashbacks: Credit Markets 8-4-25
Signs of fragility in the labor market capped off a week of soft economic data, reigniting cyclical concerns.


Trump’s recruits for economic data jobs: spineless and flexible
Credit traded in a tight range through most of the week until the dismal payrolls number on Friday and subsequent firing of the BLS data head triggered a defensive shift on Friday. IG finished the week +4 bps and HY closed +29 bps wider, reversing most of the grind tighter seen across the past few weeks. The UST curve rallied hard in a sign of cyclical anxiety (see Footnotes & Flashbacks: Asset Returns 8-3-25, Footnotes & Flashbacks: State of Yields 8-3-25).
Material revisions to prior payroll data revealed the weakest three-month job growth stretch since COVID. GDP data also came in soft, particularly in consumer spending and fixed investment, while inflation pressures appear to be emerging in select categories. Even with the late week backup, HY remains near historically tight levels near 2018 lows. The January 2025 trough of +259 bps is still anchoring the market’s valuation lens that reminds us more of the June 2007 bubble (see Employment July 2025: Negative Revisions Make a Statement 8-1-25 , 2Q25 GDP: First Cut of Another Distorted Quarter 7-30-25).
With macro data relatively quiet ahead of the CPI release on Aug 12th, the market will have time to shift back to an earnings season that has been broadly supportive of relative stability looking backwards while guidance continues to evidence its share of ambiguity on what strategies will be pursed dealing with tariffs. After all, 3 of the 4 largest trading partners are not set – including the 2 largest trade partner nations (Mexico, Canada).
Tariffs are slowly flowing through the working capital cycles, and the unprecedented policy measures have already shown up across billions in costs and guidance revisions. Firing the BLS data casts doubt on major doubt on the future of data integrity for payrolls with BEA and inflation data not far behind on the political targeting list. The use of the usual “rigged” refrain from Trump could backfire in sentiment shift by calling into question the veracity of favorable or risk-mitigating reports(see Happiness is Doing Your Own Report Card 8-1-25).
Trump could have just said “the models suck and are unreliable.” Instead, he went for the “rigged theme” and his usual formulaic victimhood whining. The “rigged” part is an easily disproven theory of it being impossible. That is a case made for those who attention to facts, which includes a substantial majority of Trump’s target audience. Ellen Chao highlighted how absurd the “rigged” theme was today in an interview today in rigorous detail. She ran the Dept of Labor under Bush was and Secretary of Transportation under Trump. She used things some of us call “facts.”
Myriad economists who have not been neutered by Trump have also weighed in. Those looking under the hood on payroll response rates, survey quality questions (vs. “rigged” nonsense) and how the event risk of tariffs and deportation panics in labor flag that such factors are not helping flawed models hold up. Common sense says small businesses and tariff-impaired industries would put a hold on hiring. Some will downsize.
Below we update our rolling weekly credit markets commentary and spread recap. We already addressed a range of moving parts in our earlier posts over the weekend:
Footnotes & Flashbacks: State of Yields 8-3-25
Footnotes & Flashbacks: Asset Returns 8-3-25
Mini Market Lookback: Welcome To the New World of Data 8-2-25

The above chart updates the credit spread deltas for 1-week and 1-month, where Friday’s risk repricing drove most of the 1-week widening that left IG at +82 bps and HY at +313 bps. The late-week selloff followed the very soft July payrolls report and the highly politicized firing of the BLS data chief, shaking confidence in the integrity of labor data (see Employment July 2025: Negative Revisions Make a Statement 8-1-25, Happiness is Doing Your Own Report Card 8-1-25).
While the credit spread widening was modest in historical context, HY remains well below the 2014 lows and slightly below the 2018 cyclical lows. The current mix of risks do not seem to be well integrated into the market, and there is a of tariff adjustments and new Section 232 tariffs still ahead.
With inflation data steadily rolling out and institutional credibility under new pressure, volatility could pick back up as markets will have to reconsider both macro conditions and policy direction (More pauses on China? More retaliation risk? The FOMC at 25 or 50 bps in Sept, etc.).
On the fundamental side, earnings commentary has reinforced that tariff impacts are realities and that they carry real and immediate effects on the expense lines. The pricing reactions are “for later” in many industries. The next leg of the analysis is how forward-looking views fare as pricing strategies are “market tested” at sea level in the later summer and fall as economic releases and pricing data show up at a lag. That is when the tariff impact will rise back up into the inflation debate and Fed policy battles with September a critical meeting, especially after early signs of impact on labor data.
Tariffs remain a highly politicized topic and information focus often tapered to the needs of the parties debating the topic. We are most disturbed by the lack of focus on the small business sector fallout and how that rolls up to the macro level. Digging into small business trade groups – and notably small retailers – tells an uglier story. For now, markets have adopted a wait-and-see posture on inflation and Fed instability, showing muted response to trade headlines as reflected in the subdued reaction to the August 1 tariff rollouts.
For HY spreads, hovering near the low +300 level in HY has been a vote of confidence in the balanced overall credit picture and the better positioning in higher income, shorter duration assets during a period of UST uncertainty. The BB heavy weighting of the HY index has been supportive of returns as noted in the next chart.
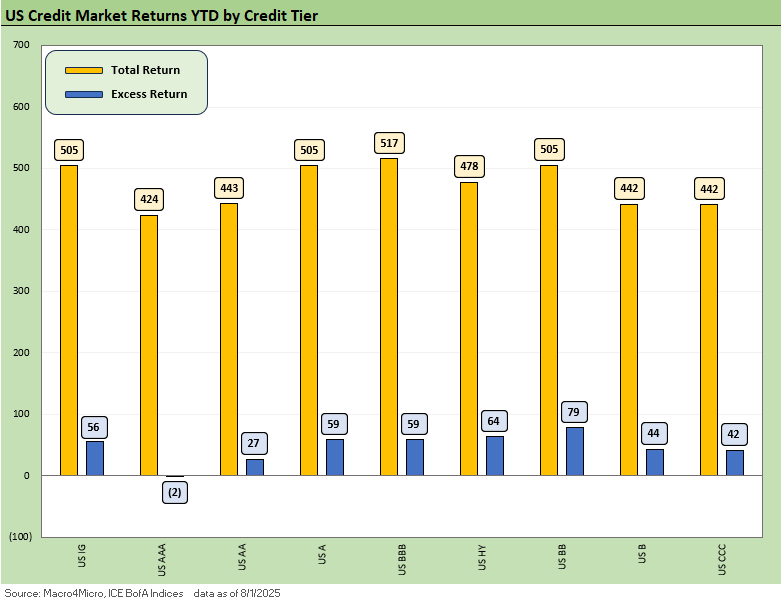
The above chart updates the YTD total return and excess return for IG and HY as well as the credit tiers. Excess returns are still not impressive with little upside potential from spread compression, but IG and HY are at least solidly positive at this point. New issues in HY also have the “coupon edge” for income seekers. A 7.15% composite HY YTW tells a favorable story of cash income in new issue flows and refi-and-extension actions. The current composite HY coupon is 6.56%. There is a wide range of coupons in the post-ZIRP world, so new issues in HY hold a lot of allure.
Total returns show the benefits of the modest bull steepener that has supported the short to intermediate UST curve segment (see Footnotes & Flashbacks: State of Yields 8-3-25). That duration angle can support the trade-off along the BBB/BB divide for the now well-established HY Light strategy.
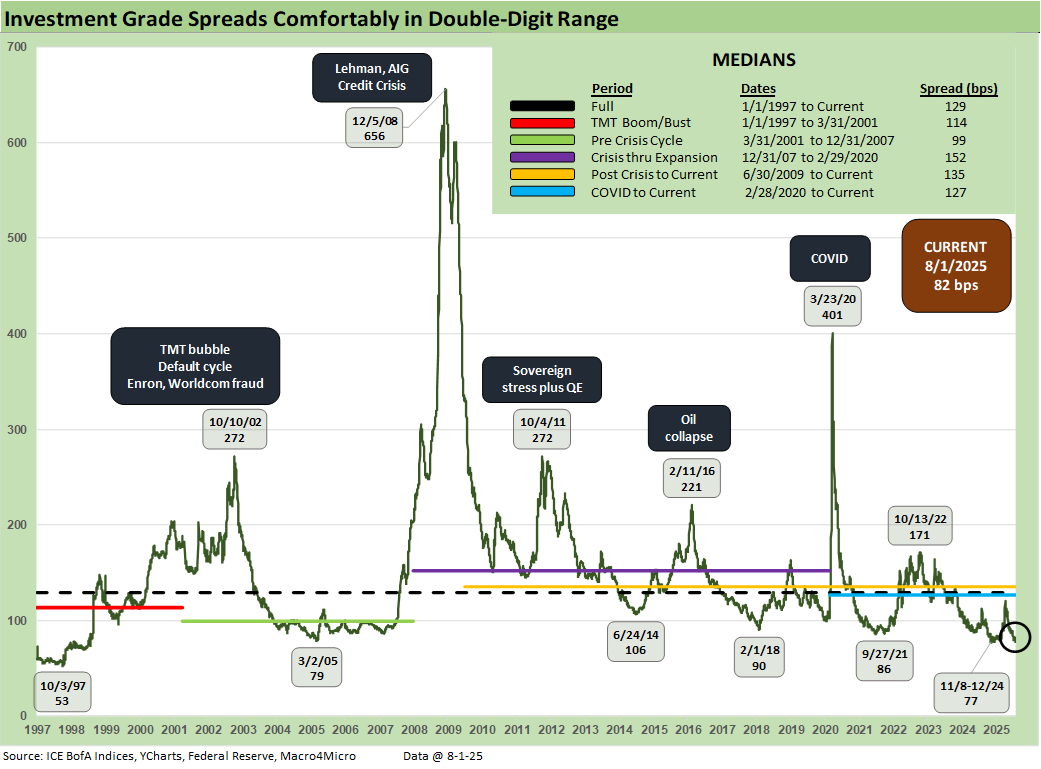
The double-digit IG spreads at +82 bps remain near prior cyclical lows and still just above the 4Q24 lows of +77 bps. The long-term IG OAS median of +129 bps leaves a lot of room for some widening and drives home how this market is priced in a rarefied spread range. With a 4.94% yield offered by the IG index, current coupon new issues whether “new money” or refinancing low coupon bonds bring a very solid base of demand after years of ZIRP and normalization coupon levels in portfolios. Income is back in the picture this credit cycle.
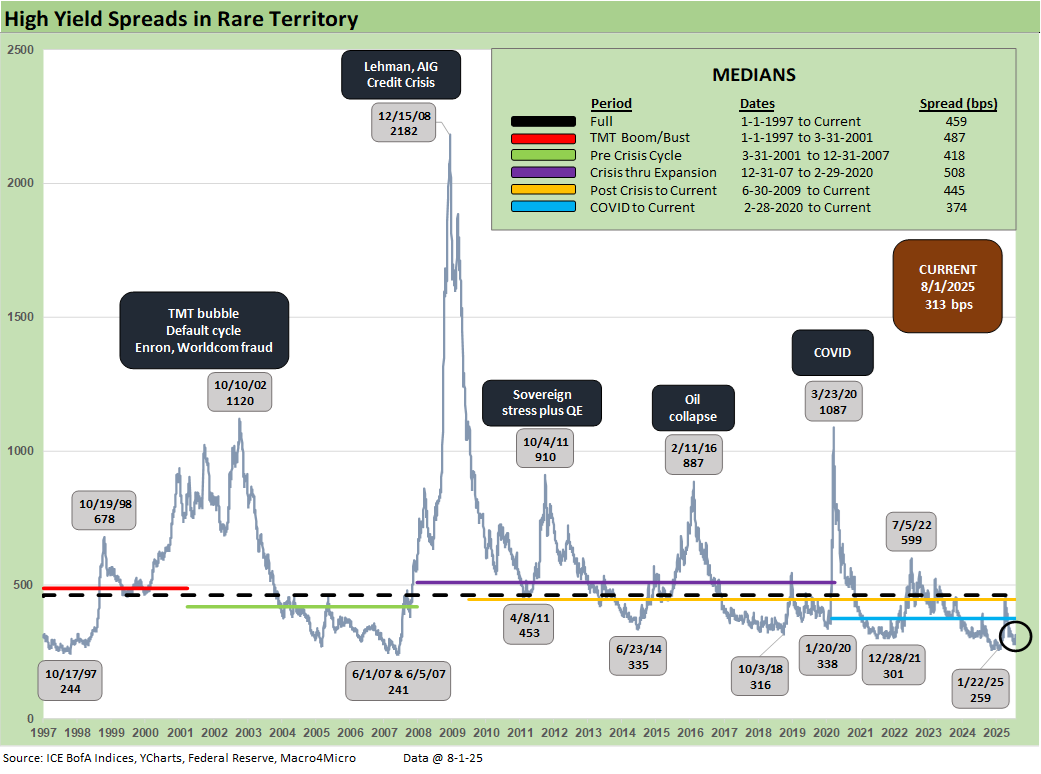
HY spreads widened +29 bps to +313 bps, and HY OAS remains in rare territory, still below the 2014 and 2018 lows and Jan 2020 lows. We see the 2018 period as a key comparison given the tariff backdrop running in parallel with the Dec 2017 tax bill. That did not end well the first time with very poor asset returns in 2018 before Powell and the FOMC needed to step in during 2019 in a period that Trump calls his “Greatest Economy Ever.”
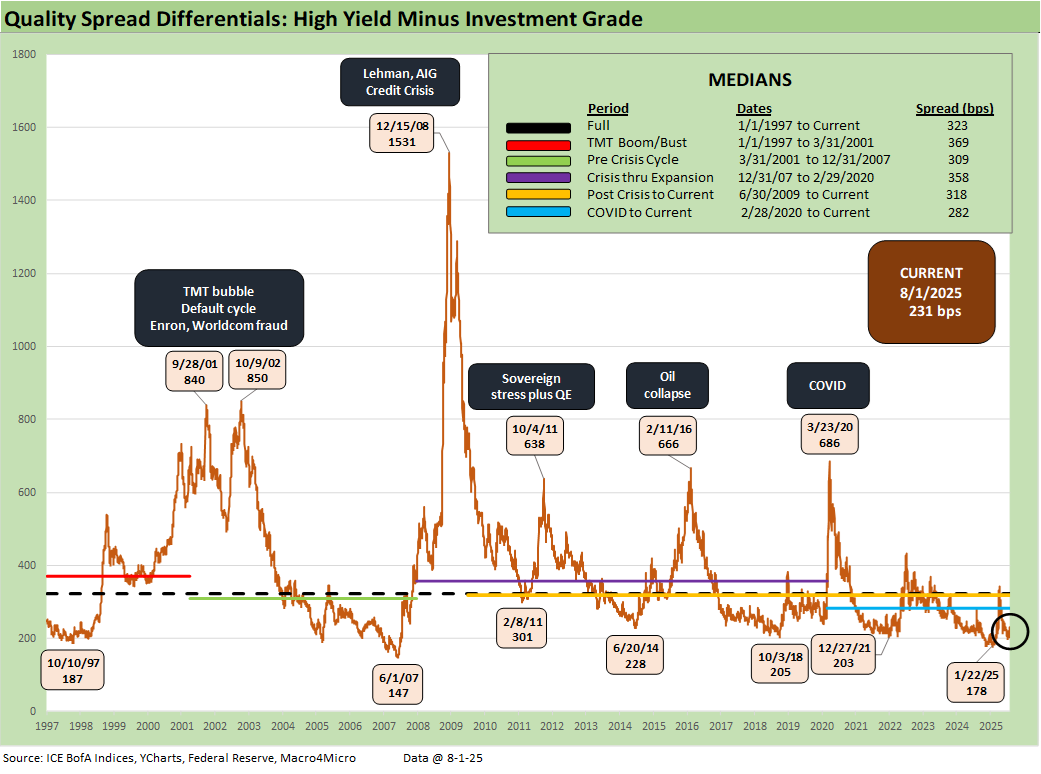
The “HY OAS minus IG OAS” quality spread differential widened +25 bps to +231 bps this week but still comfortably near the June 2014 lows. The compressed level still allows little room for setbacks in fundamentals at the macro level and even a 15% baseline tariff level is a clear catalyst for some issuer and broader economic pain as those tariff impacts flow into pricing and expenses.
Correlation with potential equity volatility is a constant companion for HY as seen in April, but the overall fundamentals are solid in the IG and HY issuer base with earnings signaling still-healthy banks and generally well managed tariff costs so far. The supplier chain adjustment process will remain a major headwind for many industries.
Despite all the noise, it takes a lot of problems to trigger a recession. Just think back to the pre-COVID expansion from the June 2009 cyclical trough through early 2020. There were major swings in HY spreads and equity market volatility over more than a decade. A recession takes many variables to go wrong from consumers to major industry groups. We did not even have a recession in 2022 with solid consumers and low unemployment. That won’t stop the recession debates in the media.
We are focused more on fundamental erosion by major industry groups (autos, energy, etc.) and stress on the consumer. The consumer sector facing tariffs will be a challenge as will the fallout for the small business sector and retailers from tariff expenses and up-front cash demands to pay customs.
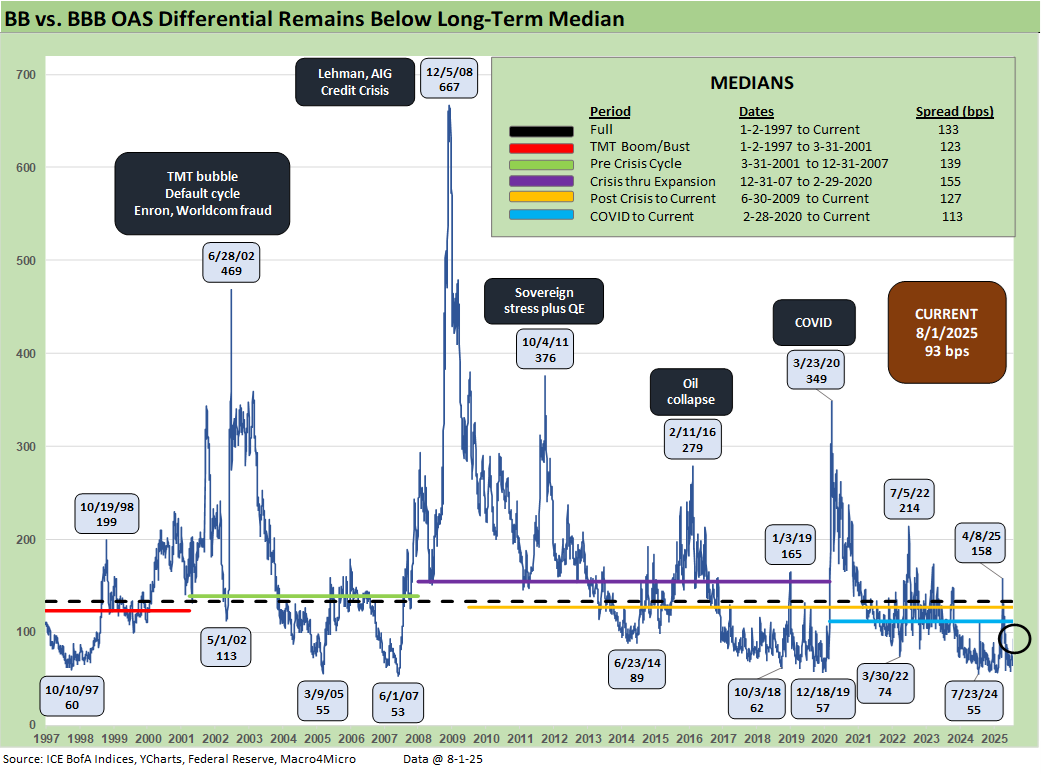
The “BB OAS minus BBB OAS” quality spread differential widened +25 bps this week to +93 bps. Swings like this in the BB/BBB divide are frequent as we saw with the spike to +158 bps after Liberation Day. Autos and Energy will be important sectors to watch for potential volatility in those tiers with Autos already reporting major tariff costs.
The oil price story is always a tricky one for issuers with high commodity exposure with Iranian and Russian supplies no small wildcards. OPEC actions also have been less than friendly to energy bulls in 2025. At just under $68 today (WTI), oil is below the Iran bombing highs but well above the late May $60 level.
For autos, it is very hard to see any good news coming out of the trade policies. Stellantis and Ford reported this week with sharp caution around tariff headwinds. There is only “degrees of bad” for the OEMs from tariffs and potential catastrophe for some OE suppliers. Dealers and auto retail are the most resilient and the OEMs will need to take action to support their retail customer strategies.
There will be much to sort through in the auto sector in 2H25 including the cost impact of high tariffs on steel, aluminum and copper. The Mexico impact on production chains will be an especially important variable for US suppliers and OEM cost structures with GM’s exposure on light vehicle supply a critical factor.
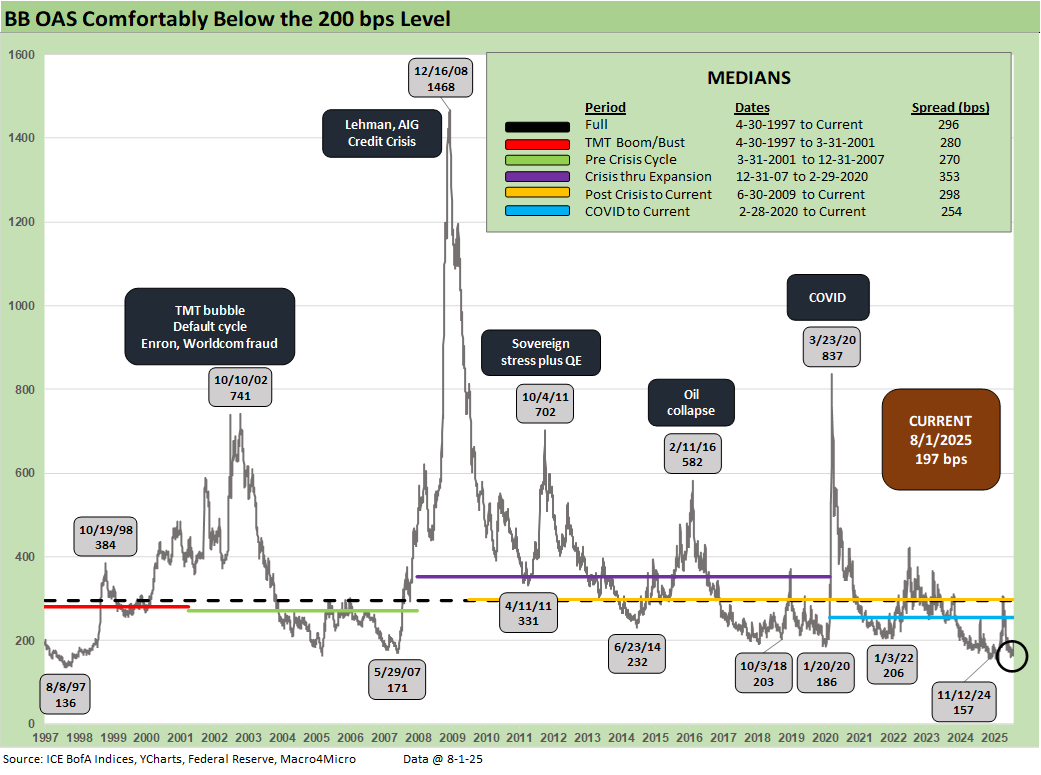
The sub-200 BB tier OAS line is a rare one to cross and we remain there even after +30 bps move this week to +197 bps. Still remaining below +200 bps shows just how rich the index was as it approached the dazzling 157 bps low of Nov 2024. This level leaves the Oct 2018 lows of +203 bps as a notable comp for a frame of reference, given the timing of the fresh sell-off in energy into Dec 2018. Though the current levels are vulnerable given the extraordinarily tight pricing, the higher quality index and low default rates leave plenty of room for rationalization of these levels. For longer time horizons, the BB tier has been a great place to be.
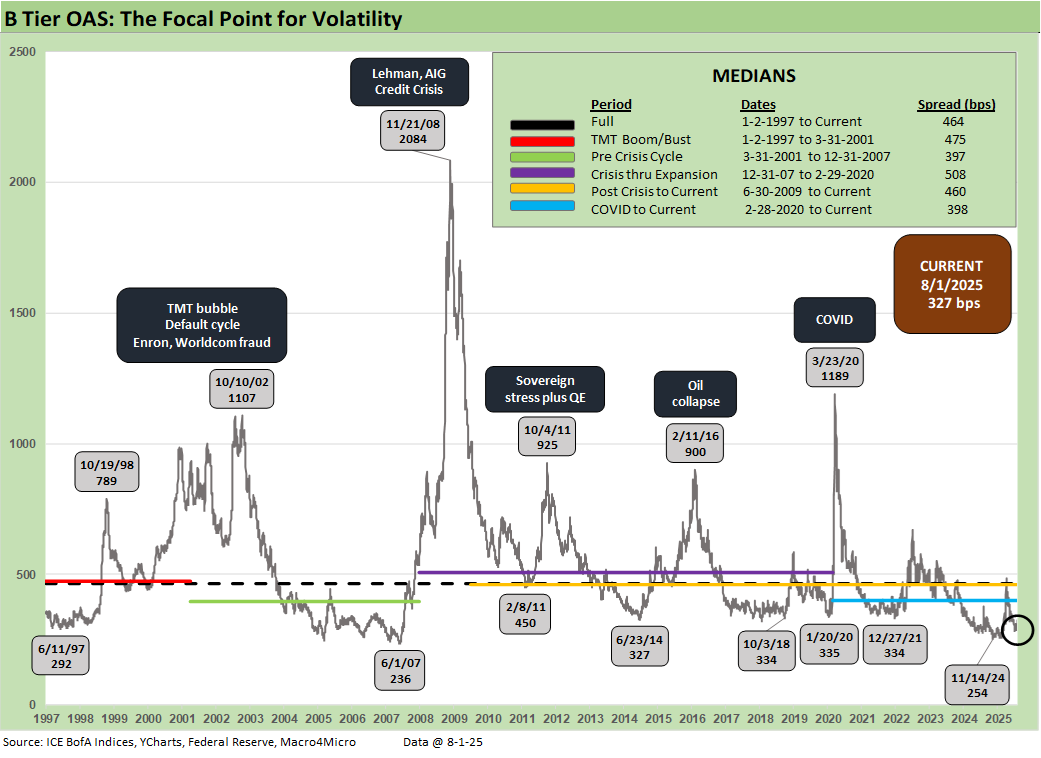
The B tier is the sweet spot of legacy HY fund investors, and the current +327 bps is well inside or on top of the Oct 2018 and June 2014 lows and -137 bps below the long-term median.
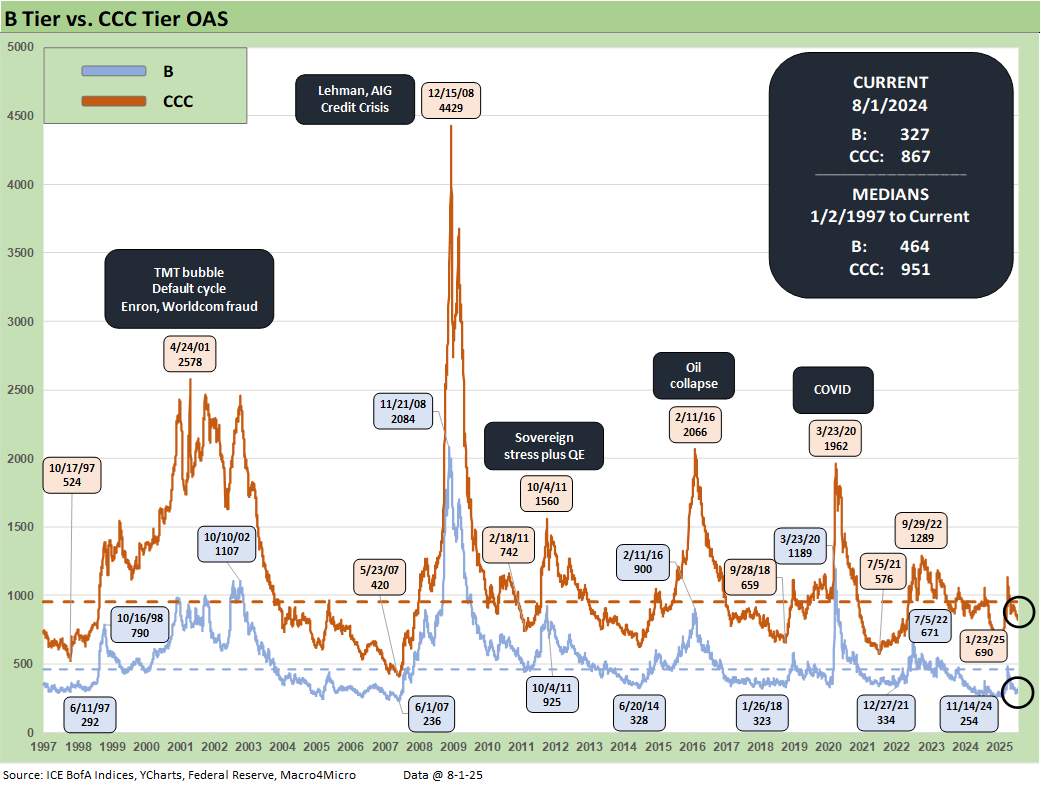
The B vs. CCC tier OAS time series is plotted above. The timeline for B and CCC spreads highlights the points of major divergence along the way (see The B vs. CCC Battle: Tough Neighborhood, Rough Players 7-7-24).
The current CCC tier OAS at +867 bps widened by +33 bps the past week but remains well under the long-term median of +951 bps. The CCC YTW stayed below 13% at 12.49% after being above 14% in the Liberation Day sell-off. The underlying constituents are widely dispersed across an 82.59 composite dollar price. The CCC tier is still in the pricing zone of equity-like risk-returns with such yields.
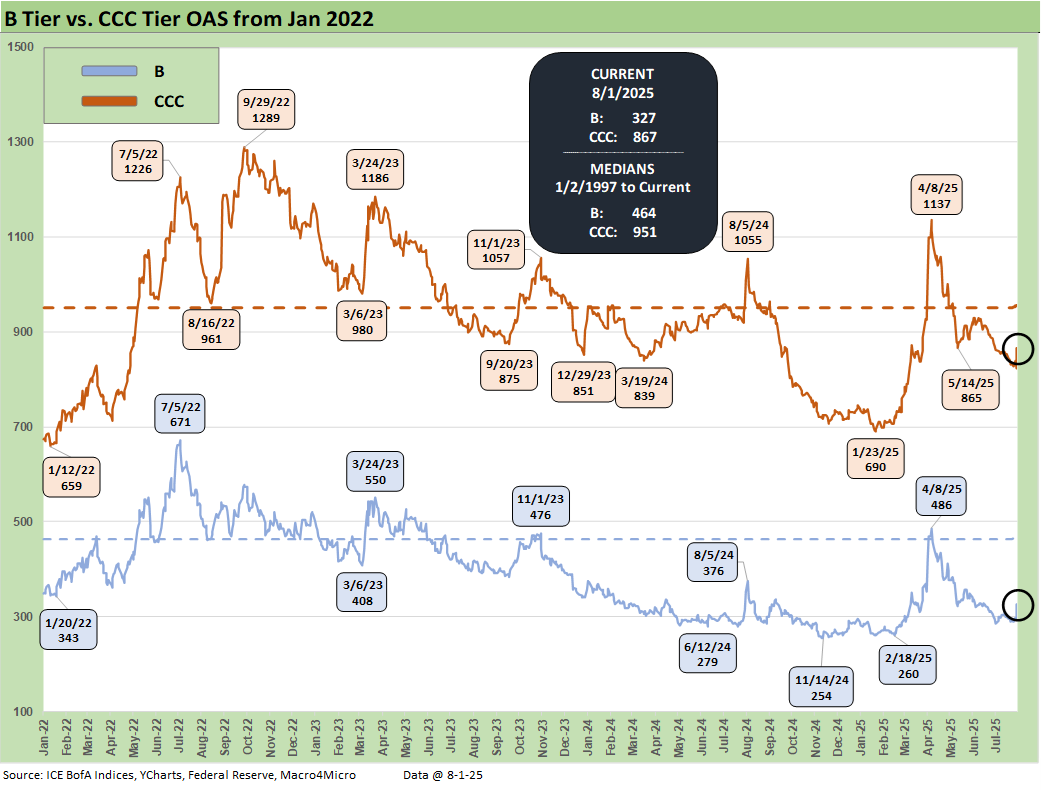
The shorter timeline from Jan 2022 just ahead of the end of ZIRP and start of the tightening cycle gives better granularity on the movements from a low for CCCs of +659 bps in Jan 2022 to a peak of +1226 bps in July 2022 and +1289 bps to end Sept 2022. Then spreads came down to the Jan 2025 tights of +690 bps ahead of the recent spike and whipsaw to current levels that remain wide to those early 2025 lows.
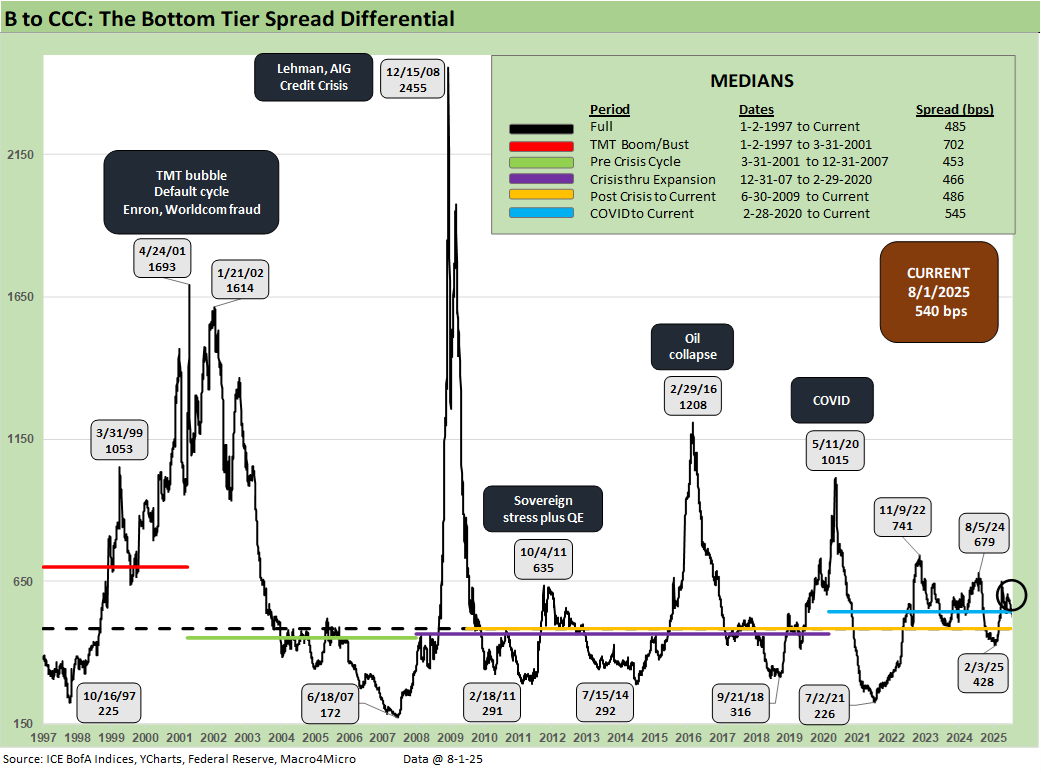
The B vs. CCC tier differential is broken out with the current +540 bps still higher than the long-term median of +485 bps and above the distinct market time horizons with the exception of the TMT HY credit cycle with its +702 bps median. The risks this year have seen CCC tier spreads remain wider by +121 bps YTD after the earlier whipsaw while the B tier swung back to +31 bps wider YTD.
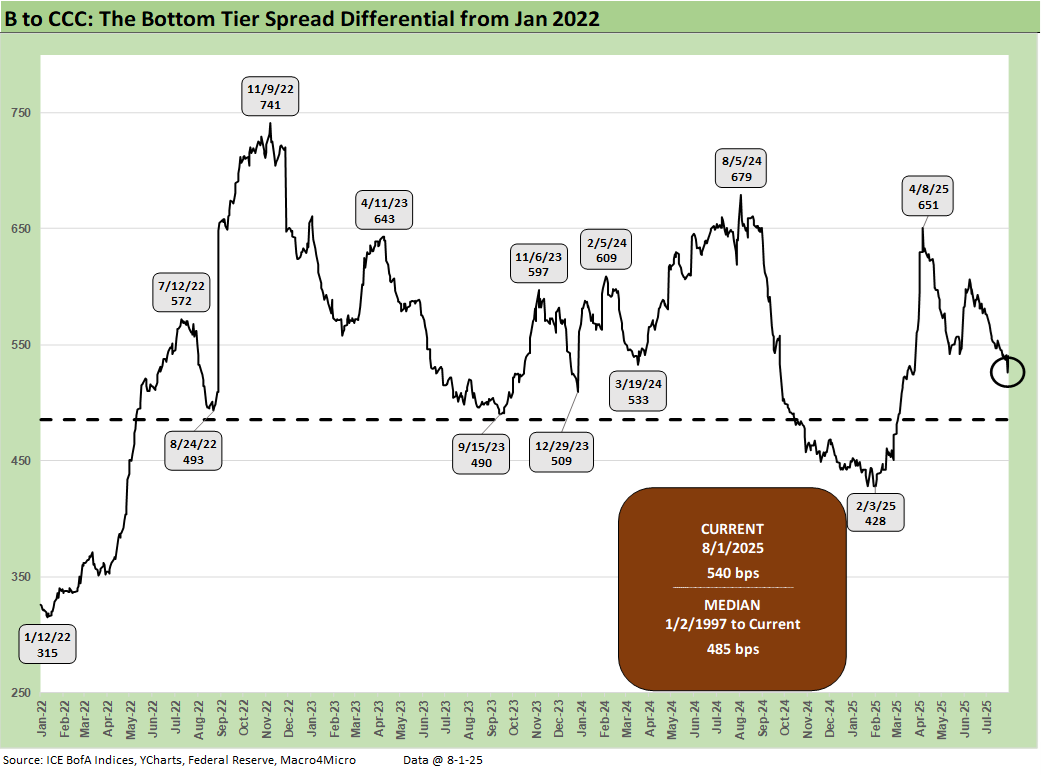
The above chart frames the “B vs. CCC tier” quality spread differential across the short timeline for better granularity. Quality spreads had widened with a vengeance since the low of Feb 2025 at +428 bps even if quality spreads recovered to +540 bps from the early April spike of +651 bps on April 8.
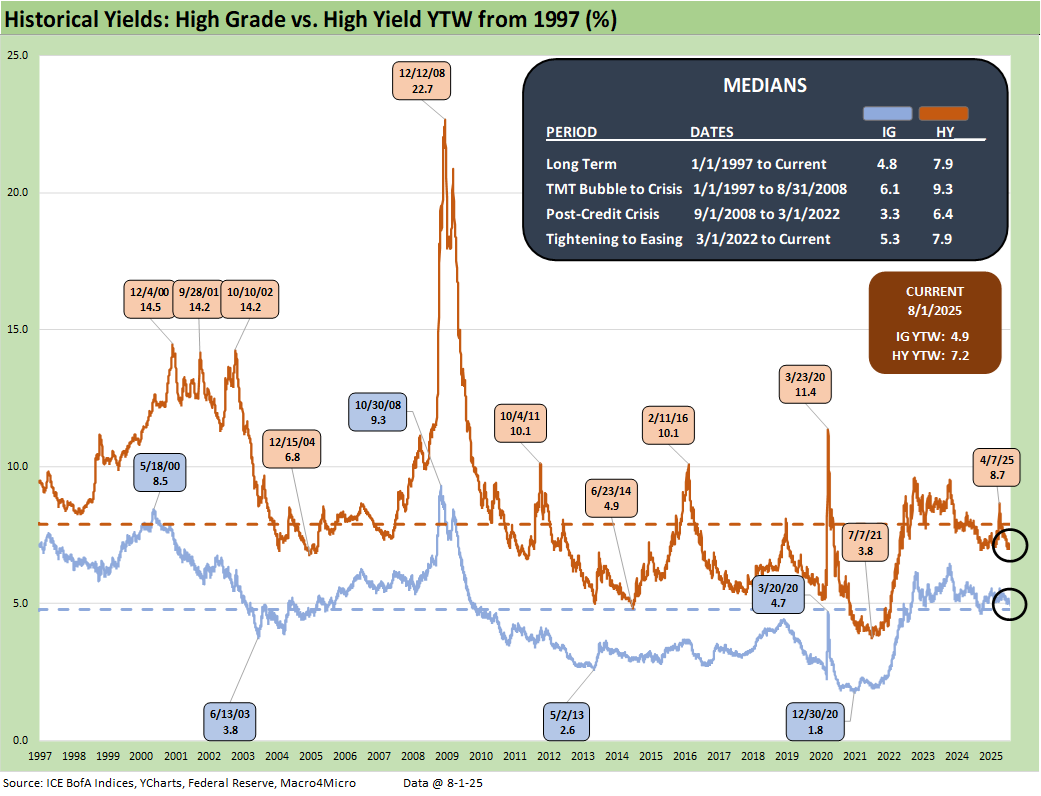
Moving away from spreads, which are well below long-term medians, yields for both IG and HY have a more complex story in historical context given the post-crisis distortions of ZIRP and “normalization.” The normalization period of Dec 2015 to Dec 2018 never really got on track with the economic weakness and Fed easing of 2019 followed by a COVID crisis and return to ZIRP in Mar 2020 (ZIRP ended March 2022). As a reminder, 2018-2019 was the “Greatest Economy in History” according to the current White House resident. As we’ve covered in past commentaries, the numbers do not agree with that assessment – not even close.
The current IG YTW at 4.94% (vs. 5.06% last week) moved lower as the UST saw material declines. IG YTW remains below the 6.1% pre-ZIRP median on overall YTD UST curve moves.
The HY YTW increased to 7.15% this week (from 7.02%) vs. a pre-ZIRP 9.3% median. We consider the pre-ZIRP years the most rational frame of reference in light of the post-crisis ZIRP and QE as well as the COVID Fed reactions.
Spreads will remain a key swing factor for reaching those yield medians of pre-ZIRP years, and we just saw material volatility in credit risk pricing in HY since early April. UST yields are a tougher call with the tariff backdrop still threatening stagflation as well as the potential for a further technically driven upward UST curve shift on the supply-demand fears. The stagflation debate was reignited this week. This past week injected jobs into the handicapping drill by triggering more focus on the other side of the Fed dual mandate.
Away from stagnation + inflation, old fashioned recession risk would pressure UST rates lower and credit spreads higher, but this is no ordinary cyclical turn. We cover the UST shapeshifting in our separate Footnotes publication on the State of Yields as the UST curve material declined this past week (mostly Friday) with the UST shifting lower in a bull steepener with double-digit moves from 1Y to 30Y. The market could (and should) react negatively to any success by Team Trump to terminate Powell to complete the sweep of complete control over all fiscal, monetary, and trade policy by Trump. This past week saw continued attacks launched on Powell.
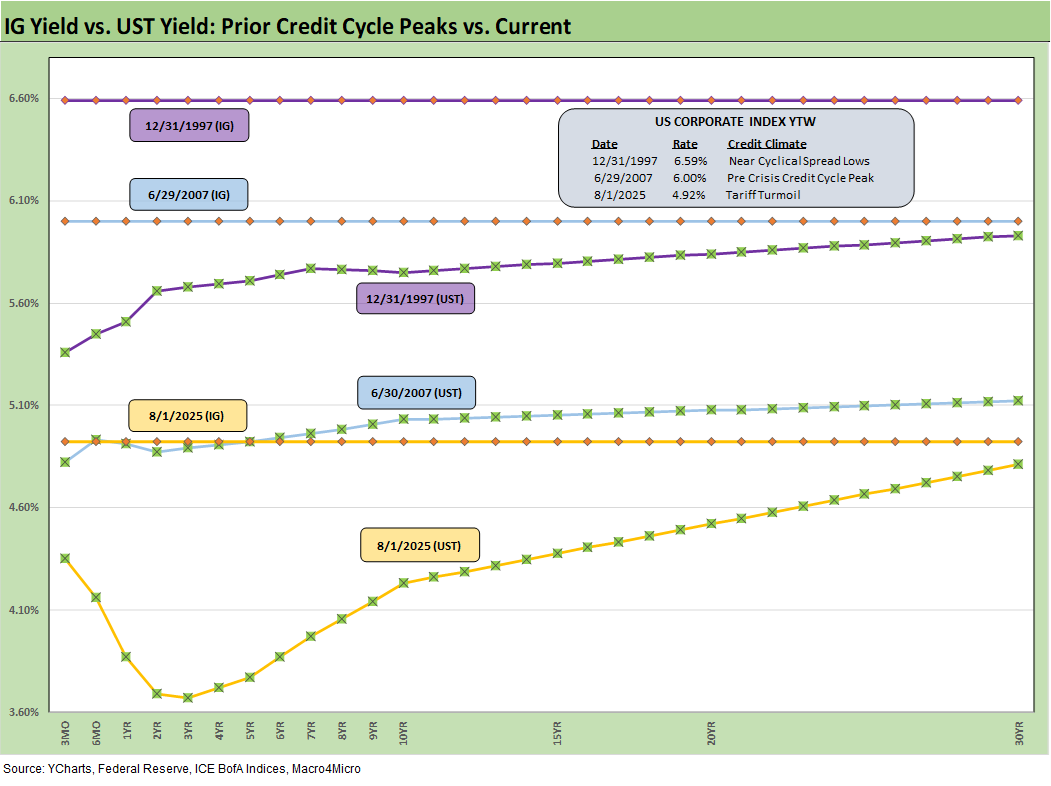
The above frames current IG index yields vs. previous credit peaks along with their respective UST curves. We include both prior credit peaks in June 2007 and Dec 1997 for context as prior peak credit cycles featured high risk appetites and saw investors chasing yields. Those 1997 and 2000 markets saw poor risk symmetry and low spreads.
Today’s UST curve is still low in the context of those historical credit peaks. We saw a recent glimpse of rising long yields along the timeline and the return pain that comes with it. The long bond rallied on Friday with the curve to end this week.
The focus remains on the budget deficit and UST supply as the main driver for duration risk here as we get clarity on the size of the deficit increase. Expected revenues flowing into the US Treasury from tariffs come with the potentially conflicting impact of lowering imports and undermining domestic tax revenue if the cycle weakens.
Reagan got a taste of disappointing tax revenues in the 1980s that caused him to reverse some tax policies (notably on the corporate side). The growth stimulus from the One Big Beautiful Bill may fall well short with few forecasts above 2% GDP growth in the markets. The Fed, OECD, World Bank, and many major banks are calling for 1% handle US GDP growth this year and next.
Stagflation risks will stay in the mix with the current market beyond the credit cycle peak after the tariffs, and long-dated yields still could go easily higher along with spreads widening again for another round of return pain. The weak dollar has had the effect of making tariffs even more expensive for US buyers. The dollar at one point had seen its worst performance since the 1970s with a mild recent rebound. That is the exact opposite effect of what Ryan and Brady were promising back in 2017 with their Border Adjusted Tax proposals (aka BAT Tax or tariffs). That plan was supposed to replace corporate taxes. The GOP controlled Senate dissed their plan and did not even consider it. Times change.
The short to intermediate IG market is still the safest bond game for now. The funds that are asset class constrained to HY can take refuge in the higher quality layers. Overall corporate default risks in HY bonds remain in check (private credit is its own distinct story and mix).
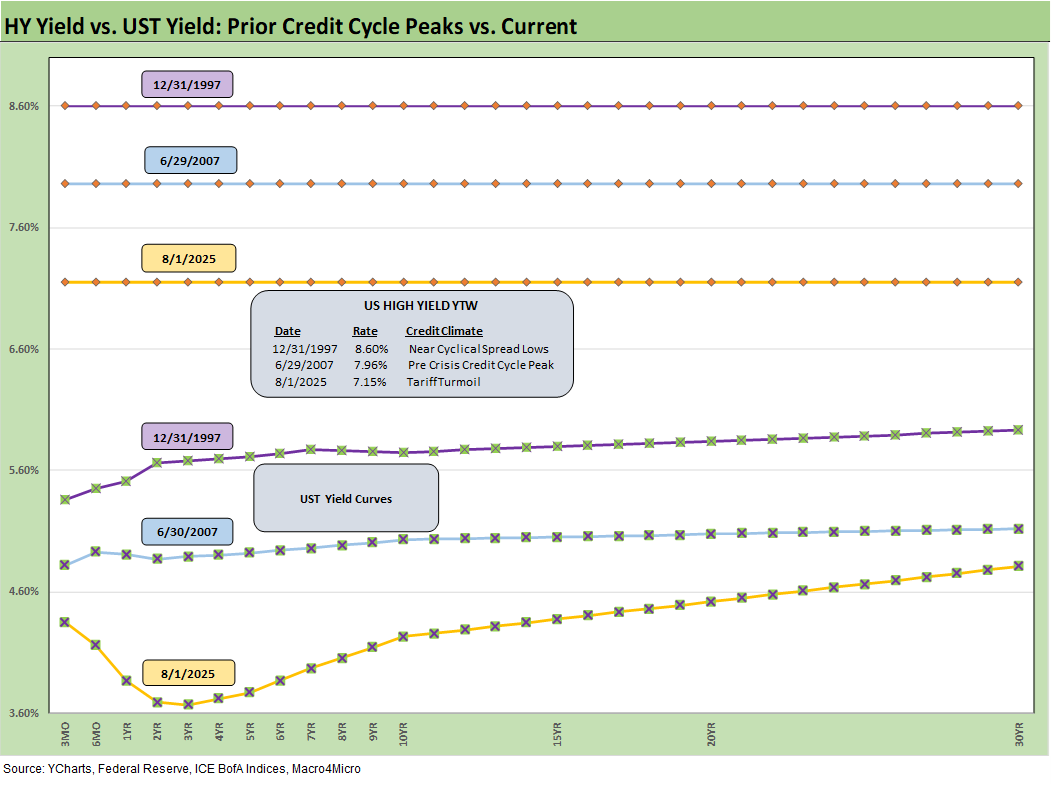
The final chart does the same 1997 and 2007 drill but for HY index yields. This week’s UST move leaves HY index yields below prior peak credit cycles at 7.15% as of Friday vs. 7.96% in June 2007 and 8.60% in Dec 1997. The recent spread widening had moved HY index yields higher, but the recent reversal and rolling UST moves leave the current HY index YTW well below both the 2007 peak and 1997 HY index levels.
The widening during April gave flashbacks to the volatility and major spread moves of the 1997-98 and 2007-08 periods that also posted triple-digit widening months. The sheer speed of risk repricing that has happened in earlier cycles and with the Liberation Day shock offers reminders even if those moves were for very different reasons.
We would highlight that the quality of the HY mix (industries and issuers) is superior today to those in 1997-1998 and 2007-2008. That is especially the case in the IG financial sector vs. 2008, where some securities firms and some banks were like a grenade with a loose pin.
Below we roll forward some updated commentary on the credit cycle…
The challenge is identifying a fundamental transmission mechanism to more trouble for financial metrics and relative risks of default. Identifying a catalyst for pain in the current market would highlight tariffs or trade wars hitting the macro drivers (the consumer) and micro drivers of corporate profitability and cost mitigation actions to offset the tariff expense. Trade war risk has subsided on EU’s apparent surrender and Japan taking what it could get. Canada and Mexico are still open questions. The oft misrepresented “buyer pays” reality will hit margins or require higher prices regardless.
The recent tariff strategy is both unpredictable and unprecedented in modern capital markets, but at least the banks are much healthier. The Aug. 1st deadline passing was trumped by the payroll headlines, but the Section 232 actions remain underway with a lot more slated to come with a 200% tariff threat to pharma a notable one.
The tariff attack on pharma could come at a lag of more than a year to 1 ½ years, but a year in the life of global supply chains (e.g. China-based ingredients, EU production) for US and high value-added manufacturing in EU and Asia is not very long. Such policies also entail immediate disruption and higher costs. One can only guess the fallout in pharma pricing, more trade conflict across supplier chains, and basic logistics.
The trade deal actions remain a threat to inflation, the economic cycle, and corporate profitability. Even as negotiations begin to resolve to more reasonable tariff levels, the approach damages alliances and creates a lot of justified distrust and potential animosity with major and minor trade partners. That creates opportunities for China to step into the relationship and geopolitical disarray.
There is still very little to show in final “deals” as frameworks still need granular detail. Headlines await later this year on how many billions in tariffs will ultimately be an allocated cost by industry group and issuers and how “transitory” the inflation may be in macro context.
We also see higher quality levels in the HY bond index as a starting point vs. 2007 and the late 1990s TMT bubble years. The reality is the tariff impacts and supply-side disruptions are only now just beginning in substance.
China was a rough lesson for the markets. As we’ve now seen across the earnings season, the tariff cost estimates are rolling with notable examples in autos and retail. The latest increase in tariffs and effective dates may complicate that picture again.
It is useful for Trump to play his hand with pauses as the mood moves him in his own murky game theory plan, but corporate investment, big ticket purchase decisions by consumers, and FOMC policy setting can also take a protracted break beyond the pause.
The bad old days…
Looking back even more, the turn in the credit cycle always comes at some point and often with an external trigger or “assist” that can set it off. During 1990, securities firms started to collapse including Drexel’s Chapter 11 in Feb 1990 and bridge loan related bailouts of Shearson Lehman, First Boston, and Kidder Peabody. We do not face that type of financial intermediary meltdown risk here (at least not yet). In a protracted stagflation bout, eyes will return to the regional banks.
The summer of 2007 was the start of major problems in the credit markets with asset risk and leveraged counterparty exposure and bank/broker interconnectedness risk soaring. Despite that backdrop that worsened in August 2007, the equity markets and S&P 500 and NASDAQ kept on rallying into Oct 2007. Later in the turmoil and well after the fact, the start of the recession was tagged as Dec 2007 (see Business Cycles: The Recession Dating Game 10-10-22).
The 2007 experience reminds the market that credit leads the economic cycle and equity lags. The same was true in 1999 with the HY default cycle underway and NASDAQ at +86% that year. This time around, the credit markets did not expect the tariff insanity. The initial spread wave in April quickly reversed but there could be fresh rounds. The China downside scenario was the worst and is now a lower risk. What is shocking was the poor White House grasp on the risks. China had a lot more tricks up its sleeve in supply strategies (e.g. pharma).
Buyer “writes the check” on tariffs. Facts matter.
The real economic effects are more geared to the periods ahead when tariffs will be rolling in at the transaction level. That will be the reality point. We expect HY to be unhappy again in the fall and spreads to average wider as the tariffs roll into actual corporate fundamentals.
There are no frictionless wheels in high tariffs. The buyer pays the tariff at customs (literally “writes the check”). How that gets spread around the economic chain from the seller to buyer to wholesale and end customer has a lot of moving parts.
The “seller pays” and “selling country pays” has been a clear falsehood from the Trump camp, and he admitted as much when he demanded that Walmart “eat” the tariff cost. Why would there be anything to eat if the seller pays? He has been out again each week repeating that with the latest tariff wave on the march to the deadline.
Shady and misleading discourse is never new to Washington. Substitute the question “who writes the check to customs” for the “who pays the tariff” and it is easier to corral those who play semantics and tweak key words. The reality is that Trump never “collected hundreds of billions” from selling countries.
Trump recently highlighted his mega collection process yet again, reiterating the hundreds of billions he “collected” from selling countries. He even cited a hard number in one live session ($600 billion). We cannot tell what Trump remembers as a fact and what he made up. Until the tariff deals are put to bed, outsized “surprise risk” in tariffs remains high on the list. Since Trump essentially breached the USMCA, even a deal is not a reliable deal.
The recent EU “deal” has a lot of details missing, but that was good news in the sense the EU had been prepared to counter and fight. A trade war with the largest US trade partners would not have been well received by the market. The EU folded and is taking a lot of heat and plenty of mixed reviews in the EU media.
See also:
Footnotes & Flashbacks: State of Yields 8-3-25
Footnotes & Flashbacks: Asset Returns 8-3-25
Mini Market Lookback: Welcome To the New World of Data 8-2-25
Happiness is Doing Your Own Report Card 8-1-25
Payrolls July 2025: Into the Occupation Weeds 8-1-25
Employment July 2025: Negative Revisions Make a Statement 8-1-25
Employment Cost Index 2Q25: Labor in Quiet Mode 7-31-25
PCE June 2025: Prices, Income, and Outlays 7-31-25
2Q25 GDP: Into the Investment Weeds 7-30-25
2Q25 GDP: First Cut of Another Distorted Quarter 7-30-25
United Rentals: Cyclical Bellwether Votes for a Steady Cycle 7-29-25
JOLTS June 2025: Lower Openings and Hires, Higher Layoffs YoY and Flat MoM 7-29-25
Mini Market Lookback: Mixed Week Behind, Big Week Coming 7-26-25
Durable Goods Jun25: Air Pocket N+1 7-25-25
Taylor Morrison 2Q25: Resilient but Feeling the Same Macro Pressure 7-25-25
New Home Sales June 2025: Mixed Bag 7-24-25
Existing Home Sales June 2025: The Math Still Doesn’t Work 7-23-25
PulteGroup 2Q25: Still-Lofty Margins see a Mild Fade 7-23-25
D.R. Horton 3Q25: Material Slowdown Still Good Enough 7-22-25
Housing Starts June 2025: Single Family Slips, Multifamily Bounces 7-18-25
Mini Market Lookback: Macro Muddle, Political Spin 7-19-25
Housing Starts June 2025: Single Family Slips, Multifamily Bounces 7-18-25
Retail Sales Jun25: Staying Afloat 7-17-25
June 2025 Industrial Production: 2Q25 Growth, June Steady 7-16-25
CPI June 2025: Slow Flowthrough but Starting 7-15-25
Mini Market Lookback: Tariffs Run Amok, Part Deux 7-12-25
Mini Market Lookback: Bracing for Tariff Impact 7-5-25
Asset Return Quilts for 2H24/1H25 7-1-25
JOLTS May 2025: Job Openings vs. Filling Openings 7-1-25
Midyear Excess Returns: Too little or just not losing? 7-1-25