
Footnotes & Flashbacks: State of Yields 8-3-25
Macro trends are complicating Trump’s tariff party, sending UST lower on cyclical fears but raising the volume on the stagflation debate.


Now bring me the inflation supervisor…
The fate of the payroll statistics head at the BLS sets the stage for some more political toxicity but begs improved transparency on tariff price and payroll impacts. The game of authoritarian intimidation continues but this latest move raises the specter of autocratic control of economic data. That is not great for UST marketing and offshore demand.
For the UST curve dynamics from here, last week’s rally on cyclical fears and the ability to invoke the other half of the Fed’s dual mandate generated a fresh bull steepener with the 1Y to 30Y all moving lower by double digits.
We don’t get CPI until Aug 12, but the collective weight of the data is showing signs of inflation along select goods lines even set against a weaker payroll and fixed investment backdrop in 2Q25 GDP numbers. So far, the Golden Age has been a little heavy on the dross.
We dare Congress to have hearings on inflation and payroll data sources and needs but also how small businesses and the retail industry are being impacted by tariffs as those sectors are such large pieces of the employment picture. Congress runs scared and lets the White House dictate.
The following updates our rolling weekly State of Yields commentary.
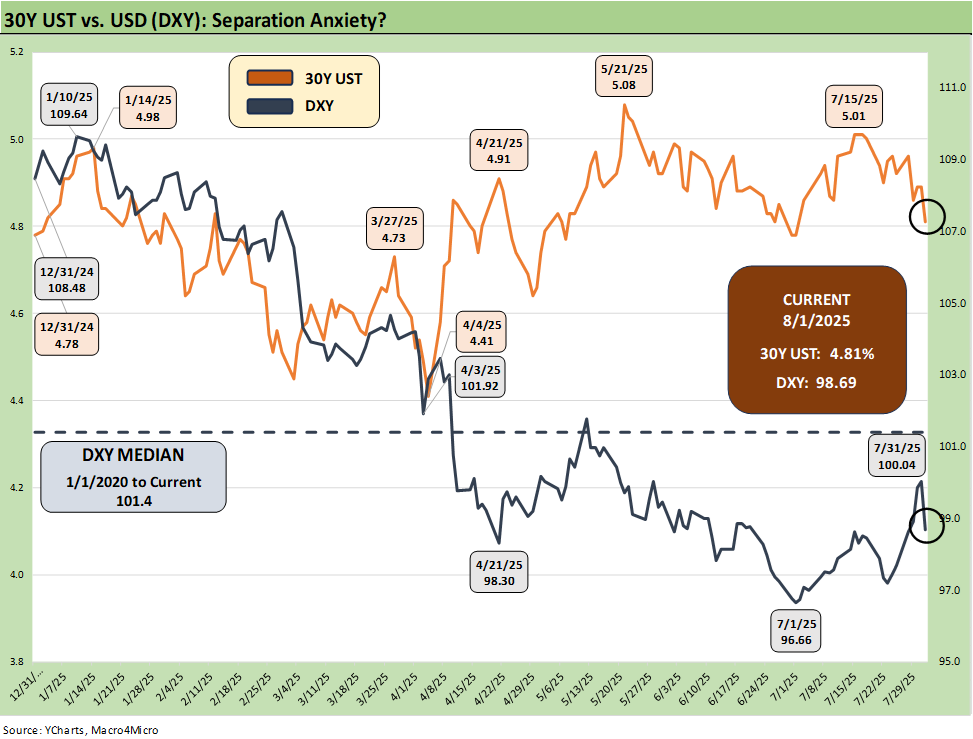
We don’t often plot currency trends, but the noise of the past week prompted us to update a chart showing the 30Y UST vs. the dollar index (DXY). At the very least, the chart reminds us that the world is on edge around US sovereign debt supply and the related risks in currency exposure. The reality is that the US will need record demand (every year) for UST bonds/bills to go with the record supply of US borrowing needs to fund what is growing into annual record deficits. If the FOMC eases, the demand side on the short end can get tricky.
The chaos in US policy execution is not reassuring to date whether tariffs or steadily increasing deficits. The tariffs have made a lot of enemies of what might have been rivals as well as strained relationships with what may now be former allies. Even administrative actions such as sacking government data providers at the BLS and claiming “rigged” data is not reassuring on the competence or the motives of the executive branch. There will be more than a few global investors who will start framing the US with political risk criteria rather than just “risk free.” Most will look past (as in below) the high AA tier rating. The US sovereign leverage metrics definitely are not in line with the credit ratings.
The dysfunction is not new, but calling out the BLS for “rigged data” was one move that crosses a line for many. The action might signal a White House that would be leaning toward embracing “massaged” or manipulated economic data reporting for political purposes. Folks in the White House will act indignant, but this is clearly a risk.
The White House “shill brigade” was on the Sunday shows defending the termination. The BLS action speaks louder than the usual political blather. After all, many of the same talking heads will not admit tariffs are paid by the buyer to customs (a topic many have beaten to death including us). That by itself is a stain on their veracity.
The idea that job additions might move lower or that a major event risk setback like the Liberation Day tariff binge might promote less hiring for a few months and not fit into the “old models” is hardly a shock. This has been just the type of period that takes quant models to therapy (or the local pub). Our rule of thumb is that event risk or outliers can screw up models. It is hardly new (think LTCM in 1998 or the correlation crisis in 2005 as easy examples).
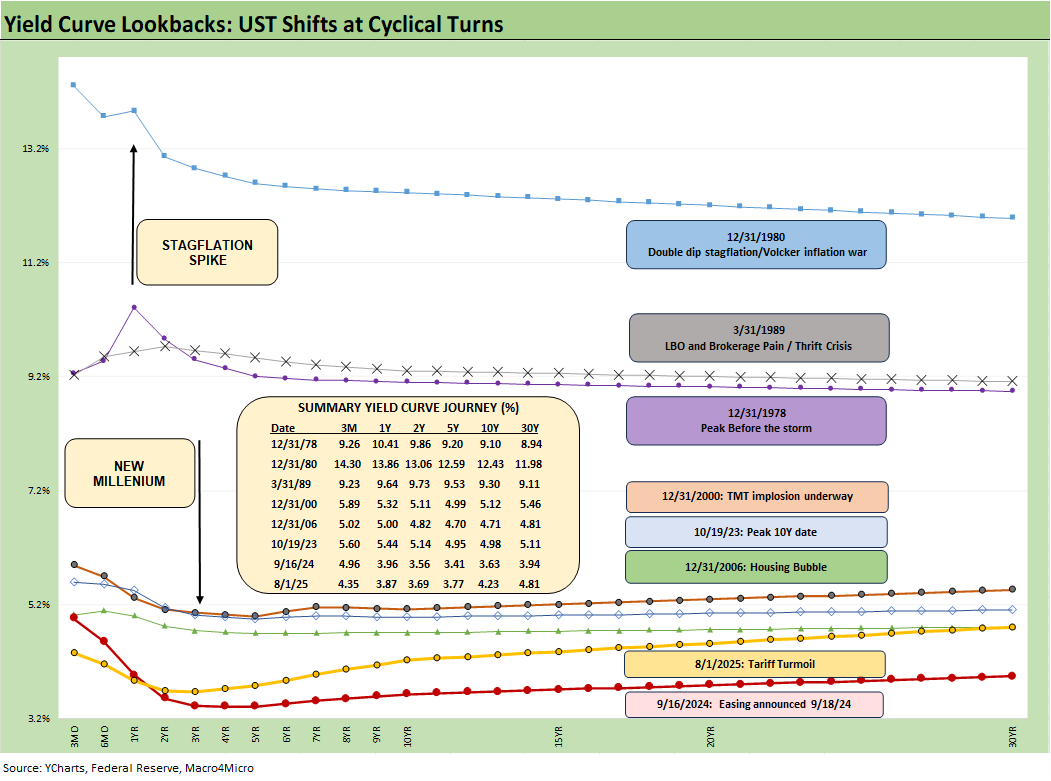
The above chart plots some key cyclical transition periods which underscore that today’s interest rate backdrop features very low rates in historical context and especially when you look outside the crisis years of ZIRP and QE. Those pre-crisis UST curves are also worth keeping in mind as recent comments from UST Secretary Bessent and Russell Vought of the OMB angle to put Project 2025 into practice in restructuring the Fed (see Happiness is Doing Your Own Report Card 8-1-25). As a reminder, Vought was the lead architect of Project 2025 and a co-author. On a side note, he was a Political Science major at a small midwestern Evangelical College, and it appears he lacks capital markets experience or economics training.
We heard echoes of the Fed overhaul ambitions from both Vought and Bessent again in recent weeks. We would recommend a read of Chapter 21 and 24 in the Project 2025 tome where there are sections dedicated to the Federal Reserve and economic data groups within the Dept of Commerce or Census. The sacking of the BLS stat head on Friday just raised the visibility of the end game for Team Trump to lock in on control by loyalists. That is the Xi handbook.
It is a topic for another day, but the desire to have White House control over the Fed and reduce its mandate to “price stability only” is a Pandora’s box of topics that everyone should start watching more closely. Think back to events like the 2008 crisis, COVID, the run on the regional banks in March 2023, and the scenarios can get ugly very quickly on what a “price stability only” backdrop could mean. Add in the very low quality (i.e. clueless) level of dialogue we have been hearing in Washinton on tariffs and their economic effects and there are plenty of reasons to worry.
Historical UST curves…
In the above chart, the yield curves plotted span from the Carter inversion of 1978 across the Volcker years, the1980s credit cycle peak in 1989 (note the 9.2% 3M UST), the TMT cycle faltering in 2000 (on the way to a massive Greenspan easing in 2001), and the housing bubble in 2006. During the 2004 to 2007 period, leveraged derivative exposure and structured credit was out of control and counterparty risk was soaring. Worth highlighting is that the current 3M UST is notably lower than the pre-crisis, pre-ZIRP 3M UST levels from those past credit cycle peak years.
The chart then jumps from 2006 to 2023, which takes the market beyond the crisis period and the ZIRP years and COVID. Both the post-credit crisis period and COVID prompted the Fed to deliver a wave of market liquidity support and confidence building programs that helped save the capital markets and supported the banks. That period brought plenty of QE and normalization distortions to the yield curve shape.
The market saw a massive move lower and bull flattener to end 2023 after the 10Y UST peaked in Oct 2023 as we review below. Steeper and higher was not the forecast to start 2024 as the market expected flatter and lower. During 2024, the curve moved in an adverse direction with a bear steepener until a major UST rally alongside the Sept 2024 easing. That soon brought us a fresh steepening with some rallies and sell-offs along the way.
With the sharp move lower in the 2Y UST on Friday, the probability of easing is rising and flowing into the 1Y and 2Y as we cover below. We look at the 2Y to 30Y slope history further down in this commentary.
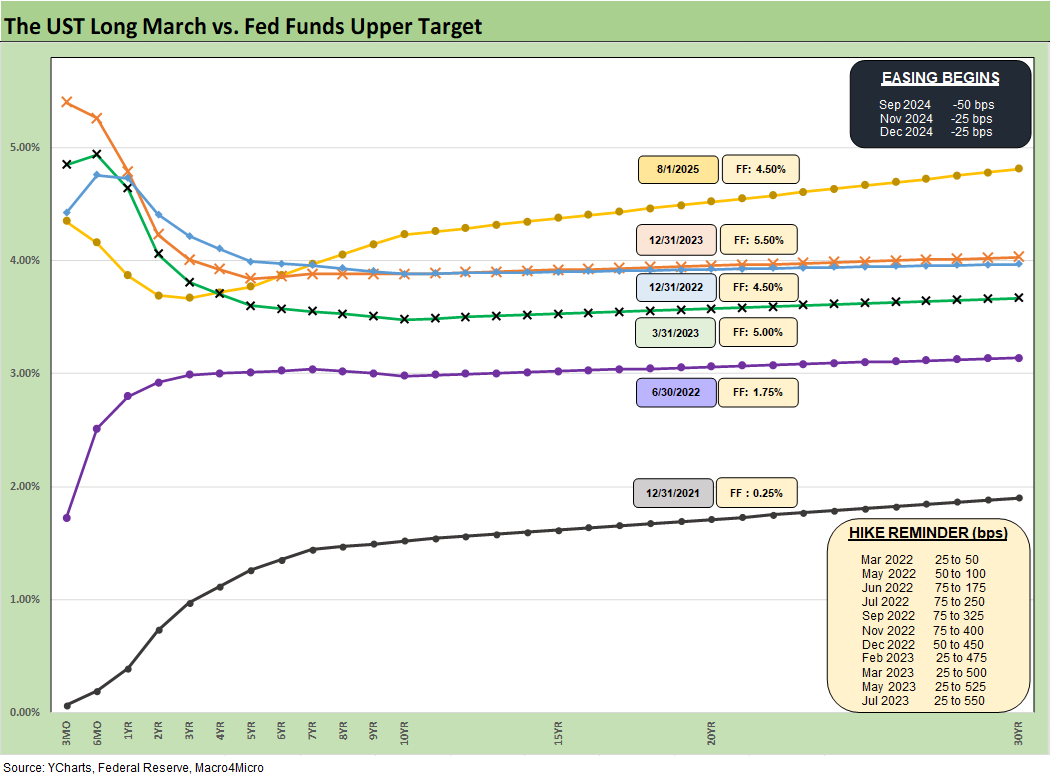
The above replays our weekly chart detailing the migration of the UST curve from 12-31-21 with a memory box detailing the tightening dates and magnitude and more recently the easing. The UST curve seems to intermittently mix bear steepening patterns and flattening rallies since the Sept 2024 lows, but market fear was creeping into the shapeshifting after Liberation Day before calming down with the pause. The 30Y was stubborn on the long end during the bull steepening period we had seen YTD, but the Friday payroll news and the BLS termination sent the 30Y lower by -11 bps also.
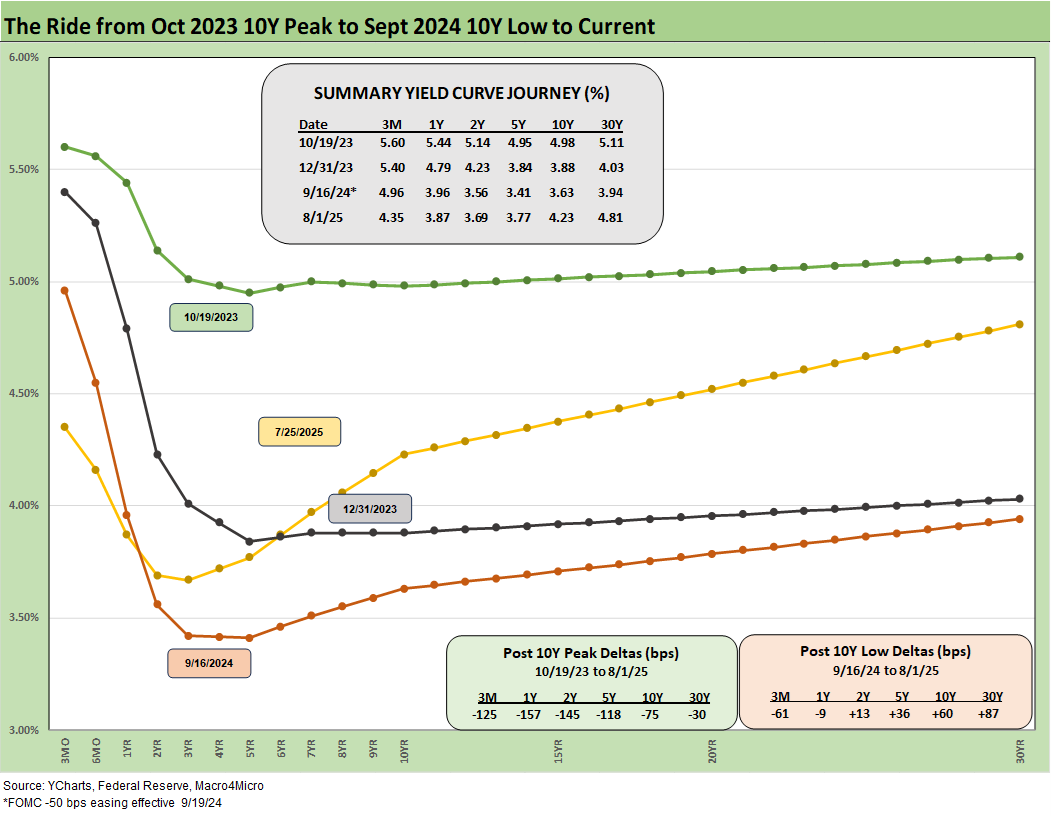
The above chart details the material move from the peak UST curve of 10-19-23 down into the UST bull rally of Nov-Dec 2023 and then eventually into the lows of Sept 2024. The Sept 2024 low tick only came after a bear steepener hit the curve through the summer of 2024. We then moved back into the bear steepener mode until the tariffs roiled the UST markets and initially sent 2Y to 30Y lower on cyclical fears.
The UST shift higher from the Sept 2024 lows and the steepening from the low point at the end of 2023 is reflected in the chart. We see the 10Y and 30Y notably higher now than Sept 2024 with a more normal upward sloping shape from 2Y out to 30Y.
The challenge is still that front end inversion from 3M to 2Y and 5Y. The inversion anomaly on the front end during a protracted expansion has been hard to shake with the FOMC holding the line over tariff-related inflation questions. The June CPI and PCE reports include plenty of signs across the MoM CPI/PCE trends that show numerous product group line items seeing prices pushing higher. Fact deniers (like election deniers) will just say it is fake or there is no cause-and-effect. Or they can just fire some data personnel, scream “rigged,” and whine some more.
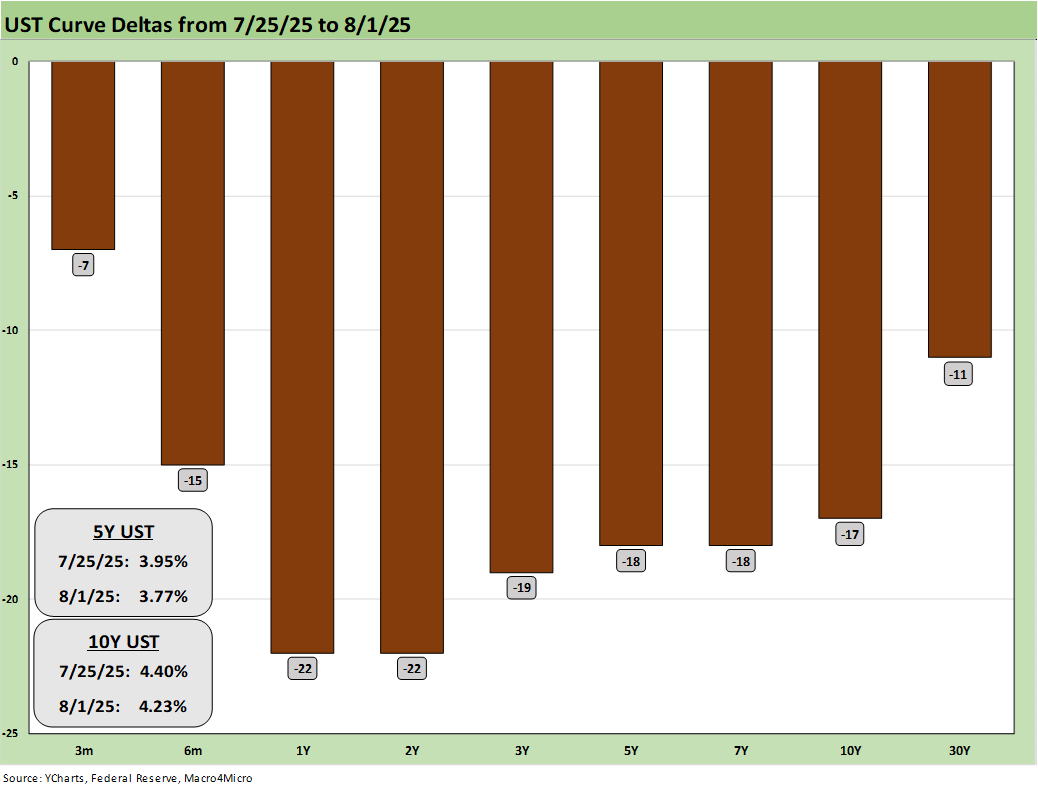
The above chart updates the 1-week UST deltas with a sharp move lower for the 2Y UST and material declines in 5Y and 10Y with the UST shifting lower in a bull steepener with double-digit moves from 1Y to 30Y.
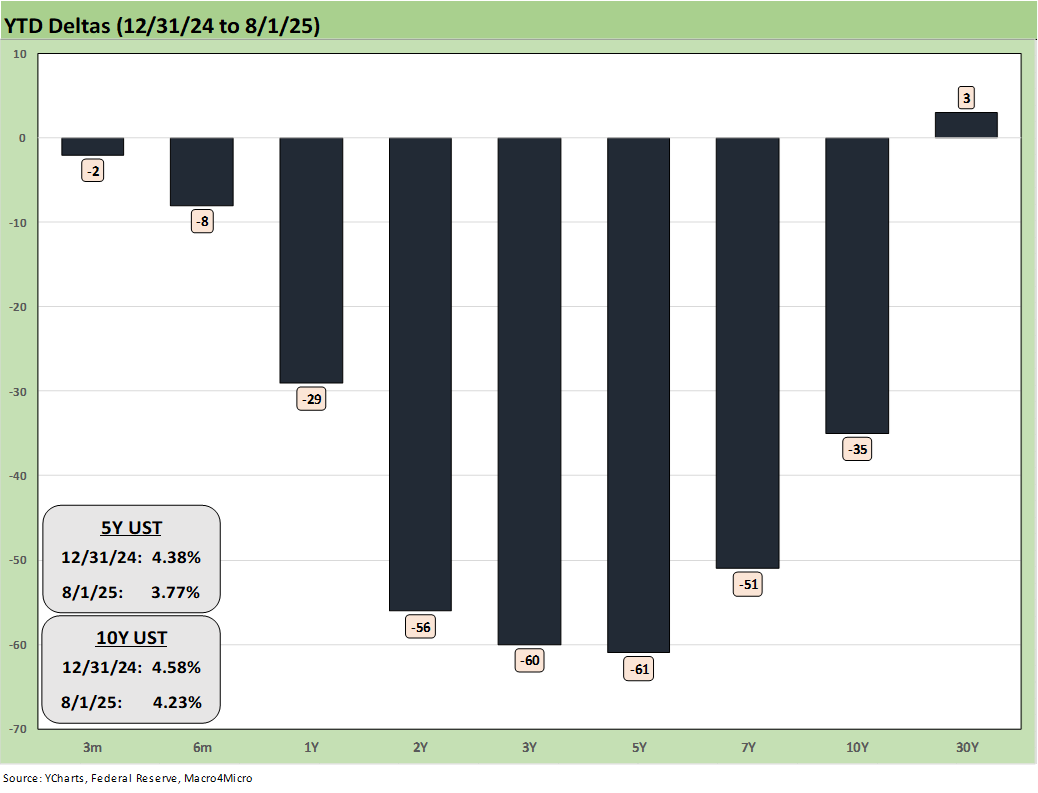
The YTD UST deltas show good news for bonds since the UST move had helped keep all 7 bond ETFs in positive return range. The UST steepener threat is alive and well if the FOMC governance structure gets turned upside down by Trump, the Project 2025 crowd has its way, or if the tariff-related price action roils confidence in markets. As of this past week, cyclical worries trumped inflation, but CPI comes next week (Aug 12) and the tariff transactions will have another month under their belt. The MoM product drill will be a focus for many.
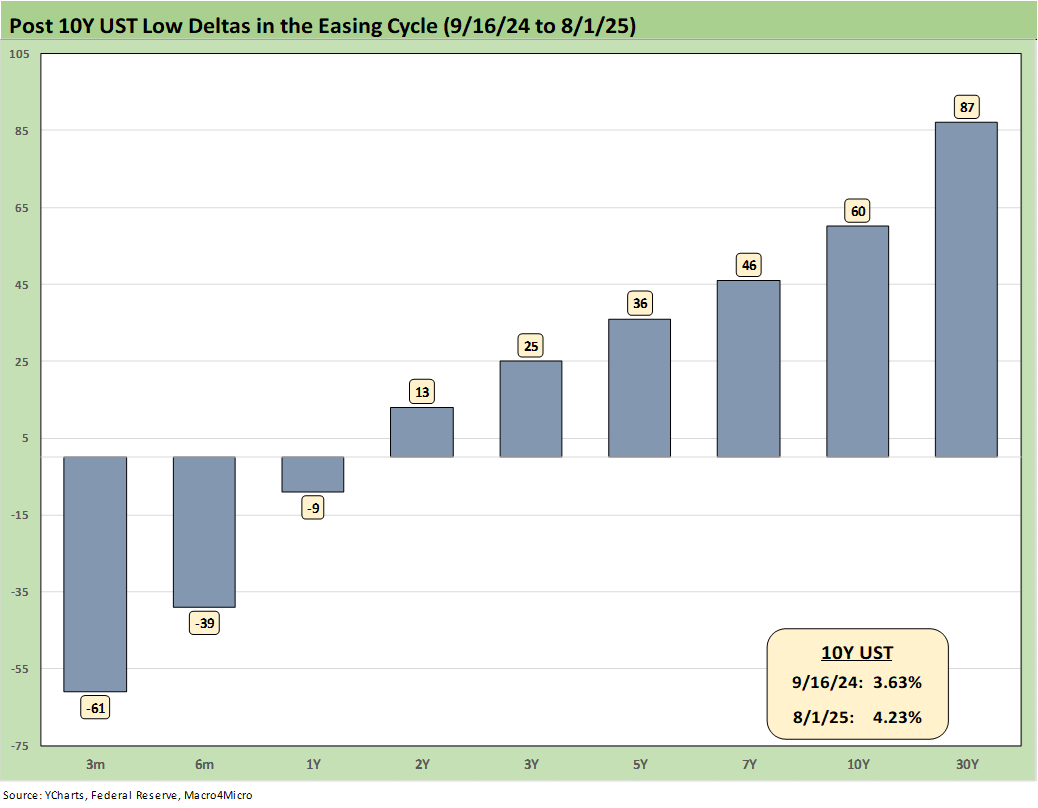
The above chart updates the UST deltas since the 9-16-24 lows that came alongside the Fed easing. That has not worked as many market watchers predicted on the shape of the UST curve and number and pace of easing that was supposed to follow.
Trump continues to rail at the Fed and Powell to lower rates, lately demanding 300 bps of easing, not long after he had demanded a 200 bps of easing, up from earlier demands of 100 bps in cuts. The move from 100 to 300 unfolded in a few weeks.
The reality is that Trump’s target fed funds rate for right now would be well below inflation. With the market running above target and tariffs rising while Trump claims his economy is the “hottest” in the world, we are not sure a de facto stimulus via negative real fed funds is a conceptually sound (or coherent) plan. Once he gets “his guy” in the seat at the Fed, that will not stop someone from attaching a pedigree and PhD to that demand and doing it anyway. A well-pedigreed yes man is still a yes man.
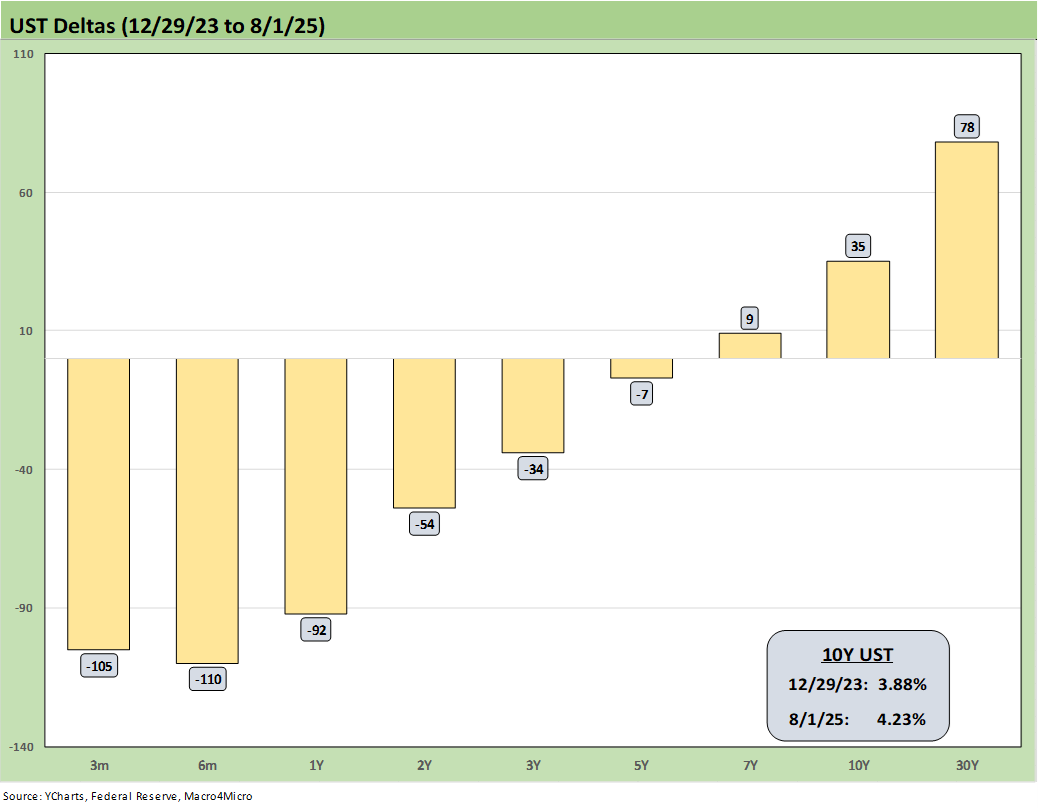
The above chart updates the UST deltas from the end of 2023 after a massive rally in rates and risk in Nov-Dec 2023. The follow-on in 2024 expected by the consensus mildly disappointed the UST bulls in the number of FOMC cuts. The market got 4 x 25 (a double in Sept 2024) but not the number of 5 to 6 FOMC 25 bps cuts expected. The expectation of a pronounced bull flattening during 2024 also did not play out as expected when a bear steepener prevailed by the end of the year. As detailed in the earlier chart, the 2025 period has fared better for bonds on a modest bull steepener.
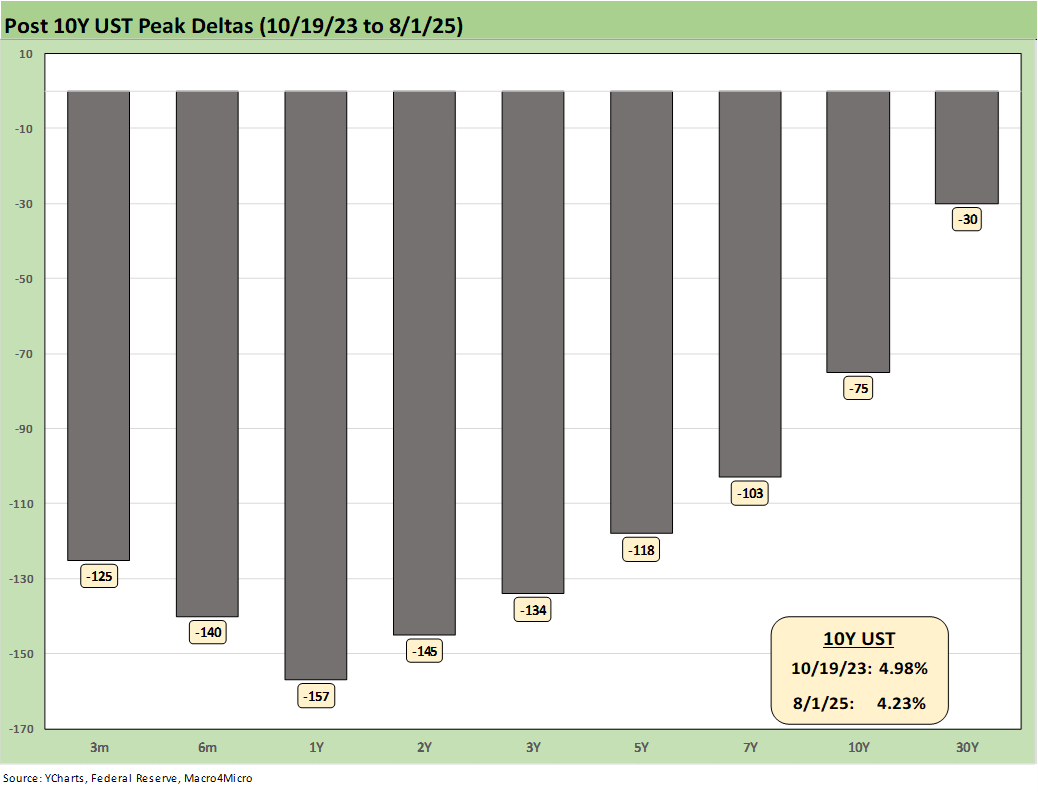
The above chart updates the running UST deltas from the 10-19-23 peak date of the UST 10Y when it barely missed the 5.0% line. For those looking for a frame of reference on what a bad move in inflation metrics might mean, these deltas at least offer a recent set of data points during an inflation fighting year such as late 2023 and into 2024 (until Sept 2024 began the easing process). That is why we keep revisiting that timeline. It reminds us what reversion could mean.
These rally deltas could revert in part or in whole with the wrong inflation outcomes. We don’t need to see 2022 again, but the old saying “It happened before, it can happen again” resonates for many.
Losing a rally of -75 bps in the 10Y UST above would hurt the mortgage market and would lead to a material valuation headache in equities, M&A economics, and capital project planning. Mortgages have been a drag on housing (new and existing home sales). The risk of inflation heading the wrong way would do more damage. Stubborn rates or higher rates in the short end to 5Y would damage consumer durables financing and related volumes.
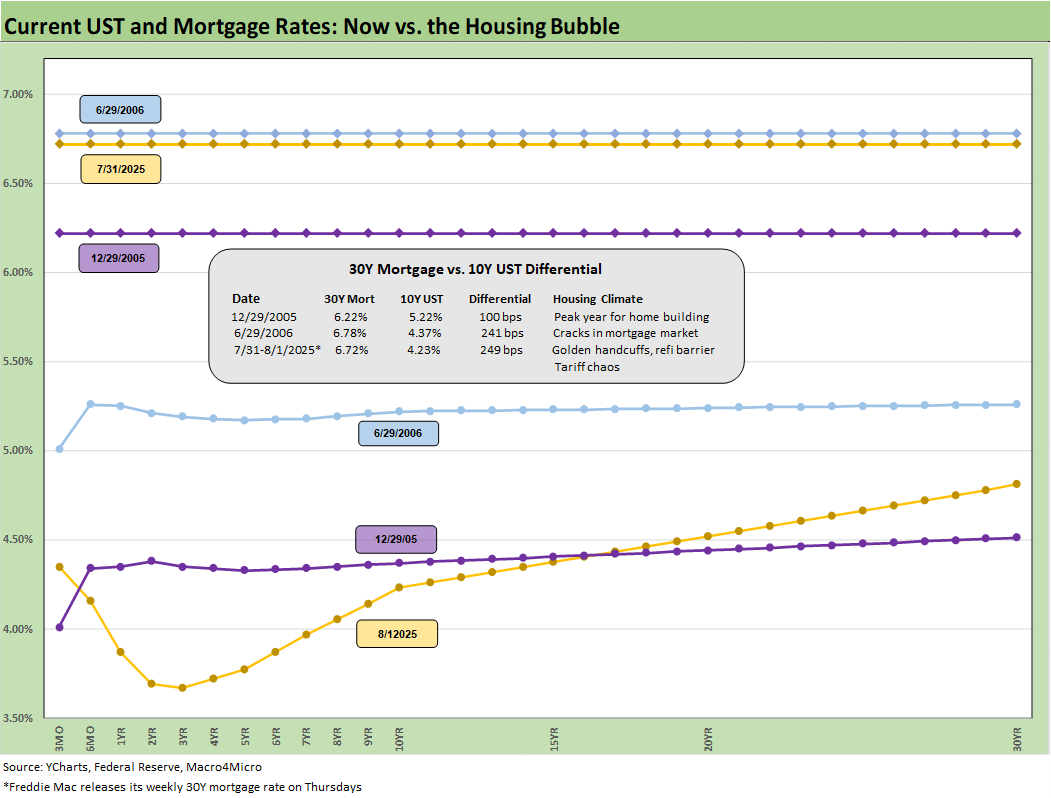
The above chart is one of those replay slides we update each week. This one posts the UST curve for this past Friday and the Freddie Mac 30Y Mortgage benchmark rate (noon Thursday release). We include two useful historical periods including the peak homebuilder year end of 2005 and mid-2006 when RMBS quality concerns were catching headlines as the housing bubble was peaking.
We post UST curves for each period in the chart. The past week saw Freddie Mac mortgage rates barely moved the past week with a slight move to 6.72% on Thursday from 6.74%. However, as of Friday close, the Mortgage News Daily survey was 6.63% (down -12 bps on the day) after the payroll turmoil. We have seen minor moves recently, but that comes after a 200 bps range since fall 2023.
We include a column above detailing the differential between the Freddie Mac 30Y and the 10Y UST. That differential moved higher to +249 bps this week from +234 bps last week. The year 2005 posted a differential of only +100 bps and makes a statement on what the mortgage market was like in 2005. The mortgage market was very hot back then in the housing bubble as mortgage volumes soared during that peak homebuilding year and a very busy period of refinancing was running alongside as a source of funds for homeowners.
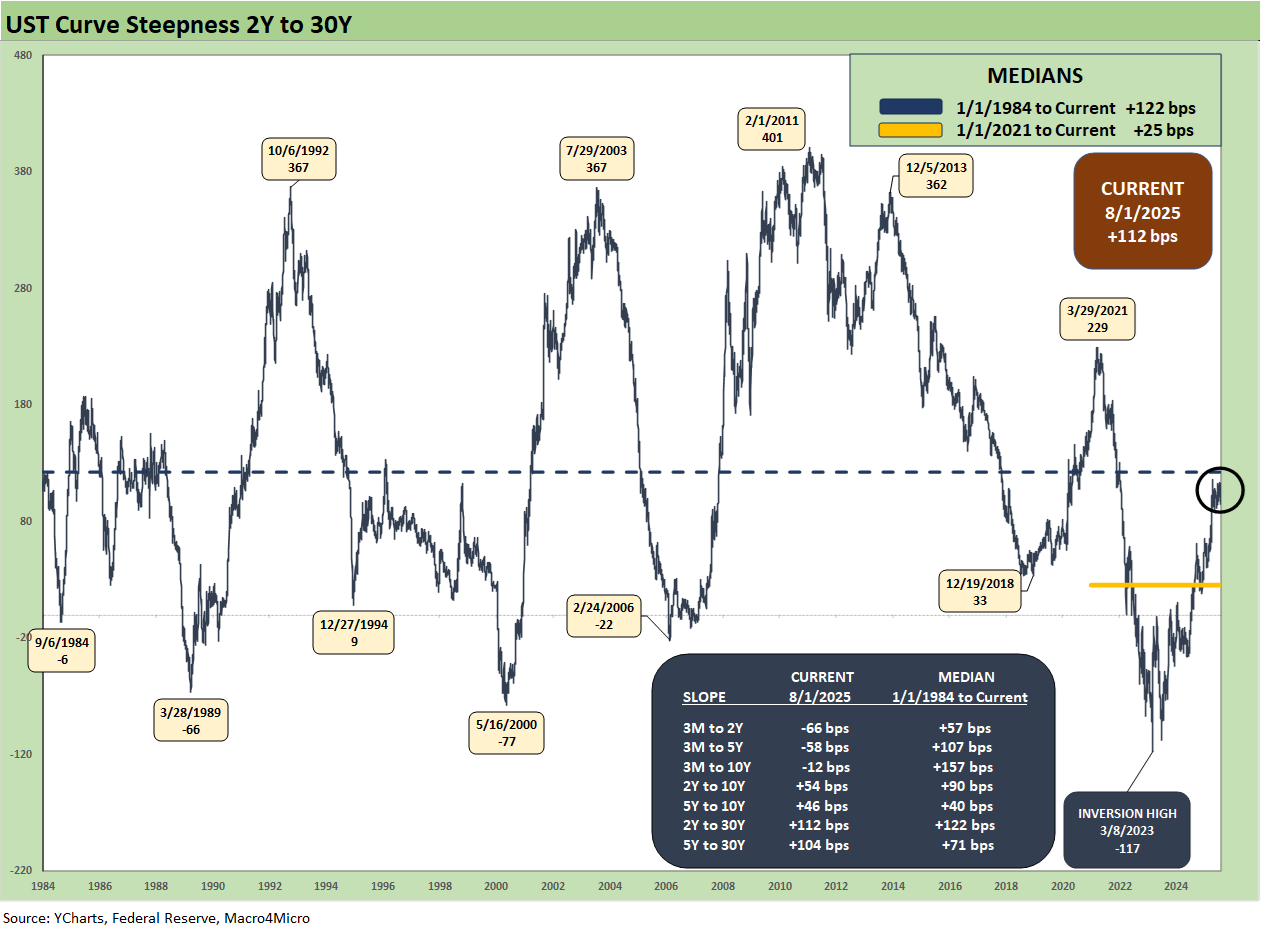
The above chart updates the 2Y to 30Y UST slope after a big move in 2Y and downward shift across the curve. The box within the chart updates the UST curve segments we follow with the latest slope and long-term medians.
The +112 bps on 2Y to 30Y is a long way from the peak inversion in March 2023 of -117 bps. The current slope is also modestly inside the long-term median of +122 bps.
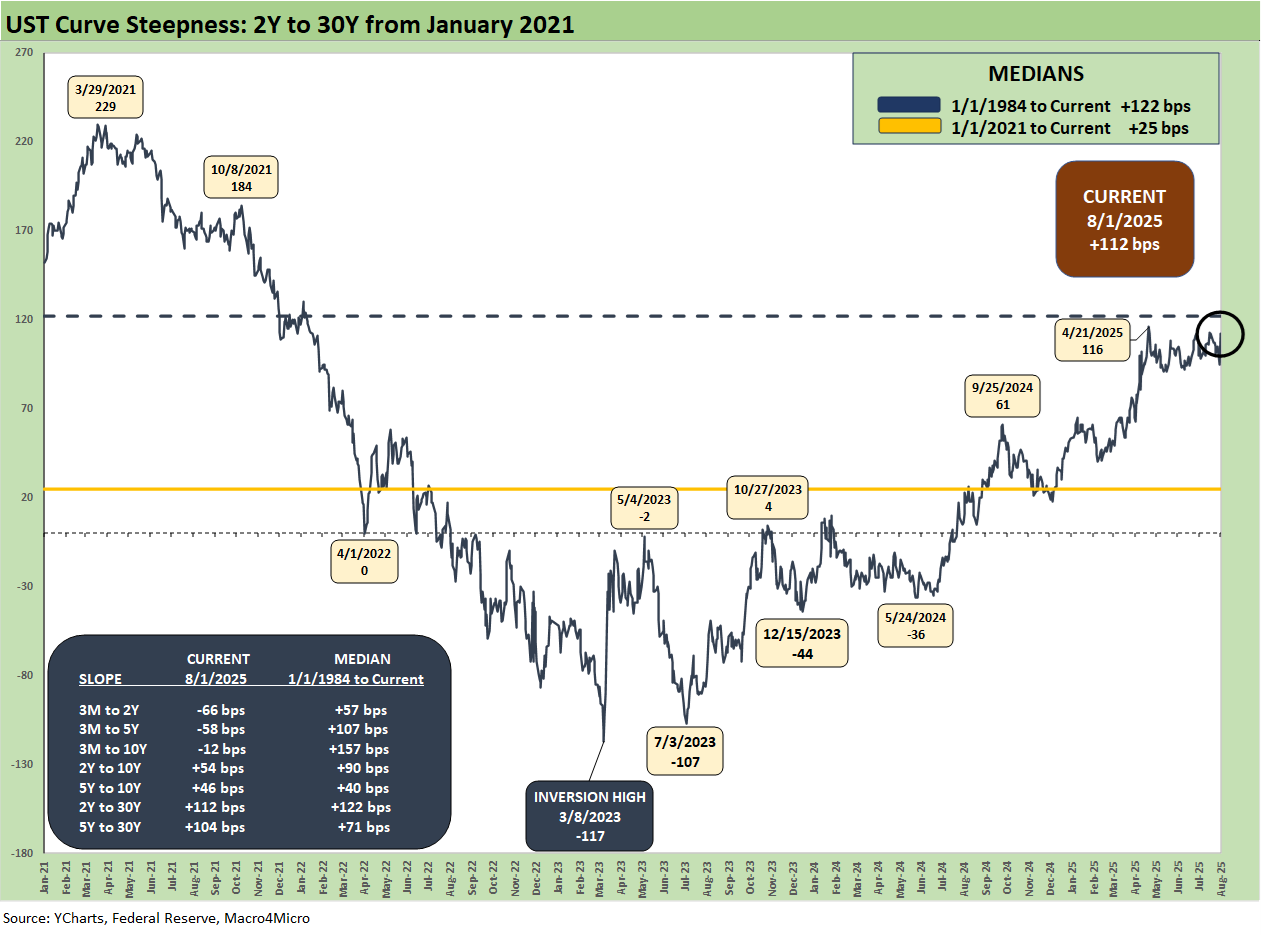
The above chart shortens the timeline to a start date in Jan 2021 when ZIRP was in place. We get better granularity on the post-COVID curve shapeshifting. We see the steepening to a peak of +229 bps in March 2021. Then comes the inversion to a max of -117 bps in March 2023, and then the last leg of the journey back to current levels.
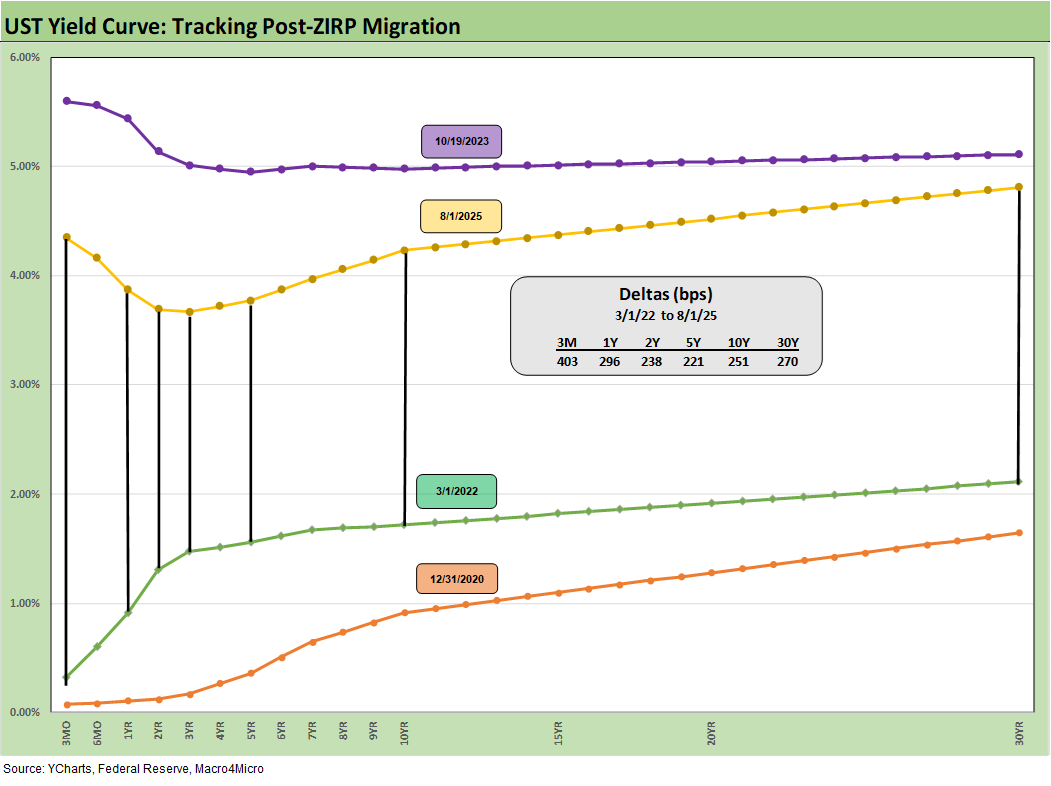
We wrap this week’s State of Yields with an update of the running UST deltas since March 1, 2022 just ahead of the end of ZIRP (effective 3-17-22). We include the 12-31-20 UST curve and 10-19-23 peak UST curve as frames of reference.
See also:
Footnotes & Flashbacks: Asset Returns 8-3-25
Mini Market Lookback: Welcome To the New World of Data 8-2-25
Happiness is Doing Your Own Report Card 8-1-25
Payrolls July 2025: Into the Occupation Weeds 8-1-25
Employment July 2025: Negative Revisions Make a Statement 8-1-25
Employment Cost Index 2Q25: Labor in Quiet Mode 7-31-25
PCE June 2025: Prices, Income, and Outlays 7-31-25
2Q25 GDP: Into the Investment Weeds 7-30-25
2Q25 GDP: First Cut of Another Distorted Quarter 7-30-25
United Rentals: Cyclical Bellwether Votes for a Steady Cycle 7-29-25
JOLTS June 2025: Lower Openings and Hires, Higher Layoffs YoY and Flat MoM 7-29-25
Footnotes & Flashbacks: Credit Markets 7-28-2025
Mini Market Lookback: Mixed Week Behind, Big Week Coming 7-26-25
Durable Goods Jun25: Air Pocket N+1 7-25-25
Taylor Morrison 2Q25: Resilient but Feeling the Same Macro Pressure 7-25-25
New Home Sales June 2025: Mixed Bag 7-24-25
Existing Home Sales June 2025: The Math Still Doesn’t Work 7-23-25
PulteGroup 2Q25: Still-Lofty Margins see a Mild Fade 7-23-25
D.R. Horton 3Q25: Material Slowdown Still Good Enough 7-22-25
Housing Starts June 2025: Single Family Slips, Multifamily Bounces 7-18-25
Mini Market Lookback: Macro Muddle, Political Spin 7-19-25
Housing Starts June 2025: Single Family Slips, Multifamily Bounces 7-18-25
Retail Sales Jun25: Staying Afloat 7-17-25
June 2025 Industrial Production: 2Q25 Growth, June Steady 7-16-25
CPI June 2025: Slow Flowthrough but Starting 7-15-25
Mini Market Lookback: Tariffs Run Amok, Part Deux 7-12-25
Mini Market Lookback: Bracing for Tariff Impact 7-5-25
Asset Return Quilts for 2H24/1H25 7-1-25
JOLTS May 2025: Job Openings vs. Filling Openings 7-1-25
Midyear Excess Returns: Too little or just not losing? 7-1-25