
Footnotes & Flashbacks: Asset Returns 8-3-25
A very rough week for economic data and policy governance takes equities to the woodshed and raises cyclical angst.


New BLS data head to bring in some Trumpian analytical tools.
A very big week for econ data across inflation and employment, consumer income and outlays, GDP growth, and basic policy common sense sent equities and UST rates lower and credit spreads wider. For now, GDP is not cooperating with the “Golden age” theme as soft consumer and fixed investment line items in the 2Q25 were unfavorable since you get below the headline distortions (see Mini Market Lookback: Welcome To the New World of Data 8-2-25, 2Q25 GDP: First Cut of Another Distorted Quarter 7-30-25).
The job numbers on Friday saw material restatements for a weak rolling 3-month tally that was the worst since COVID. That development will have a more lasting impact than it might have since Trump immediately sacked the BLS data head in a move that gives too many market participants flashbacks to other behavior patterns which amount to “everything is rigged unless I win” (see Happiness is Doing Your Own Report Card 8-1-25). With an unprecedented, massive tariff program underway, models and sampling techniques should hardly be a surprise (Anyone remember LTCM in 1998? The “correlation crisis” of 2005?)
The explanation for revisions and how models often get roiled by “event risk” is logical as the reactions to tariffs and mass deportation in many pockets of the economy since the Liberation Day headlines were bound to show up in payrolls and hiring plans and notably in the small business sector that Bessent et al. avoid speaking about (see Payrolls July 2025: Into the Occupation Weeds 8-1-25, Employment July 2025: Negative Revisions Make a Statement 8-1-25).
As we saw in the CPI release and PCE price indexes, granular product buckets are showing inflation signals with the tariff transactions slowly flowing into place. We are still very early in the working capital cycles and tariff flow-through effects with a lot more to come in Section 232 tariffs (notably semis and pharma). Stagflation will heat up as a topic. Firing the stat providers will damage credibility of data given the “autocrat ax grinder effects” many will see. That said, the aisles and the check-out counter cannot be fired on the inflation data side of the equation (see PCE June 2025: Prices, Income, and Outlays 7-31-25, CPI June 2025: Slow Flowthrough but Starting 7-15-25). You can run but you cannot hide from the dismal science of economics.
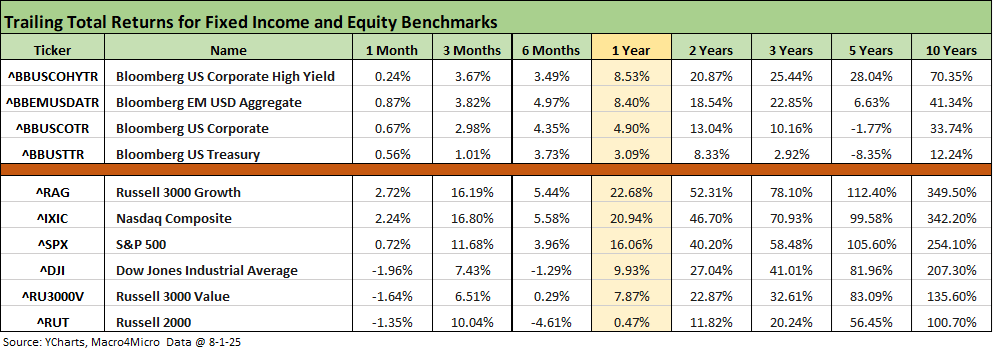
The week was hard on equities as the market’s view of fundamental trends and cyclical prospects is taking on some water. That is evident in the table above where we look at the high-level debt and equity classes we track. For the 1-month time horizon, equities moved notably lower with 3 lines in the red after registering all positive in last week’s rolling 1-month numbers that showed all positive numbers with 4% and 5% handles.
The worst of the lot looking back across 6 months and 1 year remains the small cap Russell 2000. It is worth highlighting that the weak small caps hint at bigger problems down the food chain in the small business sector and over in the long tail of private companies from small to mid who are not out in the public domain explaining the moving parts of tariffs and how it affects their businesses. Looking around the small business trade sites and retail trade groups is illuminating (not in a good way).
With potential hiring freezes rolling into place and/or downsizing to mitigate tariff impacts, the fact that jobs weakened materially over 3 months in May, June, and July since the Liberation Day spiral in April is not a shock. The Trump tariff action would have to go into the bucket of “six standard deviation events,” and those usually screw up model design and survey assumptions that lead to surprises and material deviations…and necessary revisions. “That was not in my model” has sent more than a few quants diving under their desks over the years. The short timeline to tariff effects looks more logical than a function of “rigged” economic releases. The fact that they were all positive job adds could very well change, and perhaps Team Trump will look to head that off in an attack on the career data providers.
For debt, the UST curve was supportive, but HY spreads gapped wider as we already covered in Mini Market Lookback: Welcome To the New World of Data 8-2-25. The bull steepening of the UST for the week saw a big move lower in the 1Y and 2Y UST with double digit declines from 1Y to 30Y.
The FOMC debate could quickly change if the August economic release calendar shows more weakness in the trenches across the wide range of reports. The focus on CPI/PPI and later PCE will be upping the ante with some more time elapsed in working capital cycles and the slow and steady absorption of tariff expenses as the tariff checks get written by the buyer to customs (once again, try to get the White House to admit that).
The rolling return visual
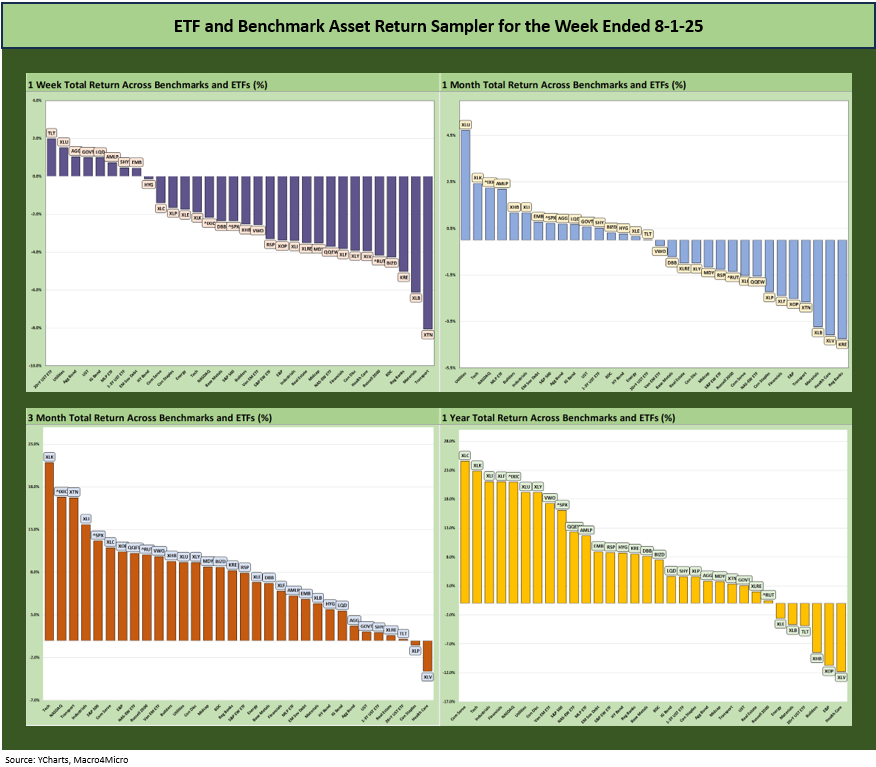
In the next section, we get into the details of the 32 ETFs and benchmarks for a mix of trailing periods. Below we offer a condensed 4-chart view for an easy visual on how the mix of positive vs. negative returns shape up. This is a useful exercise we do each week looking for signals across industry groups and asset classes.
The more recent symmetry is now shifting in a negative direction as flowthrough effects of tariffs show up in the June quarter guidance and more macro releases deliver hard data showing the early effects of tariffs and the intrinsic uncertainty of the economic variables that can stall investment and delay project planning.
The market will be rolling into July quarterly reports from retailers in coming weeks, and those low margin businesses feel tariffs in dramatic fashion. The impact of tariff and anxiety around strategic capex planning was in evidence in the 2Q25 GDP advance estimate numbers (see 2Q25 GDP: Into the Investment Weeds 7-30-25, 2Q25 GDP: First Cut of Another Distorted Quarter 7-30-25).
The Magnificent 7 heavy ETFs…
Some of the benchmarks and industry ETFs we include have issuer concentration elements that leave them wagged by a few names. When looking across some of the bellwether industry and subsector ETFs in the rankings, it is good to keep in mind which narrow ETFs (vs. broad market benchmarks) get wagged more by the “Magnificent 7” including Consumer Discretionary (XLY) with Amazon and Tesla, Tech (XLK) with Microsoft, Apple, and NVIDIA, and Communications Services (XLC) with Alphabet and Meta.
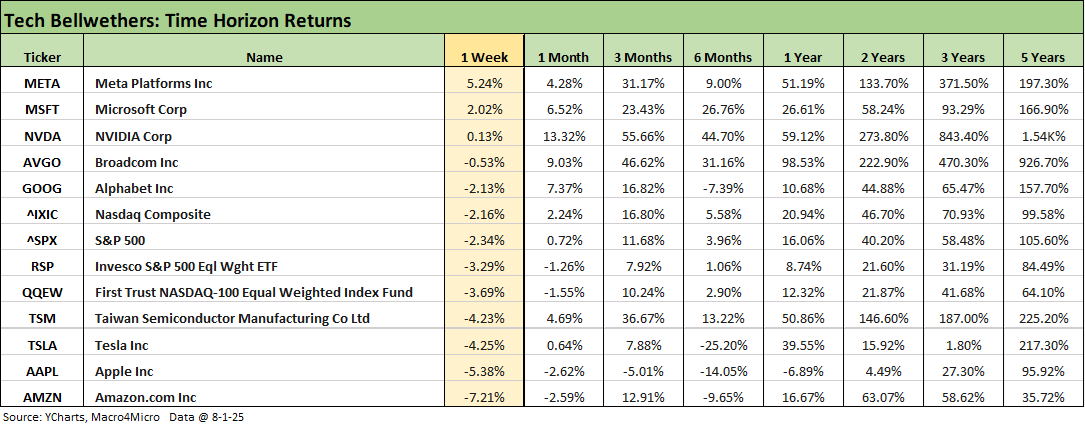
We already covered the tech bellwether trend for the past week in our Mini Market Lookback: Welcome To the New World of Data (8-2-25). We see an overall poor performance, but META and MSFT were able to generate positive numbers on strong earnings. We see 3 Mag 7 names in the top 3 slots above and 3 Mag 7 names in the bottom 3 slots with Alphabet at least beating the NASDAQ and QQEW.
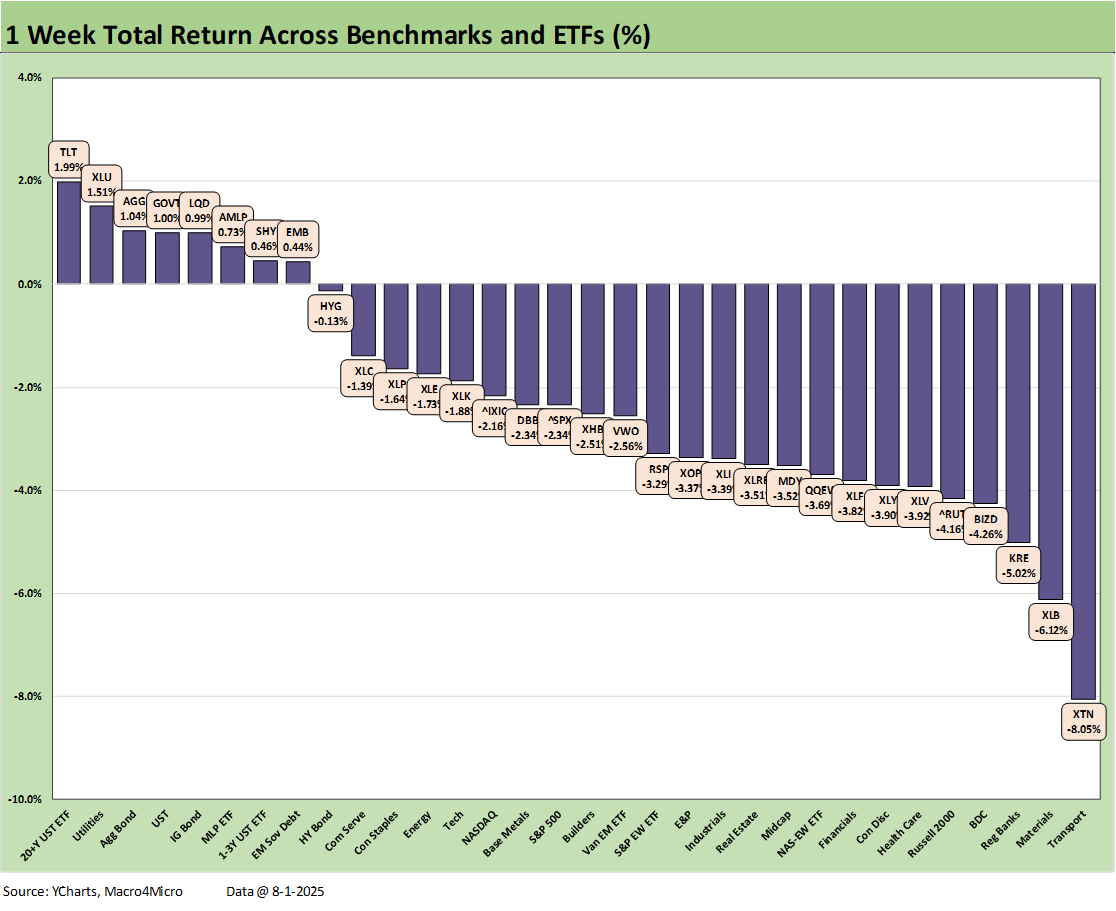
The 1-week returns on the 32 benchmarks and ETFs we track were covered in yesterday’s Mini Market Lookback: Welcome To the New World of Data (8-2-25). The 8-24 positive to negative score included 6 bond ETFs in the 8 positive returns. Among bond ETFs, only HY (HYG) was slightly negative as notable spread widening of +29 bps on the week tipped the scale and more than offset positive UST returns in HY. The Utilities ETF (XLU) and the income-heavy Midstream ETF (AMLP) also made the top quartile.
The biggest losers on the right include some ETFs seeing the side effects of tariffs and increased cyclical uncertainty after a bad week of numbers and shrill headlines. For those trying to make sense of angry headlines, just think back to the asset class pain of 2018 when Trump was trying to fight the tape on sheer force of personality. The 2018 year was one of the worst for leading asset classes since the birth of indexes with cash a rare winner in asset rankings under 2% (see Histories: Asset Return Journey from 2016 to 2023 1-21-24, Past-Prologue Perspective for 2025: Memory Lane 2018 6-5-25).
We remember 2018-2019 as a stretch where Trump advisors and some high-level supporters were saying he was undoing the good of the Dec 2017 tax bill with his tariff threats and attacks on NAFTA (soon USMCA). Today’s tariff backdrop dwarfs what was going on back then. In fact, Powell and the FOMC had to ride to the rescue in 2H19 with easing as capex and exports weakened. The 2018-19 stretch was during a period that Trump calls his “Greatest Economy Ever.”
Powell and the FOMC came to Trump’s rescue again in March 2020 with a series of initiatives that saved the credit markets and headed off a potential bank panic on credit line drawdowns. The Project 2025 crowd would ban the ability of the Fed to navigate such markets under the “reform” goals to control and restructure the Fed. The 2020 election would have been an even bigger landslide loss for Trump if the FOMC had not stepped in (no good deed goes unpunished, etc.).
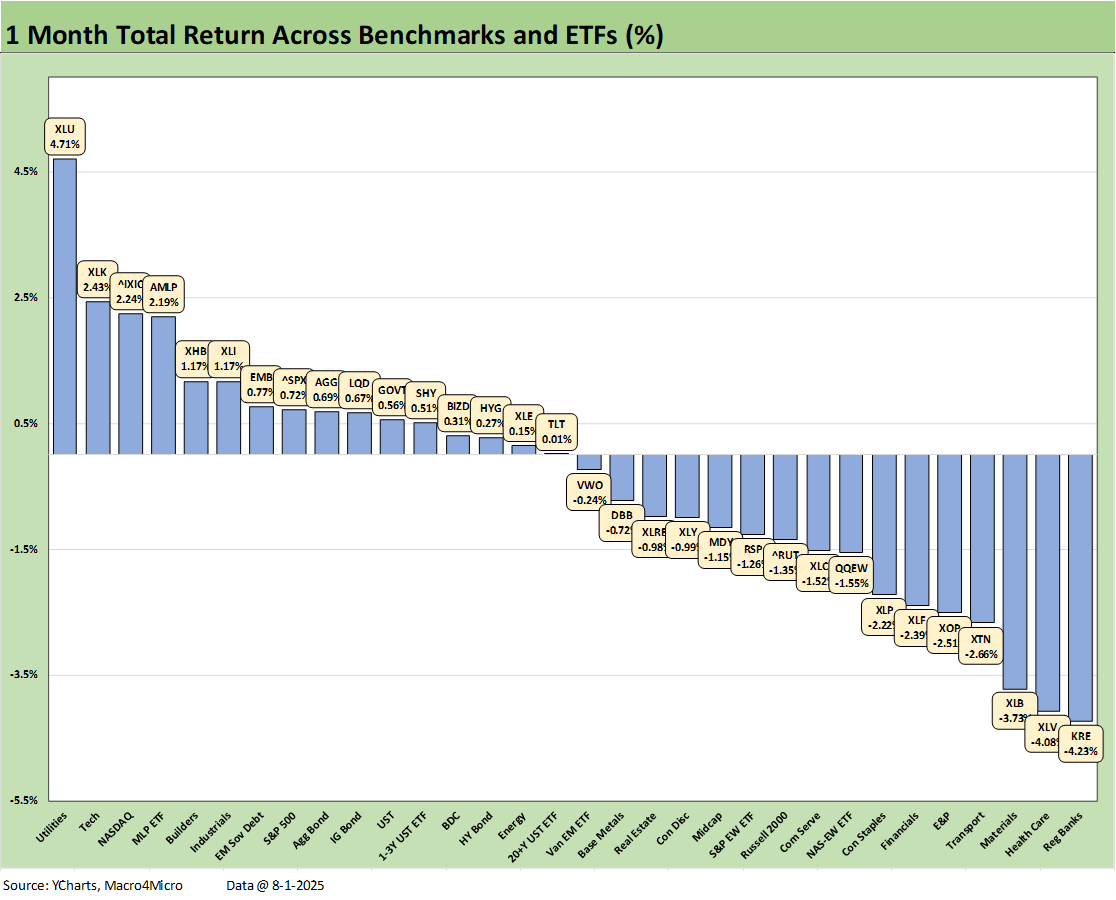
The 1-month score was 16-16 on positive vs. negative. Utilities led the pack in the top 3 followed by Tech (XLK) and NASDAQ. The residual effects of the post-Liberation Day bounce was still working for some sectors and notably including Industrials (XLI) in the top tier. All 7 bond ETFs were positive with the long duration UST ETF (TLT) barely positive. The large cap benchmarks (NASDAQ, S&P 500) were positive but Midcaps and Small Caps were in the red.
The worst performers included some of the usual suspects from recent weeks with Health Care (XLV) and Transports (XTN), but Regional Banks (KRE) weakened coming out of earnings season. The broad Financials ETF (XLF) also found its way into the bottom quartile after a good start to earnings season was rolled back in a negative trailing month.
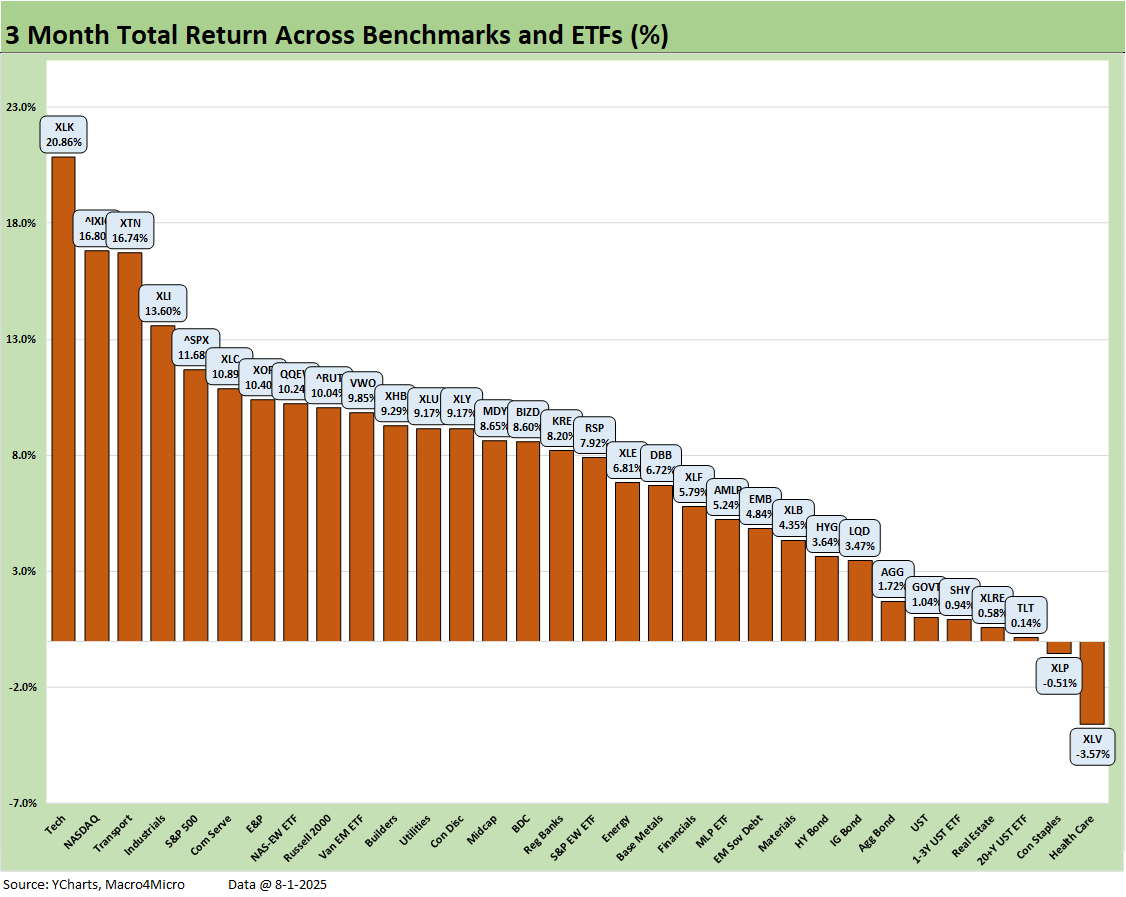
The 3-month timeline still shows the post-panic rally after the Liberation Day plunge as the score of 30-2 sums it up. The best performers included tech asset lines (4 of the 8 in the top quartile), Transport (XTN) and Industrials (XLI). Only Health Care (XLV) and the defensive Consumer Staples (XLP) were in the red.
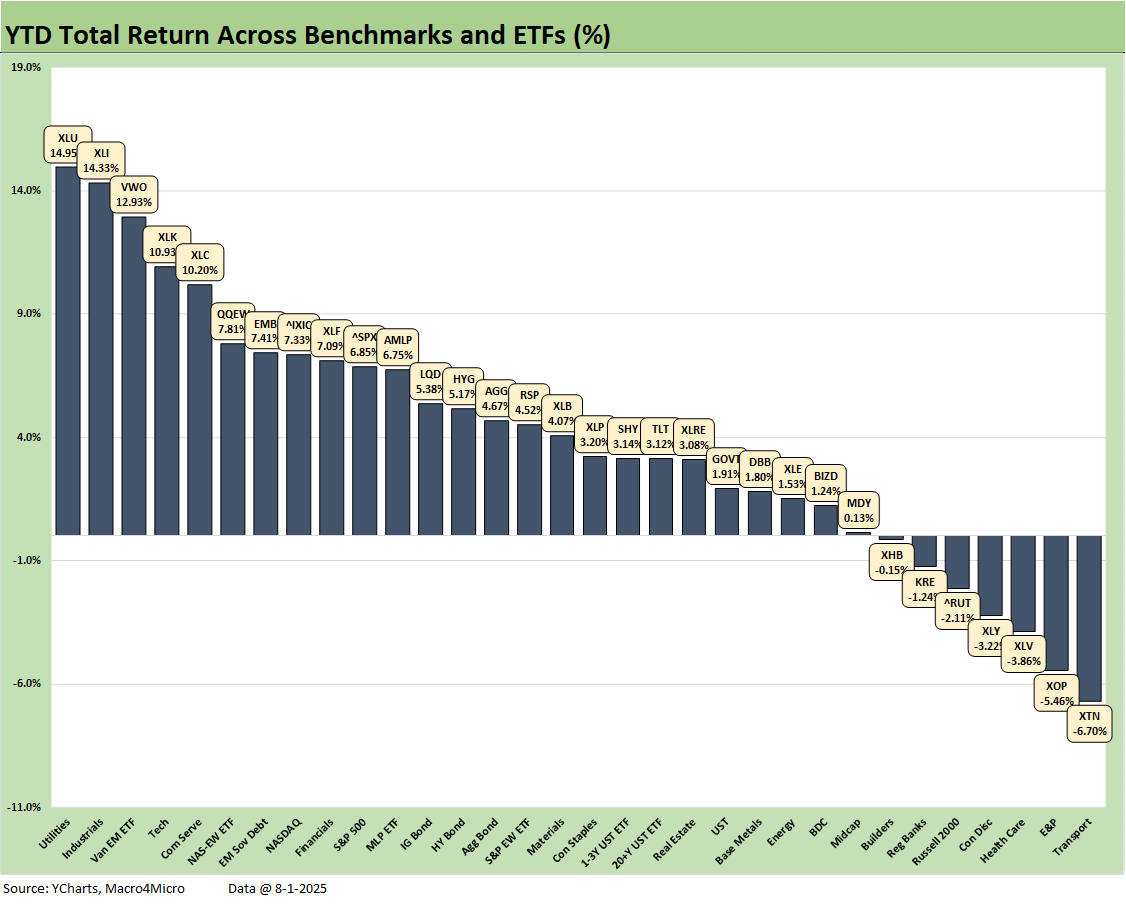
The YTD timeline score of 25-7 shows the breadth and depth of the cyclical resilience seen for most of 2025 with the top quartile showing Utilities (XLU) at #1 and Industrials (XLI) at #2. That said, EM Equities (VWO) was at #3 and international markets have beaten the S&P 500 as highlighted in our weekly Mini Market note. Below the top 3, the top quartile sees 4 of the next 5 in the tech-centric bucket with the Tech ETF (XLK), Communications Services (XLC), the Equal Weight NASDAQ 100 (QQEW), and NASDAQ (IXIC).
We see EM Sovereign debt (EMB) as the only bond ETF in the top tier. The other bond ETFs show 3 of 7 in the second quartile and 3 of 7 in the third quartile and all of them in positive range.
The bottom dwellers YTD show Transports (XTN) in dead last YTD in the “year of tariffs.” E&P (XOP) is second to last with weak oil. WTI was near $60 as recently as May and currently just over $67 to end the week. That comes after oil pushed right through the Middle East turmoil with a brief wave. Many are still waiting to see if Russian and Iranian supply finds a way into the market on a grand scale. For now, Trump has turned into a “hard guy” on Russian oil supply as he battles with India on trade. Health Care (XLV) has been a recurring headline crisis from tariffs and “forced relocation” to unilateral price control threats. RFK does not help.
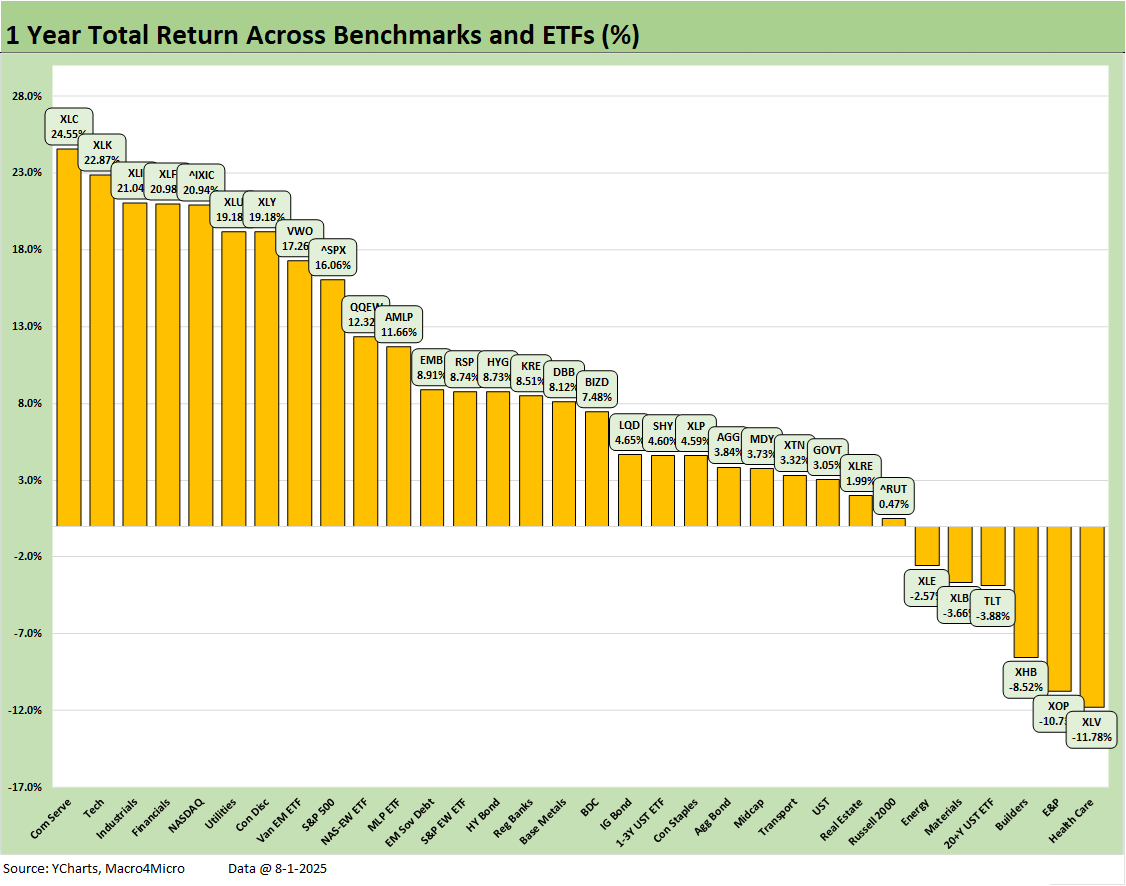
The LTM period posted a score of 26-6. The run rates above include almost 5 months of the 2024 banner year in equities. The year 2024 was Part 2 of the best 2-year run in the S&P 500 since the late 1990s, so that sets a high bar (see Footnotes & Flashbacks: Asset Returns for 2024 1-2-25). The combined 2023-2024 return on the S&P 500 of +45% cumulative for two years and +25% for 2024, respectively, will be very hard to match in 2025-2026. As of now, the S&P 500 is +6.85% YTD 2025.
The broad market benchmark performance in 2023-2024 on the way to the LTM 2025 above undermines the weak premise of the Trump rhetoric that the country was “dying” until Trump came along. Asset returns and economic numbers seldom get in the way of his next round of adjectives and superlatives, but this past week gave him reason to get concerned. August will be a very interesting reporting month for inflation and payrolls again. CPI is out next Tuesday, and the MoM rates by product line will be getting a lot of focus.
One question to consider is whether the CPI and PCE inflation research team should dust off their resumes?
See also:
Mini Market Lookback: Welcome To the New World of Data 8-2-25
Happiness is Doing Your Own Report Card 8-1-25
Payrolls July 2025: Into the Occupation Weeds 8-1-25
Employment July 2025: Negative Revisions Make a Statement 8-1-25
Employment Cost Index 2Q25: Labor in Quiet Mode 7-31-25
PCE June 2025: Prices, Income, and Outlays 7-31-25
2Q25 GDP: Into the Investment Weeds 7-30-25
2Q25 GDP: First Cut of Another Distorted Quarter 7-30-25
United Rentals: Cyclical Bellwether Votes for a Steady Cycle 7-29-25
JOLTS June 2025: Lower Openings and Hires, Higher Layoffs YoY and Flat MoM 7-29-25
Footnotes & Flashbacks: Credit Markets 7-28-2025
Footnotes & Flashbacks: State of Yields 7-27-25
Mini Market Lookback: Mixed Week Behind, Big Week Coming 7-26-25
Durable Goods Jun25: Air Pocket N+1 7-25-25
Taylor Morrison 2Q25: Resilient but Feeling the Same Macro Pressure 7-25-25
New Home Sales June 2025: Mixed Bag 7-24-25
Existing Home Sales June 2025: The Math Still Doesn’t Work 7-23-25
PulteGroup 2Q25: Still-Lofty Margins see a Mild Fade 7-23-25
D.R. Horton 3Q25: Material Slowdown Still Good Enough 7-22-25
Housing Starts June 2025: Single Family Slips, Multifamily Bounces 7-18-25
Mini Market Lookback: Macro Muddle, Political Spin 7-19-25
Housing Starts June 2025: Single Family Slips, Multifamily Bounces 7-18-25
Retail Sales Jun25: Staying Afloat 7-17-25
June 2025 Industrial Production: 2Q25 Growth, June Steady 7-16-25
CPI June 2025: Slow Flowthrough but Starting 7-15-25
Mini Market Lookback: Tariffs Run Amok, Part Deux 7-12-25
Mini Market Lookback: Bracing for Tariff Impact 7-5-25
Asset Return Quilts for 2H24/1H25 7-1-25
JOLTS May 2025: Job Openings vs. Filling Openings 7-1-25
Midyear Excess Returns: Too little or just not losing? 7-1-25