
Footnotes & Flashbacks: Asset Returns 4-27-25
A big rally in equities, credit spread contraction, and a minor rally in UST are all part of the recurring volatility theme.


Arms up! Here comes more tariff news!
We saw a 31-1 week for the asset lines we track and 10 of 11 S&P 500 sectors positive along with tighter credit spreads and modestly lower UST rates. That keeps the volatility party going with a slew of numbers ahead this week. We get the 1Q25 GDP advance estimate, another read on PCE inflation (with the income and outlays numbers), JOLTS/payroll and some releases that take on more tariff significance with factory orders and the final durables tally.
Earnings seasons are often useful in calming nerves during periods of potential risk aversion around critical policy debates or systemic worries since we at least can get down into the “price x volume” weeds and see how cost structures and margins are playing out. The trouble for 2025 is that all of those variables could materially shift depending on the tariff policy outcomes from “the pause” in reciprocals, the product tariffs in process, and the lurking threat of more trade partner retaliation.
The weekly rally in HY spreads of -35 bps whittled down the rolling 1-month HY widening to +48 bps while the -7 bps tightening in IG takes the rolling month down to +13 bps.

The above table updates the rolling time horizon returns for the high-level debt and equity benchmarks we watch. For the 1-month period, we still see 3 of 4 in negative range with the UST edging back into the positive zone. For 3 months, we see 3 of 4 positive in debt while 6 months shows all the debt lines in positive range.
Equities are still in pain with 1-month all negative and 3-months all negative including 3 of 6 in double digit negative range. We see 6-months all negative. For the “buy the dip” crowd, that leaves a lot of upside. For those looking at tariffs as a volume headwind and inflation catalyst leading to a downturn, there is a lot more room for dispersion across the mix with many industry groups facing valuation multiple compression on slower growth and lower earnings.
The direction of volumes is about more than just the consumer and extends to capital intensive manufacturing sectors that will see supplier chain costs rise even with volumes declining. That is a bad combination when the risk of trade wars remains high with the EU (#1 trade partner) and the USMCA partners (#2 Mexico and #3 Canada in total trade but #1 and #2 as nations ex-EU bloc). They would join the escalating war with China (#4 trade partner) who is starting to use supply retaliation. The last major action with China was slapping port fees on a range of China interests (see Ships, Fees, Freight & Logistics Pain: More Inflation? 4-18-25).
The rolling return visual
In the next section, we get into the details of the 32 ETFs and benchmarks for a mix of the trailing periods. Below we offer a condensed 4-chart view for an easy visual on how the mix of positive vs. negative returns shape up. This is a useful exercise we do each week looking for signals across industry groups and asset classes.
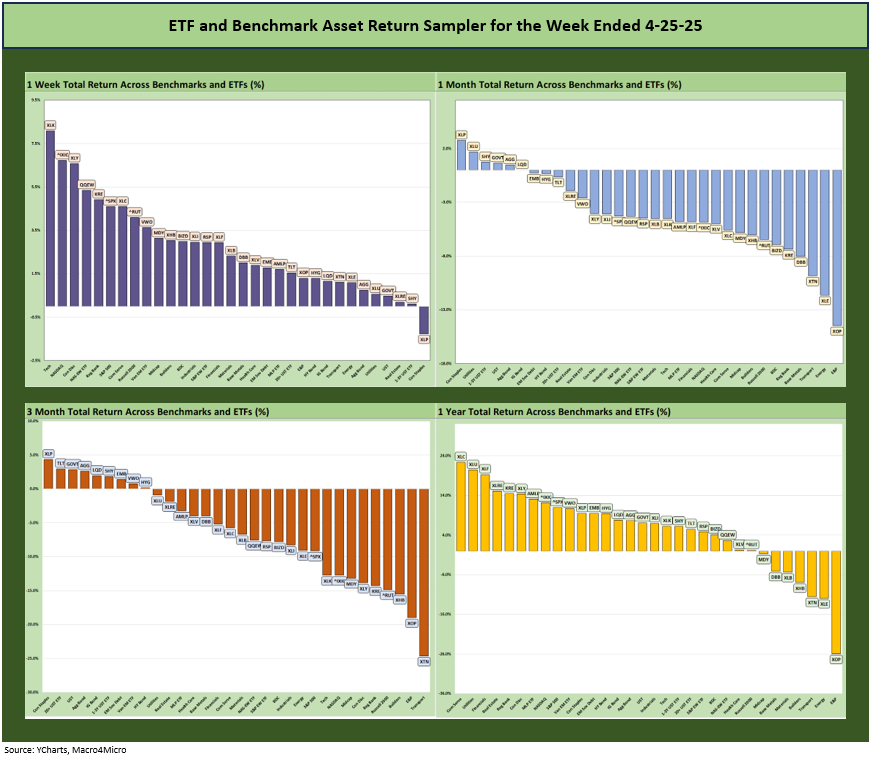
The positive vs. negative symmetry of the 1-month and 3-month time horizons have been the headline grabbers as we detail in the commentary below. We also added back a YTD timeline (not shown above) that stands at 13-19. While the full mix is important, the broad benchmarks (S&P 500, NASDAQ, Midcap and Small Caps) are all negative YTD with NASDAQ and Russell 2000 in the bottom quartile.
The Magnificent 7 heavy ETFs…
Some of the benchmarks and industry ETFs we include have issuer concentration elements that leave them wagged by a few names. When looking across some of the bellwether industry and subsector ETFs in the rankings, it is good to keep in mind which narrow ETFs (vs. broad market benchmarks) get wagged more by the “Magnificent 7” including Consumer Discretionary (XLY) with Amazon and Tesla, Tech (XLK) with Microsoft, Apple, and NVIDIA, and Communications Services (XLC) with Alphabet and Meta.
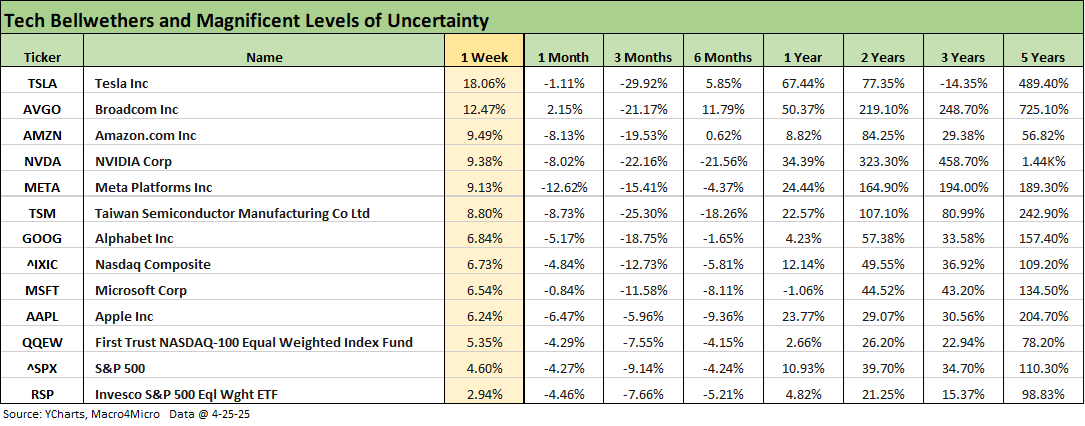
As we discussed already in Mini Market Lookback: Earnings Season Painkiller (4-26-25), it was a banner week for the tech bellwethers even if the 1-month and 3-month pain lives on. The 6-month period shows more rational differentiation and divergence across names and includes the post-election period since Nov. The more important timeline is 1-month and 3-months since that is when Trump put his policy cards on the table – notably so over 1-month.
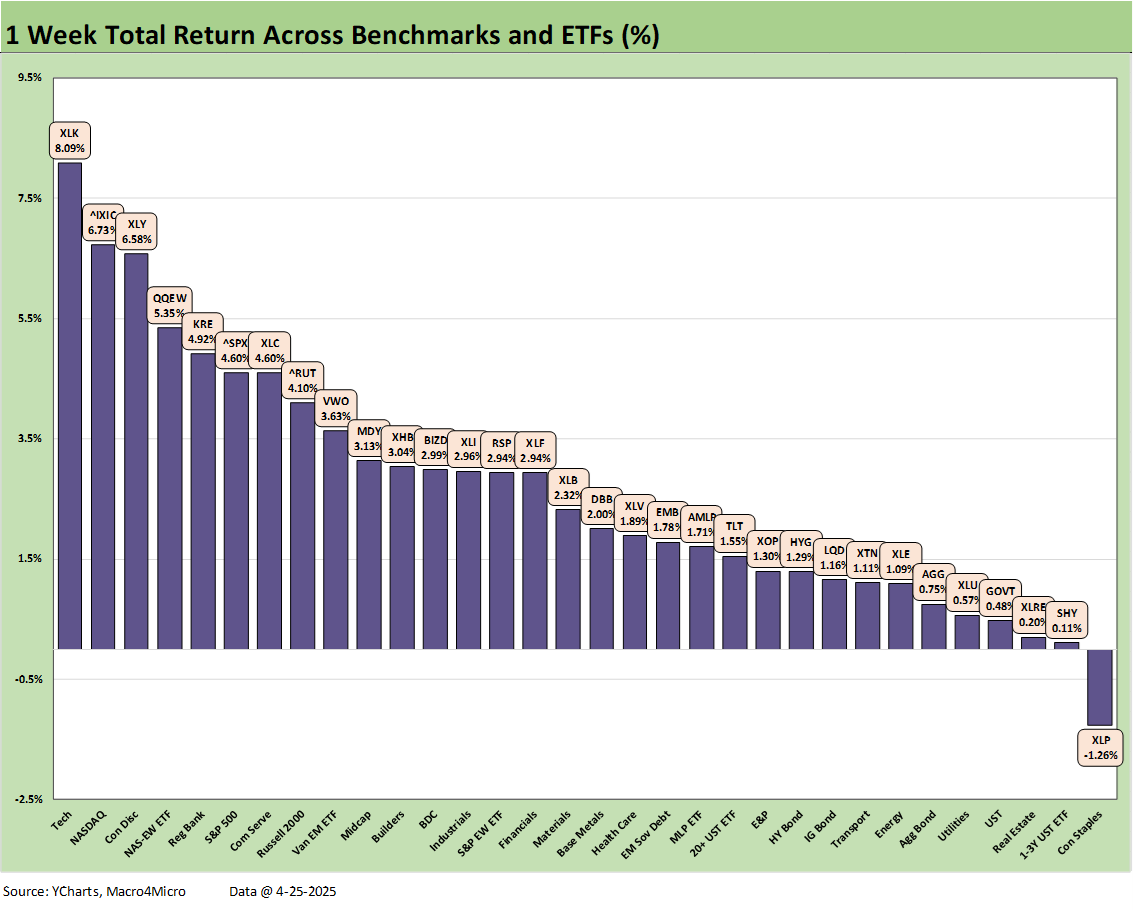
The above chart shows our 32 asset lines with a score of 31-1 with only the defensive Consumer Staples ETF (XLP) in slightly negative range after XLP was near the top during the worst of the trade market meltdown. All 7 bond ETFs were positive. We see 6 of 8 in the top quartile heavily wagged by Mag 7 or tech heavy ETFs. Regional Banks (KRE) and Russell 2000 (RUT) also joined the top quartile.
We looked at the 1-week chart already in Mini Market Lookback: Earnings Season Painkiller (4-26-25). In that note, we looked at some of the tariff commentary from the “100 Days” Time Magazine cover story interview. Trump’s tune on tariffs has not changed, and that signals little true flexibility remaining for a policy devoid of facts on one basic foundational reality that the “buyer pays.” He still lives in a destructive fantasy world where the “selling country pays.” He is not sounding like someone looking into real macroeconomic, sea-level industry damage or appreciating pain to the household. Lowering tariffs from triple digits to something like 50% is not flexibility. It is a mind game.
The 31-1 scoresheet above for the past week is part of the ebb and flow of volatility (“volatility” implies up and down). At this point, we cannot even get a straight story whether China and US are talking. China has an interest at this point in the US economy (read “voter”) getting a taste of what the real-world ramifications are of these Trump tariff policies. Then the US will see what they really mean. Meanwhile, Trump is scrambling to manage market reactions via jawboning and select pauses. To quote the legendary Joe Louis: “You can run but you cannot hide!” The tariff transaction reality and supply-demand imbalances are on the way and require real policy corrections.
The capital markets are like the ground level economic activity at this point. You cannot hide from the “empty shelf” image Trump heard when he met with major retailers nor can we hide from the slowly gathering headlines about freight and logistics imbalances and potential meltdowns (shipping, container, trucks, etc.). The same will be the case as the tariffs broad (nation) and narrow (products) flow into prices. The consumer and small businesses will need to make purchasing decisions. Retrenchment could include cost cutting actions to mitigate the damage (think layoffs).
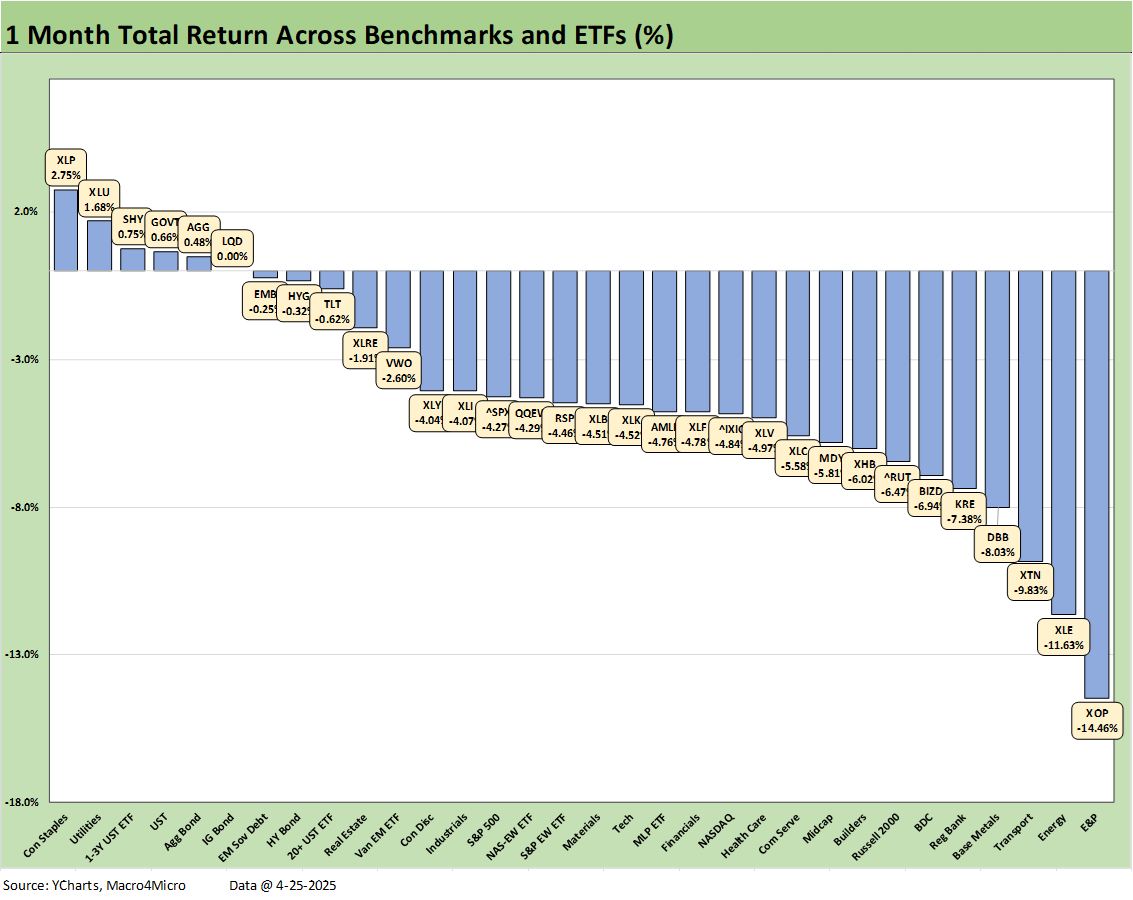
The 1-month score of 6-26 shows 4 bond ETFs in positive range with the #1 ranked asset being the defensive Consumer Staples ETF (XLP) and #2 is Utilities (XLU). The top quartile showed 6 of 8 comprised of bond funds. Only 2 asset lines exceeded 1%.
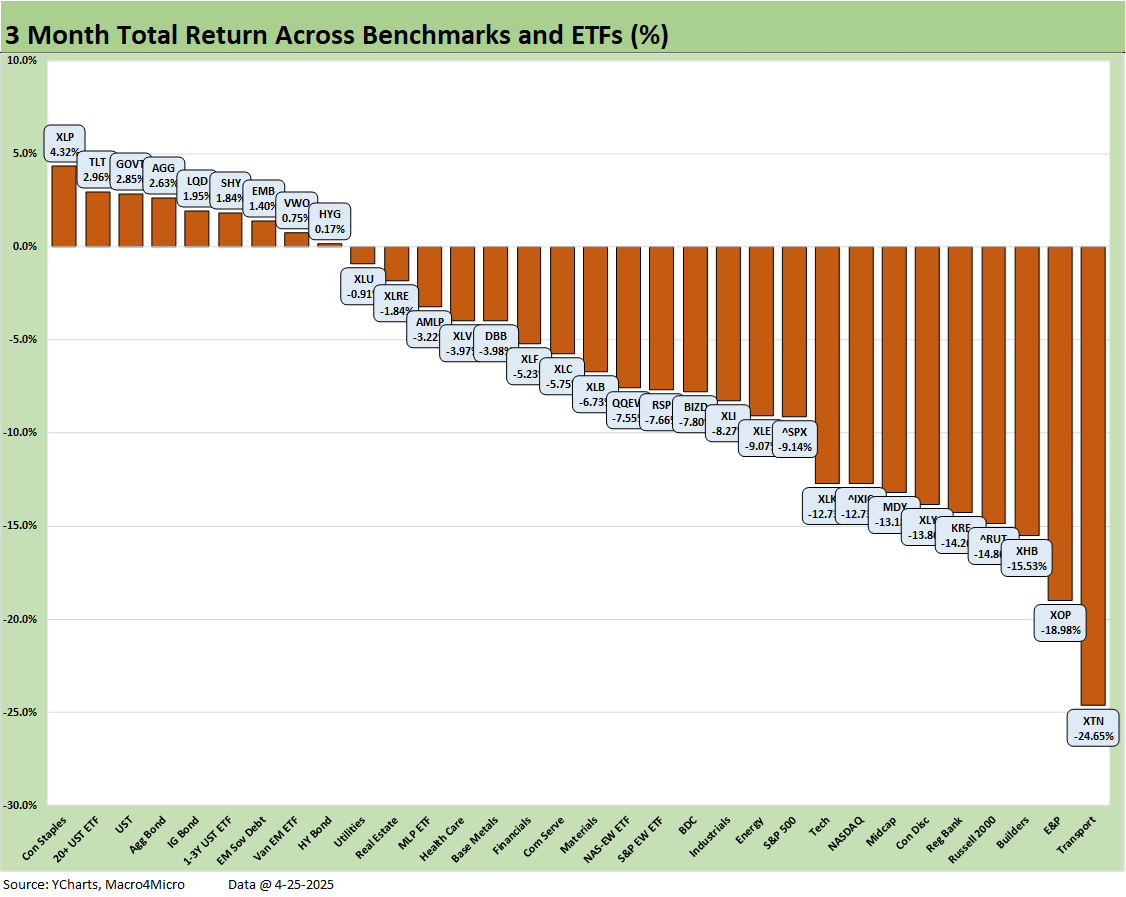
The 3-month scoresheet was 9-23 with 7 of the 9 being bond ETFs. For the top quartile, 6 of 8 were bond ETFs with the defensive Consumer Staples ETF (XLP) at #1 and the EM Equity ETF (VWO) at the bottom of the top quartile and HY (HYG) just across the line with the lowest positive return. We see 3 of the 4 major benchmarks (NASDAQ, Russell 2000, Midcaps) in the bottom quartile with the S&P 500 near the bottom of the third quartile.
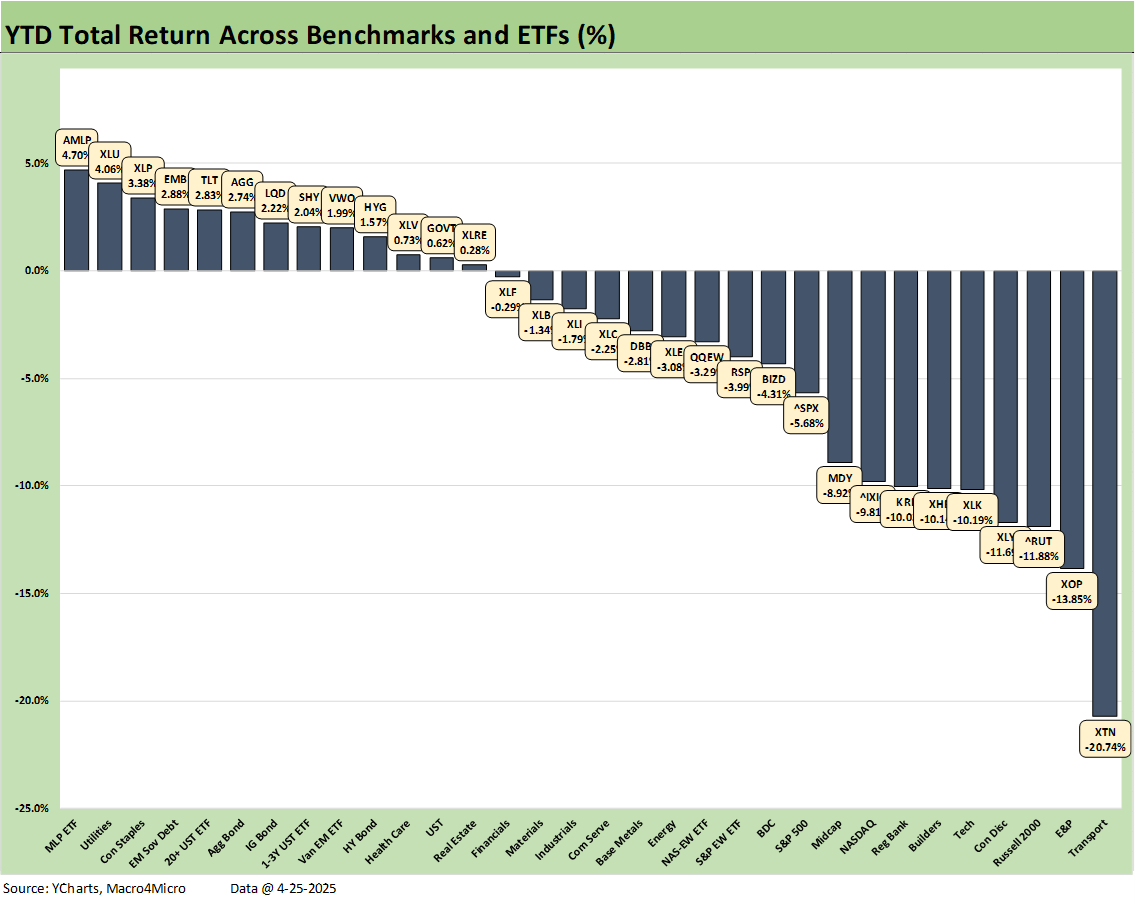
The YTD timeline shows a score of 13-19 with 7 of the 13 positive returns comprised of bond ETFs, leaving only 6 equity ETFs in positive range. We see 2 of the 4 broad market benchmarks (NASDAQ and Russell 2000) in the bottom quartile and negative and the other 2 broad market benchmarks (S&P 500, Midcaps) just across the line in the bottom of the third quartile with those negative as well.
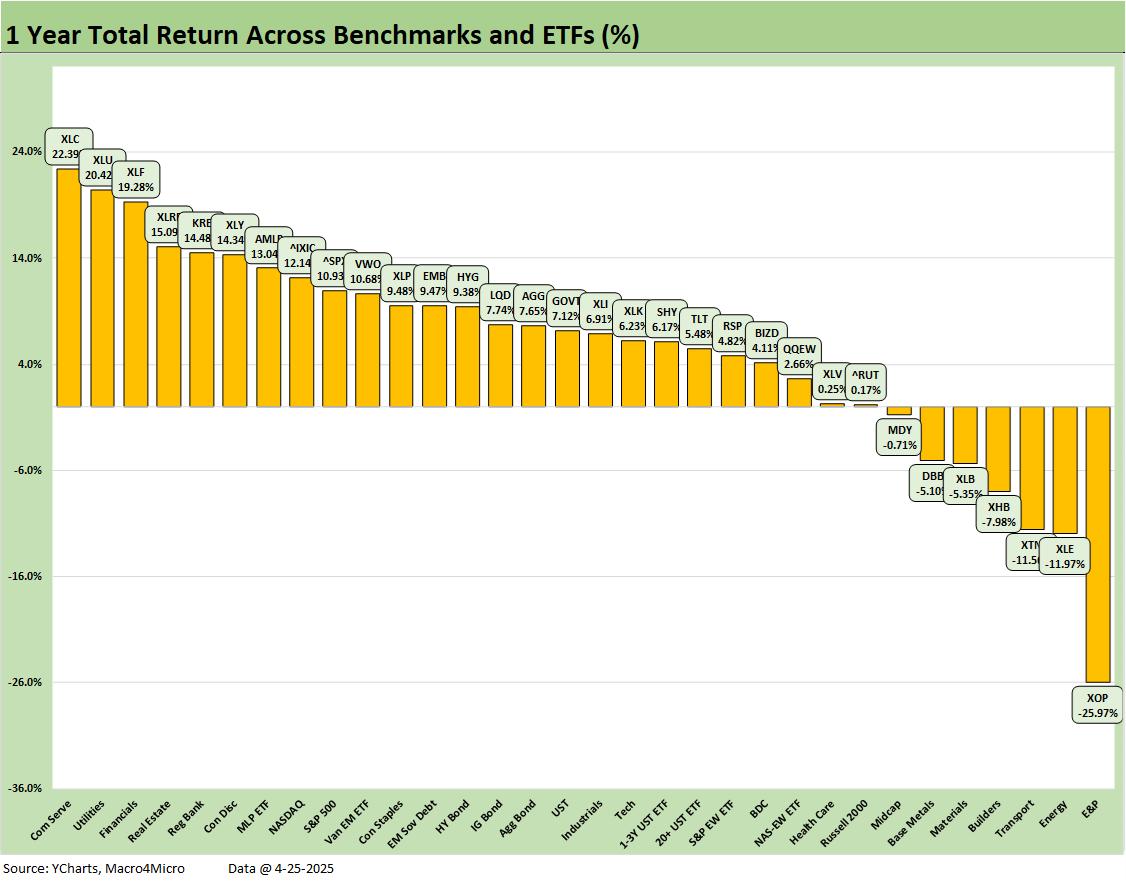
The trailing 1-year results got some respite from negative symmetry creep as it weighed in at 25-7 after so much of 2024 saw positive scores in the 30 area coming off two banner years for equities.
See also:
Mini Market Lookback: Earnings Season Painkiller 4-26-25
Existing Home Sales March 2025: Inventory and Prices Higher, Sales Lower 4-24-25
Durable Goods March 2025: Boeing Masking Some Mixed Results 4-24-25
Equipment Rentals: Pocket of Optimism? 4-24-25
Credit Snapshot: Herc Holdings (HRI) 4-23-25
New Home Sales March 2025: A Good News Sighting? 4-23-25
Footnotes & Flashbacks: Credit Markets 4-21-25
Footnotes & Flashbacks: State of Yields 4-20-25
Footnotes & Flashbacks: Asset Returns 4-20-25
Mini Market Lookback: The Powell Factor 4-19-25
Ships, Fees, Freight & Logistics Pain: More Inflation? 4-18-25
Home Starts Mar 2025: Weak Single Family Numbers 4-17-25
Credit Snapshot: Service Corp International (SCI) 4-16-25
Retail Sales Mar25: Last Hurrah? 4-16-25
Industrial Production Mar 2025: Capacity Utilization, Pregame 4-16-25
Credit Snapshot: Iron Mountain (IRM) 4-14-25
Mini Market Lookback: Trade’s Big Bang 4-12-25
Tariffs, Pauses, and Piling On: Helter Skelter 4-11-25
CPI March 2025: Fodder for Spin 4-10-25
Credit Snapshot: Avis Budget Group (CAR) 4-9-25
Payroll March 2025: Last Call for Good News? 4-4-25
Payrolls Mar 2025: Into the Weeds 4-4-25
Credit Snapshot: AutoNation (AN) 4-4-25