
Footnotes & Flashbacks: State of Yields 8-10-25
An adverse UST move this past week sets the stage for the CPI and PPI release and fresh inflation input.


This could get sticky from here…
Over the next 5 weeks, the market will get 3 more inflation releases (2 CPI, 1 PCE) before the FOMC meeting, another round of consumer income and outlays information, another payroll number, and the second estimate for 2Q25 GDP data. The Fed will get the last wave of June quarter reports followed quickly by the July quarter data with a wave of reports from retailers, which are the most exposed to tariffs. That is a lot of ammo for the FOMC to make its decision.
The impact of tariffs will be rolling into the working capital cycles and sourcing strategies and giving companies input for capex planning. They will have more information on Mexico and Canada, but those two trading partners will still be a source of uncertainty. We cannot rule out some extreme scenarios if Trump goes off the rails (USMCA by itself could come under a dark cloud). The period from now until the mid-Sept FOMC meeting (Sept 17-18) will keep markets on edge if CPI and PCE go the wrong way and payrolls hold up.
As of now, the UST curve is flirting with declines that could keep even 2 Fed cuts in Sept in the game if we get fresh weakness in jobs from the tariff impact and more companies hold off on more aggressive repricing strategies. As of now, the case for recession requires a lot more to go wrong (see Macro Menu: There is More Than “Recession” to Consider 8-5-25).
The data quality could roil the UST markets if Team Trump behaves badly as they did on payroll with the attacks on the BLS. The Wall Street Journal was giving more space to Lutnick et al. disbanding the Federal Economic Statistics Advisory Committee (FESAC) and another group that was supposed to advise the BEA. The need for a thorough revamping of government economic data was broadly recognized. Team Trump’s actions and accusations thus feed the theory that this is about control of data as framed in Project 2025 and not about improving data (see Happiness is Doing Your Own Report Card 8-1-25, Mini Market Lookback: Welcome To the New World of Data 8-2-25).
Below we update our rolling State of Yields commentary…
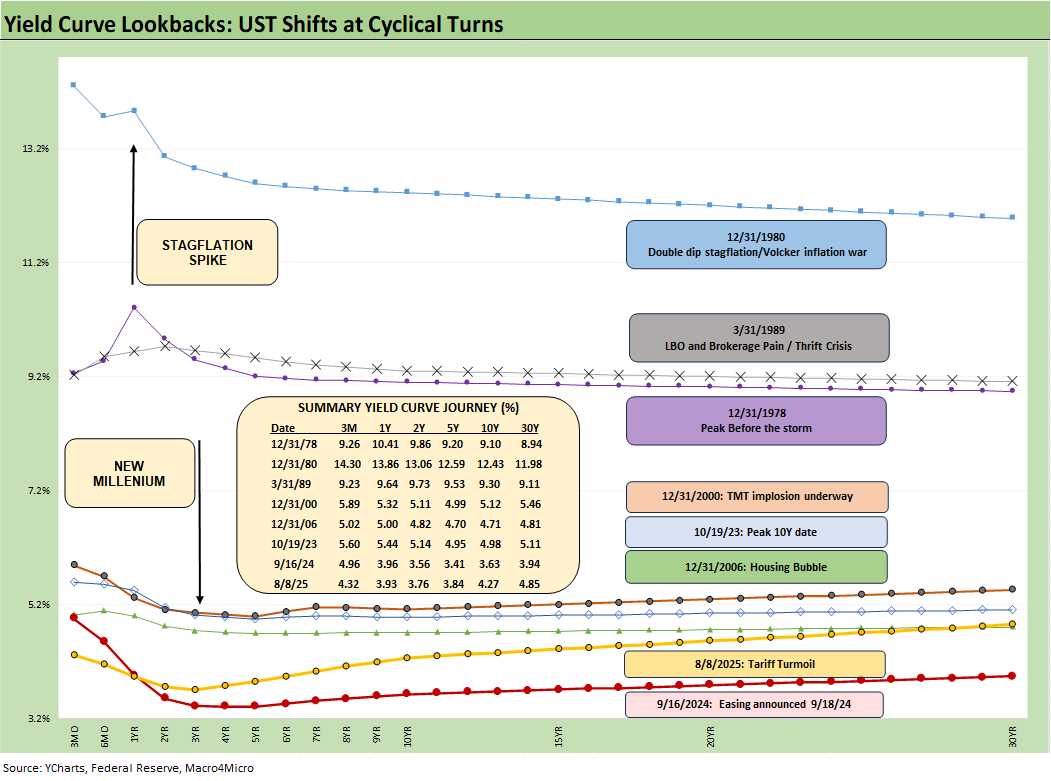
In the above chart, the yield curves plotted span from Carter inversion of 1978 across the Volcker years, the1980s credit cycle peak in 1989 (note the 9.2% 3M UST), the TMT cycle faltering in 2000 (on the way to a massive Greenspan easing in 2001), and the housing bubble in 2006. During the 2004 to 2007 period, leveraged derivative exposure and structured credit was out of control and counterparty risk was soaring. Worth highlighting is that the current 3M UST is notably lower than the pre-crisis, pre-ZIRP 3M UST levels.
The chart then jumps from 2006 to 2023, which takes the market beyond the crisis period and the ZIRP years and COVID. Both the post-credit crisis period and COVID prompted the Fed to deliver a wave of market liquidity support and confidence building programs that helped save the capital markets, reopened the credit markets, reduced refinancing risk anxiety, and reduced the contingent liquidity risk profile of the banks. The credit crisis period from late 2008 and the 2020 COVID crisis period brought plenty of QE and normalization distortions to the yield curve shape.
The market saw a massive move lower and bull flattener to end 2023 after the 10Y UST peaked in Oct 2023 as we review below. Steeper and higher was not the forecast to start 2024 as the market expected flatter and lower. During 2024, the curve moved in an adverse direction with a bear steepener until a major UST rally alongside the Sept 2024 easing. That soon brought us a fresh steepening with some rallies and sell-offs along the way.
The Fed dilemma ahead…
We are now coming up on another FOMC easing crossroad of historical significance given how badly the stagflation of the 1980-1982 double dip recession proved to be in the record books. No respectable economist on the FOMC wants to join the Fed Hall of Shame for failing to guard against stagflation. That was the fate of Arthur Burns as Fed Chair (1970-1978) and to a lesser extent G. William Miller, who bridged the gap until Volcker arrived in 1979.
Powell is made of more “courageous stuff” than to fold (ease) without data support. With Trump touting his first 6 months as the greatest in Presidential history, Trump has a conceptual consistency problem on easing without data support. Trump still has the problem of saying that the seller pays the tariff (again reiterated with India this past week). That means he has power but not much understanding of economics.
The cart and the horse of “weak economy first, easing second” applies in this case, but Trump will not admit to any economic weakness. That frustrates his pitch, so he attacks Powell with insults. When economic weakness shows up (payroll), he goes off the rails and screams “rigged.” History is watching. There are plenty of power-seeking sycophants on hand to take Powell’s job. They are just not in the seat now. They will be soon enough, and the Fed will then be a captive operation even if only informally. Additional changes will require legislation, which Bessent implies is coming at some point. Legislating is more easily talked about than accomplished.
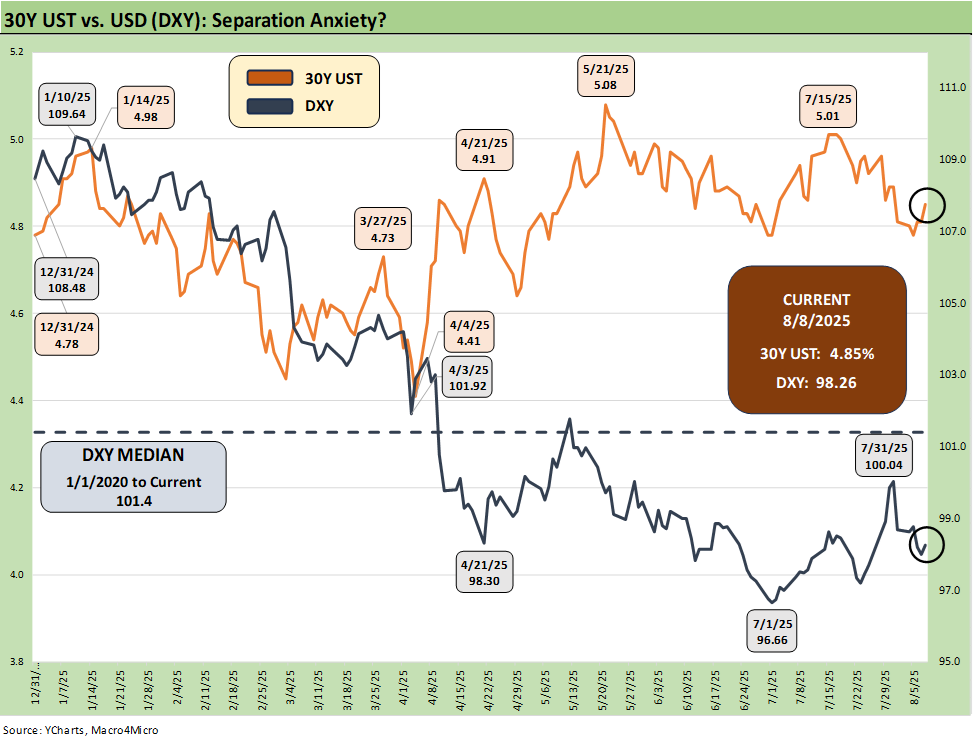
The above chart updates the 30Y UST vs. the dollar index (DXY) from the start of 2025. The April divergence of the 30Y and DXY makes a statement of trouble. The currency vs. tariff playbook has not gone the way that the Ryan-Brady 2017 Border Adjusted Tax playbook (aka “BAT tax”) had promised. That BAT tax plan in 2017 indicated the USD currency adjustments would play out with a stronger dollar – not weaker. Back then, the GOP actually openly called it a “tax” as part of their plan to radically overhaul the corporate tax system.
The idea of the BAT tax was to slap a 20% tariff on all imports, lower or eliminate the corporate tax system, radically change what is deductible, and then let the money roll in. The Senate derided it and did not even take it up after the House pitched it as a transformative overhaul of the corporate tax system. The Dec 2017 Trump tax bill was passed instead. We wrote about it at the time, and the bill looked crazy to us.
One major part of the pitch was that the tariffs would cause the dollar to strengthen materially and offset the tariff costs and thus not hurt US purchasers. As with most such innovative bills, that one came with scholarly support and papers on the theories (U.C. Berkeley Professor). The idea was that the dollar would rise materially. That fails in the face of what we see in the above chart. The weaker dollar makes goods even more expensive on top of the tariff depending on the currency involved.
We saw Speaker Ryan in an interview this week and no one asked him about his theories on currencies and tariff costs. He also did not bring it up. There is also the worry that the currency volatility and downward bias could have a chilling effect on UST demand at a critical time when record UST supply will need to be met with record demand – every year.
The potential for lower rates undermining the dollar and worries around US sovereign credit quality governance (and economic policy coherence) also could play a role at a time when allies are being attacked by the US on the economic front. The weak dollar and very leveraged sovereign balance sheet does not enhance the role of UST as the central bank currency and asset of choice.
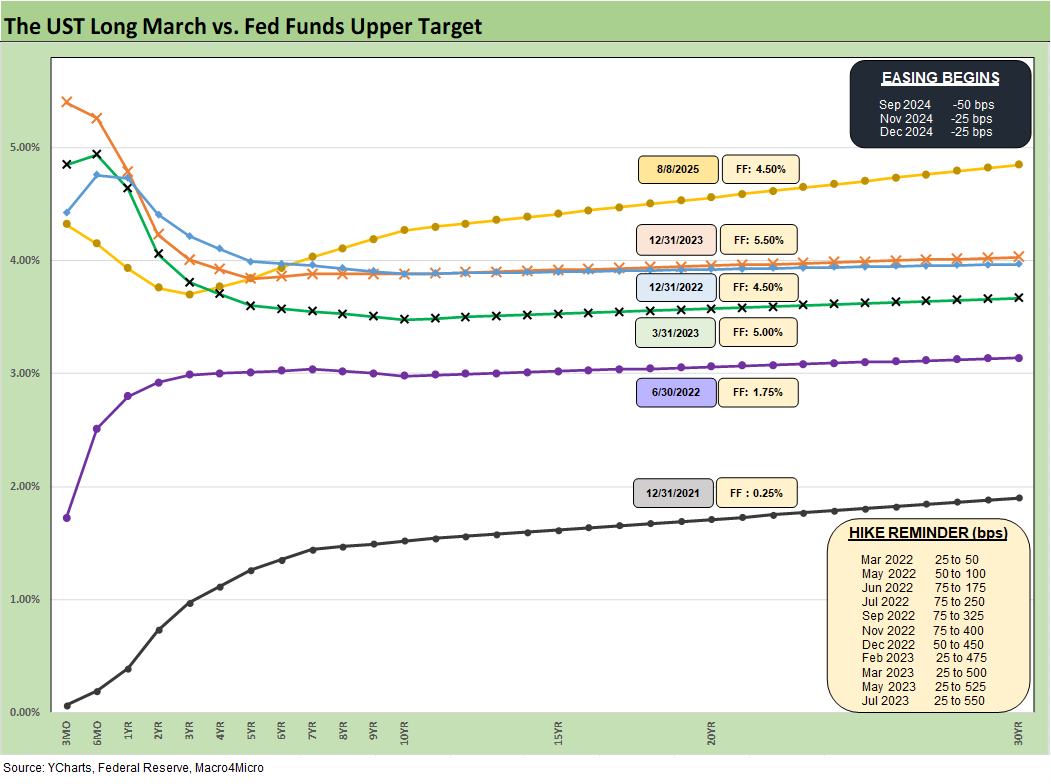
The above replays our weekly chart detailing the migration of the UST curve from 12-31-21 with a memory box detailing the tightening dates and magnitude and more recently the easing. The UST curve seems to intermittently mix bear steepening patterns and flattening rallies since the Sept 2024 lows, but market fear was creeping into the shapeshifting after Liberation Day before calming down with the pause.
The 30Y was stubborn on the long end during the bull steepening period we had seen YTD, but last Friday’s payroll news and the BLS termination sent the 30Y lower by -11 bps that day. As detailed further below, the 30Y UST saw a modest rise again this past week.
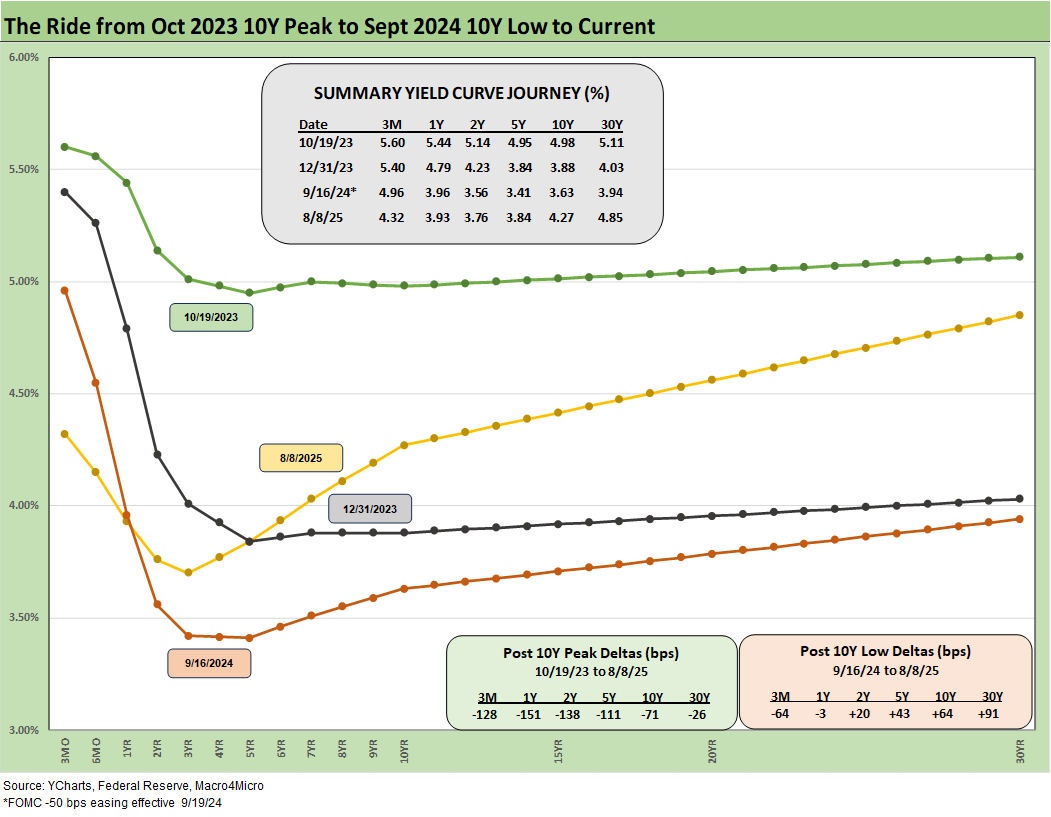
The above chart details the material move from the peak UST curve of 10-19-23 down into the UST bull rally of Nov-Dec 2023 and then eventually into the lows of Sept 2024. The Sept 2024 low tick only came after a bear steepener hit the curve through the summer of 2024. We then moved back into the bear steepener mode until the tariffs roiled the UST markets and initially sent 2Y to 30Y lower on cyclical fears.
The UST shift higher from the Sept 2024 lows and the steepening from the low point at the end of 2023 is reflected in the chart. We see the 10Y and 30Y notably higher now than Sept 2024 with a more normal upward sloping shape from 2Y out to 30Y.
The challenge is still that front end inversion from 3M to 2Y and from 3M to 5Y. We look at the history of the 3M to 5Y later in this commentary. The inversion anomaly on the front end during a protracted expansion has been hard to shake with the FOMC holding the line over tariff-related inflation questions.
The June CPI and PCE report included plenty of signs across the MoM CPI/PCE trends that show numerous product group line items seeing prices pushing higher. Fact deniers (like election deniers) will just say it is fake or there is no cause-and-effect. Or they can just fire some data personnel, scream “rigged,” and whine some more.
The stewardship of the BLS and BEA in Washington will remain suspect given the impulses to control that data and the actions and words of Trump, Bessent, and Lutnick. They literally scrapped major programs and advisory groups who were to help develop the next round of data and system improvements. That puts a big asterisk on the BLS complaints of last week.
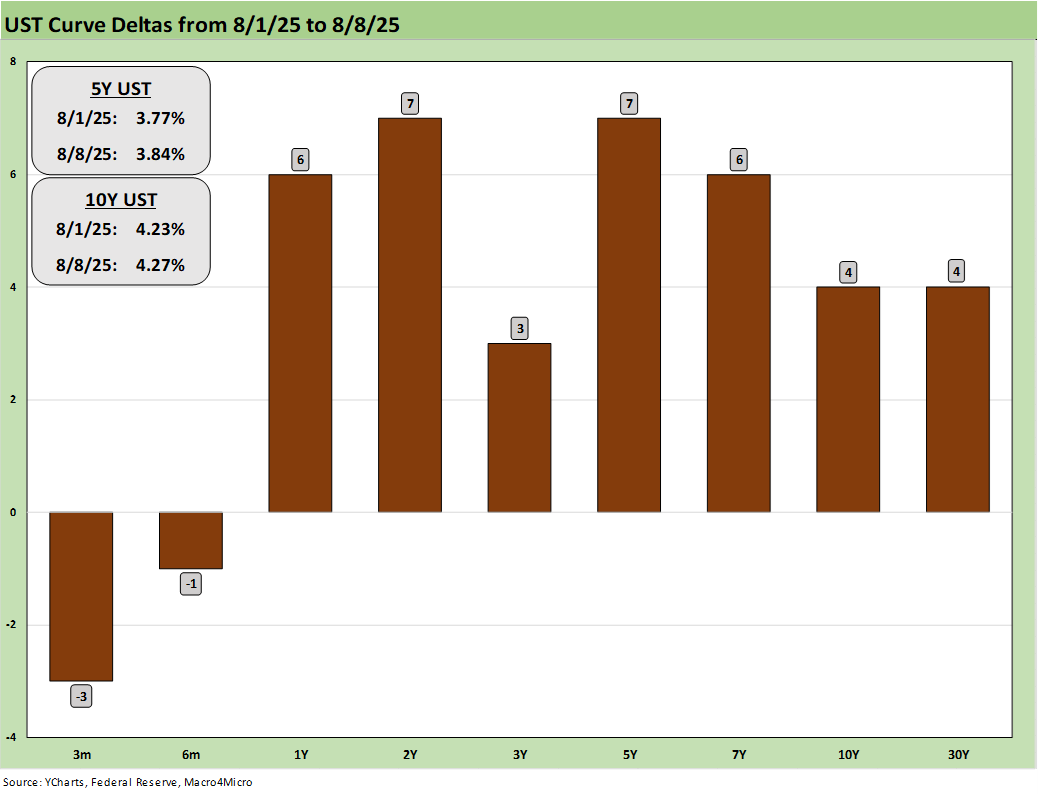
The above chart updates the 1-week UST deltas with a modest upward shift from 1Y to 30Y that hit bond returns during the week (see Footnotes & Flashbacks: Asset Returns 8-10-25).
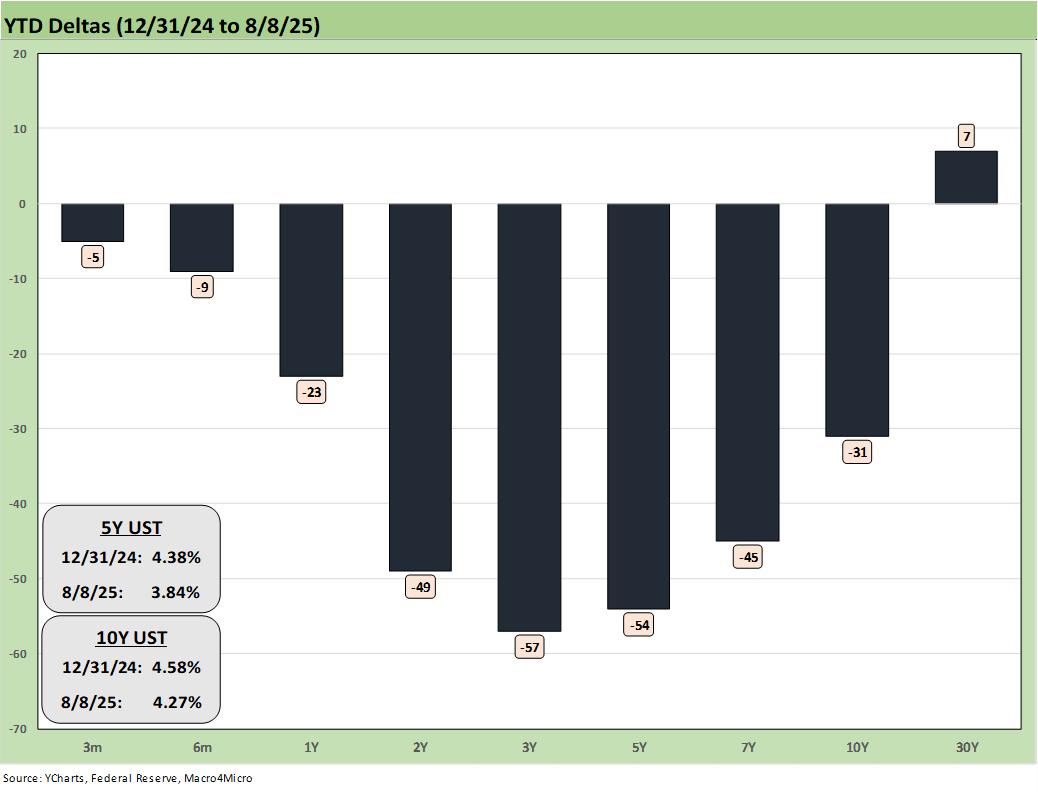
We update the YTD UST deltas above with the bull steepener supporting the bond market and returns of the various bond ETFs we track each week (see Footnotes & Flashbacks: Asset Returns 8-10-25).
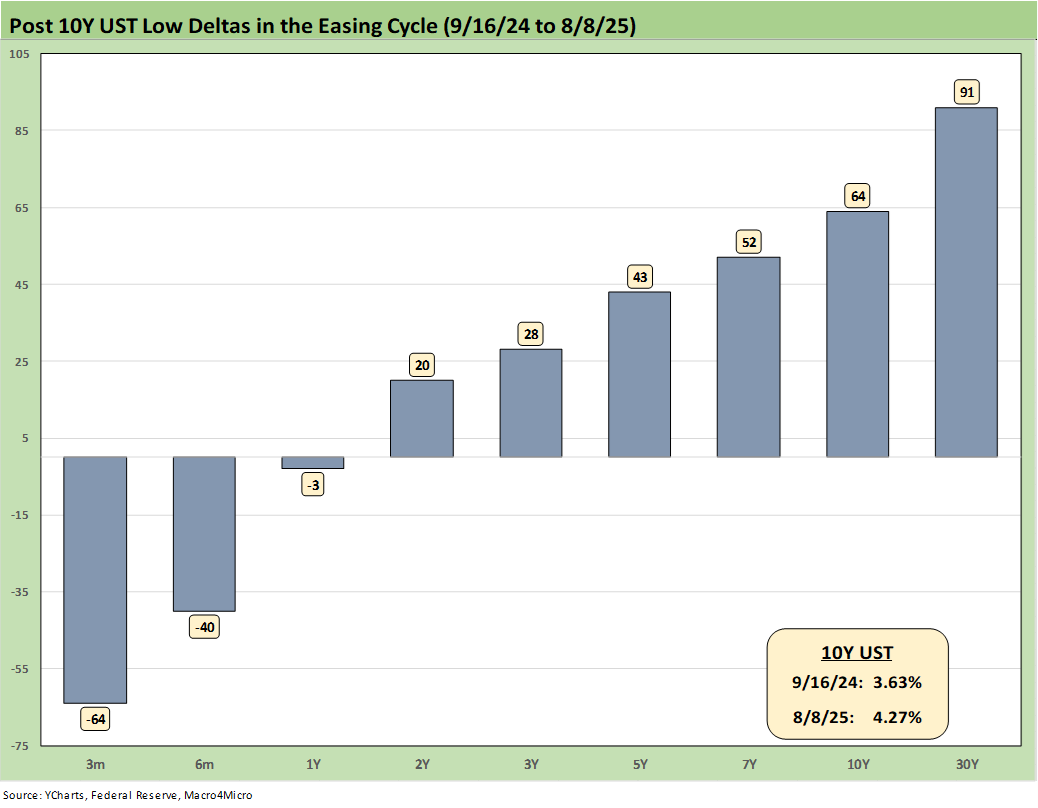
The above chart updates the UST deltas since the 9-16-24 lows that came alongside the Fed easing. That has not worked as many market watchers predicted on the shape of the UST curve and number and pace of easing that was supposed to follow.
Trump continues to rail at the Fed and Powell to lower rates, lately demanding 300 bps of easing, not long after he had demanded a 200 bps of easing, up from earlier demands of 100 bps in cuts. The move from 100 to 300 unfolded in only a few weeks while Trump was extolling the greatness of his 2025 economy. The conceptual connective tissue is not doing well on FOMC action vs. the dual mandate.
The reality is that Trump’s target fed funds rate for right now would be well below inflation. The market sees inflation running above target and tariffs rising while Trump claims his economy is the “hottest” in the world. We are not sure a de facto stimulus via negative real fed funds is a conceptually sound (or coherent) plan. Once he gets “his guy” in the seat at the Fed, that will not stop someone from attaching a pedigree and PhD to that FOMC easing demand regardless of inflation. A well-pedigreed yes man is still a yes man.

The above chart updates the UST deltas from the end of 2023 after a massive rally in rates and risk in Nov-Dec 2023. The follow-on in 2024 expected by the consensus mildly disappointed the UST bulls in the number of FOMC cuts. The market got 4 x 25 (a double in Sept 2024) but not the 5 to 6 FOMC 25 bps cuts anticipated. The expectation of a pronounced bull flattening during 2024 also did not play out as expected when a bear steepener prevailed by the end of the year. As detailed in the earlier chart, the 2025 period has fared better for bonds on a modest bull steepener.
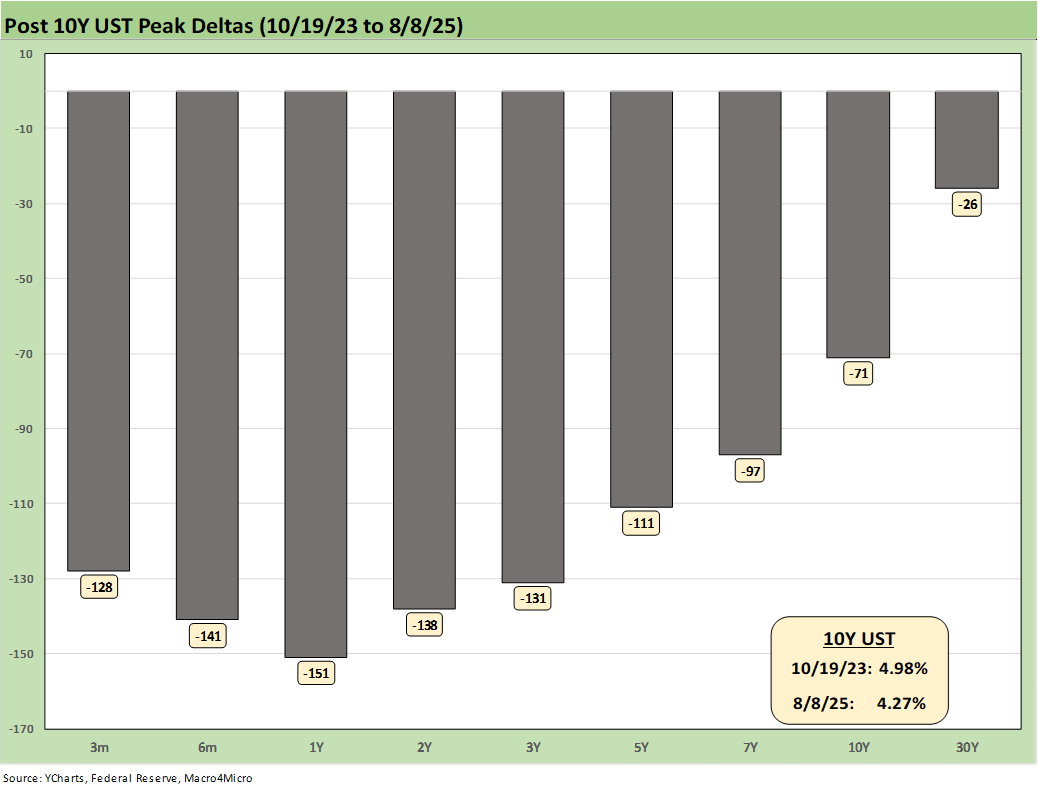
The above chart updates the running UST deltas from the 10-19-23 peak date of the UST 10Y when it barely missed the 5.0% line. For those looking for a frame of reference on what a bad move in inflation metrics might mean, these deltas at least offer a recent set of data points during an inflation fighting year such as late 2023 and into 2024 (until Sept 2024 began the easing process). That is why we keep revisiting that timeline. It reminds us what reversion could mean.
These rally deltas could revert in part or in whole with the wrong inflation outcomes. We don’t need to see 2022 again, but the old saying “It happened before, it can happen again” resonates for many. The market controls the long end of the UST curve, and not the FOMC. Sept 2024 and the aftermath offers a recent data point.
Losing a rally of -71 bps in the 10Y UST above would hurt the mortgage market and would lead to a material valuation headache in equities, M&A economics, and capital project planning. Mortgages have been a drag on housing (new and existing home sales). The risk of inflation heading the wrong way would do more damage. Stubborn rates or higher rates in the short end to 5Y would damage consumer durables financing and related volumes.
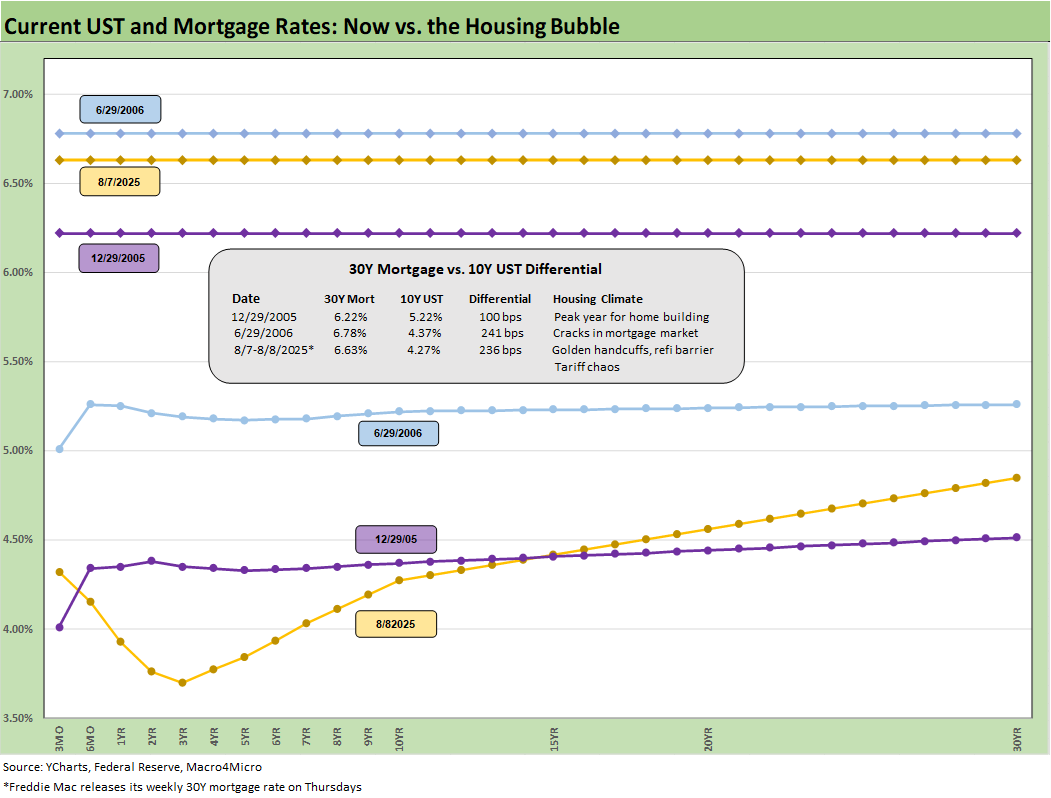
The above chart is one of those replay slides we update each week. This one posts the UST curve for this past Friday and the Freddie Mac 30Y Mortgage benchmark rate (noon Thursday release). We include two useful historical periods including the peak homebuilder year end of 2005 and mid-2006 when RMBS quality concerns were catching headlines as the housing bubble was peaking.
We post UST curves for each period in the chart. The past week saw the Freddie Mac Mortgage 30Y benchmark rate move slightly lower to 6.63% on Thursday from 6.72% last week. As of Friday close, the Mortgage News Daily survey was 6.57%. We have seen minor moves recently, but they are moving in the right direction. Those smaller moves come after a 200 bps range since fall 2023.
We include a column above detailing the differential between the Freddie Mac 30Y and the 10Y UST. That differential moved lower to +236 bps this week from +249 bps last week. The year 2005 posted a differential of only +100 bps and makes a statement on what the mortgage market was like in 2005. The mortgage market was very hot back then in the housing bubble as mortgage volumes soared during that peak homebuilding year and a very busy period of refinancing was running alongside as a source of funds for homeowners.
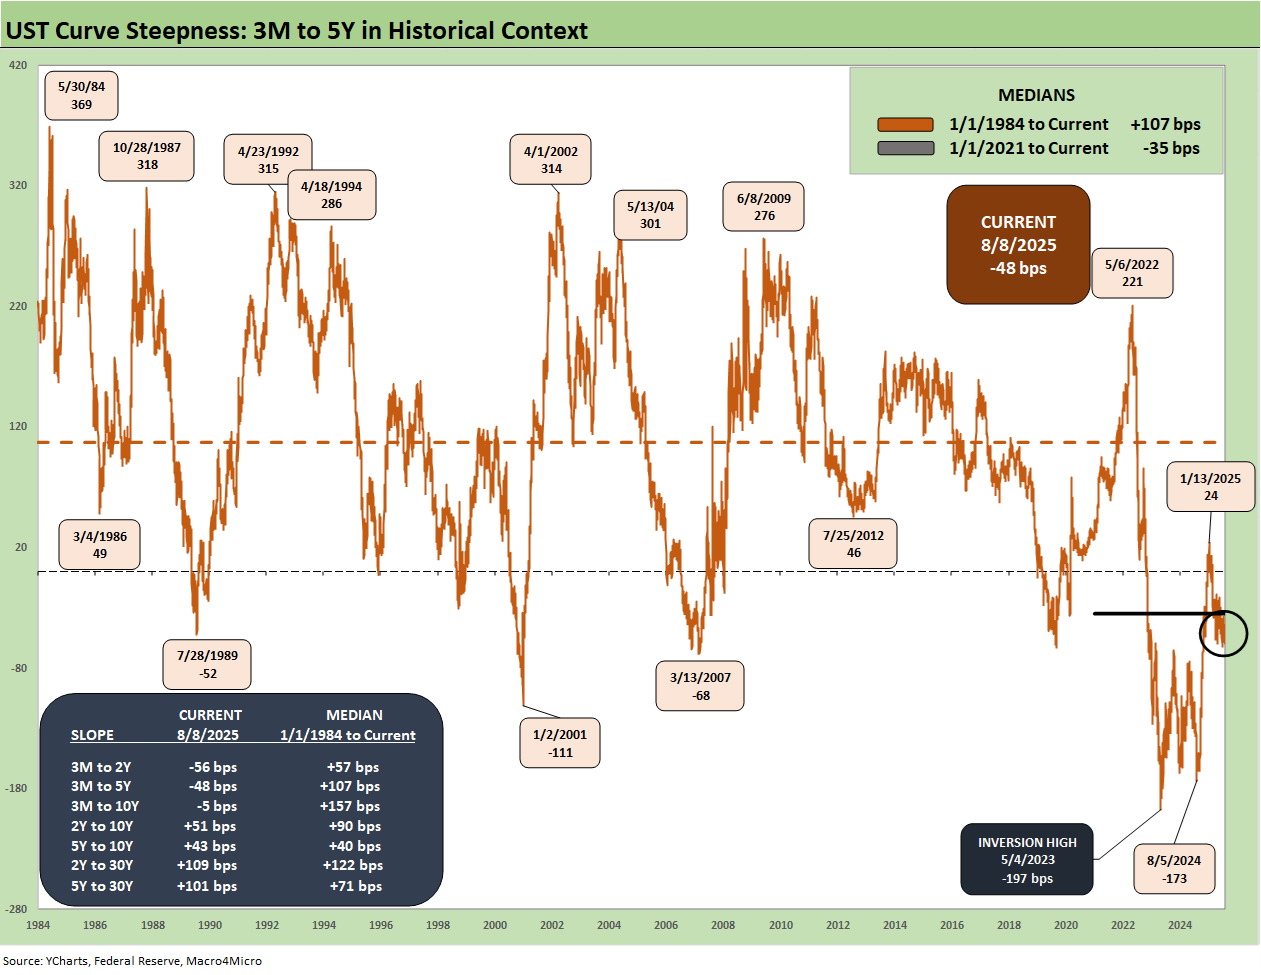
The above chart updates the 3M to 5Y UST slope after a big modest upward shift across the curve this week. The above box within the chart updates the UST curve segments we follow with the latest slope and long-term medians.
The current inversion of -48 bps is much lower than the peak inversion of -197 bps in May 2023. The -48 bps looks more like early 2007 and summer 1989, which is not great company for what came after. The next logical move will be lower fed funds rates by 2-3 cuts by year end but only if inflation cooperates. Trump is in part focusing on interest rate costs from record deficits that will continue each year. Powell and the FOMC are pondering avoidance of economic devastation via stagflation. After all, they have a legal mandate. Trump is also likely worried his economy is weakening despite his bullish rhetoric and wants to blur the cause and effects – and especially in inflation.

The above chart shortens the timeline to a start date in Jan 2021 when ZIRP was in place. We get better granularity on the post-COVID curve shapeshifting. We see the steepening to a peak of +221 bps in May 2022 before the plunge to a peak inversion of -197 bps in May 2023.
While Powell and the FOMC should have moved earlier, we don’t hear much reference back to Trump demanding negative interest rates of the Fed as late as May 2020. He was advising the same in 2019 before COVID. There is a history of a desire to overdo the Fed easing when he needs some growth as Trump demanded when the Fed eased multiple times in 2H19 (see UST Curve History: Credit Cycle Peaks10-12-22). The Fed did not ease on Trump demands but did so on economic weakness (weak capex and exports). That was during the “greatest economy in history.”
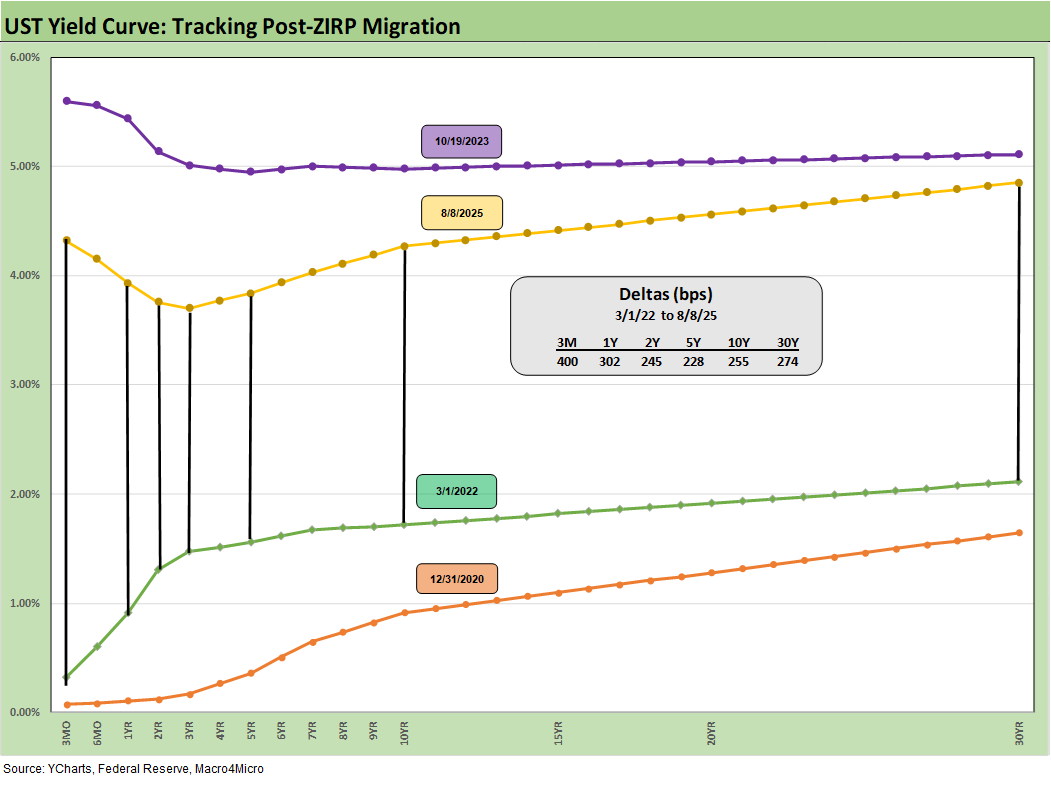
We wrap this week’s State of Yields with an update of the running UST deltas since March 1, 2022 just ahead of the end of ZIRP (effective 3-17-22). We include the 12-31-20 UST curve and 10-19-23 peak UST curve as frames of reference.
See also:
Footnotes & Flashbacks: Asset Returns 8-10-25
Mini Market Lookback: Ghosts of Economics Past 8-9-25
Macro Menu: There is More Than “Recession” to Consider 8-5-25
Footnotes & Flashbacks: Credit Markets 8-4-25
Mini Market Lookback: Welcome To the New World of Data 8-2-25
Happiness is Doing Your Own Report Card 8-1-25
Payrolls July 2025: Into the Occupation Weeds 8-1-25
Employment July 2025: Negative Revisions Make a Statement 8-1-25
Employment Cost Index 2Q25: Labor in Quiet Mode 7-31-25
PCE June 2025: Prices, Income, and Outlays 7-31-25
2Q25 GDP: Into the Investment Weeds 7-30-25
2Q25 GDP: First Cut of Another Distorted Quarter 7-30-25
United Rentals: Cyclical Bellwether Votes for a Steady Cycle 7-29-25
JOLTS June 2025: Lower Openings and Hires, Higher Layoffs YoY and Flat MoM 7-29
25
Mini Market Lookback: Mixed Week Behind, Big Week Coming 7-26-25
Durable Goods Jun25: Air Pocket N+1 7-25-25
Taylor Morrison 2Q25: Resilient but Feeling the Same Macro Pressure 7-25-25
New Home Sales June 2025: Mixed Bag 7-24-25
Existing Home Sales June 2025: The Math Still Doesn’t Work 7-23-25
PulteGroup 2Q25: Still-Lofty Margins see a Mild Fade 7-23-25
D.R. Horton 3Q25: Material Slowdown Still Good Enough 7-22-25
Housing Starts June 2025: Single Family Slips, Multifamily Bounces 7-18-25
Mini Market Lookback: Macro Muddle, Political Spin 7-19-25
Housing Starts June 2025: Single Family Slips, Multifamily Bounces 7-18-25
Retail Sales Jun25: Staying Afloat 7-17-25
June 2025 Industrial Production: 2Q25 Growth, June Steady 7-16-25