
Footnotes & Flashbacks: Asset Returns 8-10-25
Equities win, credit spreads tighten, but bonds sag with the UST curve. This week we await another CPI number.


That 25% annual S&P 500 is just above this. No problem.
This week was favorable for equities, but bonds were nicked by the modest upward move in the UST curve with some offset in credit from tighter spreads.
The steady and solid equity markets face more than a few barriers ahead to get past inflation risks with tariffs set to roll into working capital cycles and capex budgets for 2026 planning. The S&P 500 returns for 2023 and 2024 each at 25%+ set a high bar for this market.
CPI comes this week, and the focus on sequential MoM trends by product group will be a crucial exercise that should be (but probably won’t be) viewed more closely than the headline numbers.
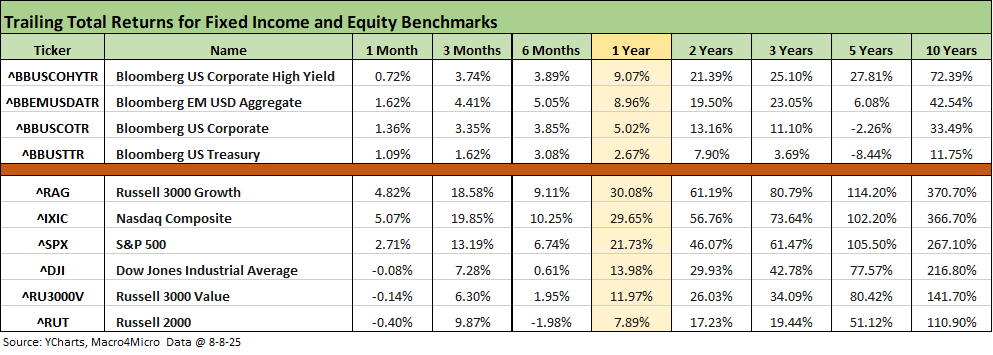
The above table updates the rolling time horizon returns for the high-level debt and equity benchmarks we watch each week. We saw a mild comeback on the week for duration that in turn brought modestly better rolling 1-month numbers for fixed income. Tighter credit spreads also offered an assist to HY returns. We will be out with our full credit markets report on Monday, but we offered up some details in our Mini Market Lookback: Ghosts of Economics Past (8-9-25).
Equities had a very solid week that also bolstered rolling 1-month returns even if the small cap Russell 2000 remains in the doldrum in 2025 YTD as we cover further below. This week saw the Russell 2000 alongside the S&P 500 in our group of 32 benchmarks and ETFs, but on a YTD basis the small caps are barely positive and sit in the bottom quartile with the Midcaps. Russell 3000 growth stocks have posted good numbers as evident in the table, but the Russell 3000 drops in the usual large cap tech bellwethers. Value stocks in Russell 3000 raise questions around the tariff fallout below the larger caps with Russell 2000 in the red through 6 months.
The rolling return visual
In the next section, we get into the details of the 32 ETFs and benchmarks for a mix of trailing periods. Below we offer a condensed 4-chart view for an easy visual on how the mix of positive vs. negative returns shape up. This is a useful exercise we do each week looking for signals across industry groups and asset classes.

The positive vs. negative symmetry underscores the constructive mix of slower but positive consumer trends with payrolls debatably at full employment levels (low 4% was considered full employment in the bull markets of the1990s). Among supportive variables is that credit availability is generous in the corporate sector (even with some quality erosion and some signs of tightening conditions on the consumer side). The largest banks are posting good numbers in consumer credit. Meanwhile, corporate earnings trends coming out of the June quarter are favorable, but the tariff test to retail will get more visibility with the July quarterly reports.
Despite the usual immediate gratification crowd wanting to see the decision on tariff effects as in “game over” mode on inflation risk, these things take months to play out once the tariffs are effective. It can even take quarters in many cases as the importer/buyers (the ones who “write the check to customs”) develop their plans to deal with “tariff cost sharing” along supplier chains or develop alternative sourcing plans (which may not exist). In addition, domestic producers who are beneficiaries of tariffs need to tread cautiously on their own reinvigorated pricing power even if you expect then to raise prices at some point. That will vary widely across goods categories. Supplier contracts also adjust at a lag. This leaves a lot of room for disinformation from policy makers who want to declare the “debate over” when it is really just starting.
Watching Secretary of Treasury Bessent this week get probed on Morning Joe by Eugene Robinson to confirm that the “buyers pay customs” was a sad reflection on Bessent. He did finally come around to admit the fact (after repeated clear questions of “Who writes the check?”) as he sought to duck a direct answer. Sign of the times.
The Magnificent 7 heavy ETFs…
Some of the benchmarks and industry ETFs we include have issuer concentration elements that leave them wagged by a few names. When looking across some of the bellwether industry and subsector ETFs in the rankings, it is good to keep in mind which narrow ETFs (vs. broad market benchmarks) get wagged more by the “Magnificent 7” including Consumer Discretionary (XLY) with Amazon and Tesla, Tech (XLK) with Microsoft, Apple, and NVIDIA, and Communications Services (XLC) with Alphabet and Meta.
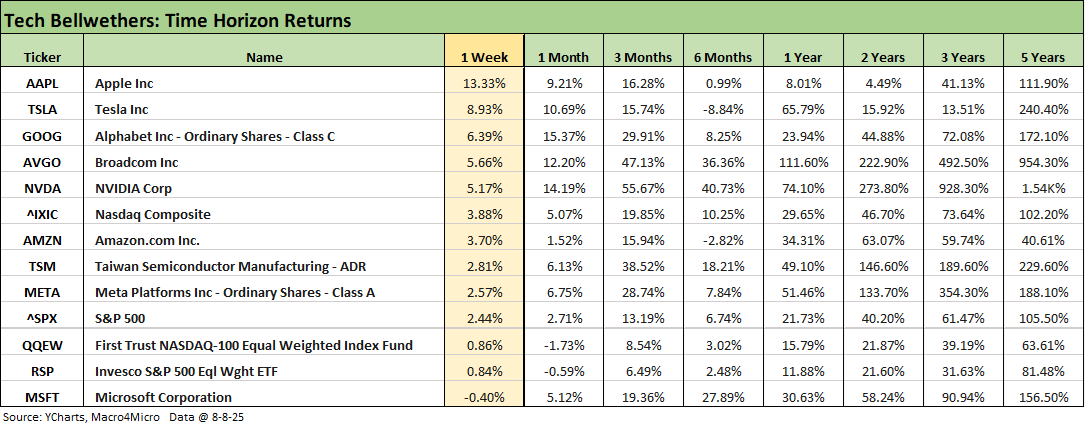
We already looked at the tech bellwethers in our Mini Market Lookback: Ghosts of Economics Past (8-9-25). Tech had a good week with the Mag 7 mostly beating the large cap benchmarks but MSFT lagging. The rolling 3-month period shows the bounce of the April tariff panic.
The 6-month period shows the theme of material divergence across the bellwethers of the Mag 7. Apple, Amazon, and Tesla have had the most turmoil for an array of company-specific reasons. Chips have been the big winners and, despite the recent weakness, MSFT has been solid and steady. TSLA is always the most volatile for numerous reasons unrelated to its core business line performance and related more to Musk’s personal relationships (Trump) and political issues (DOGE).
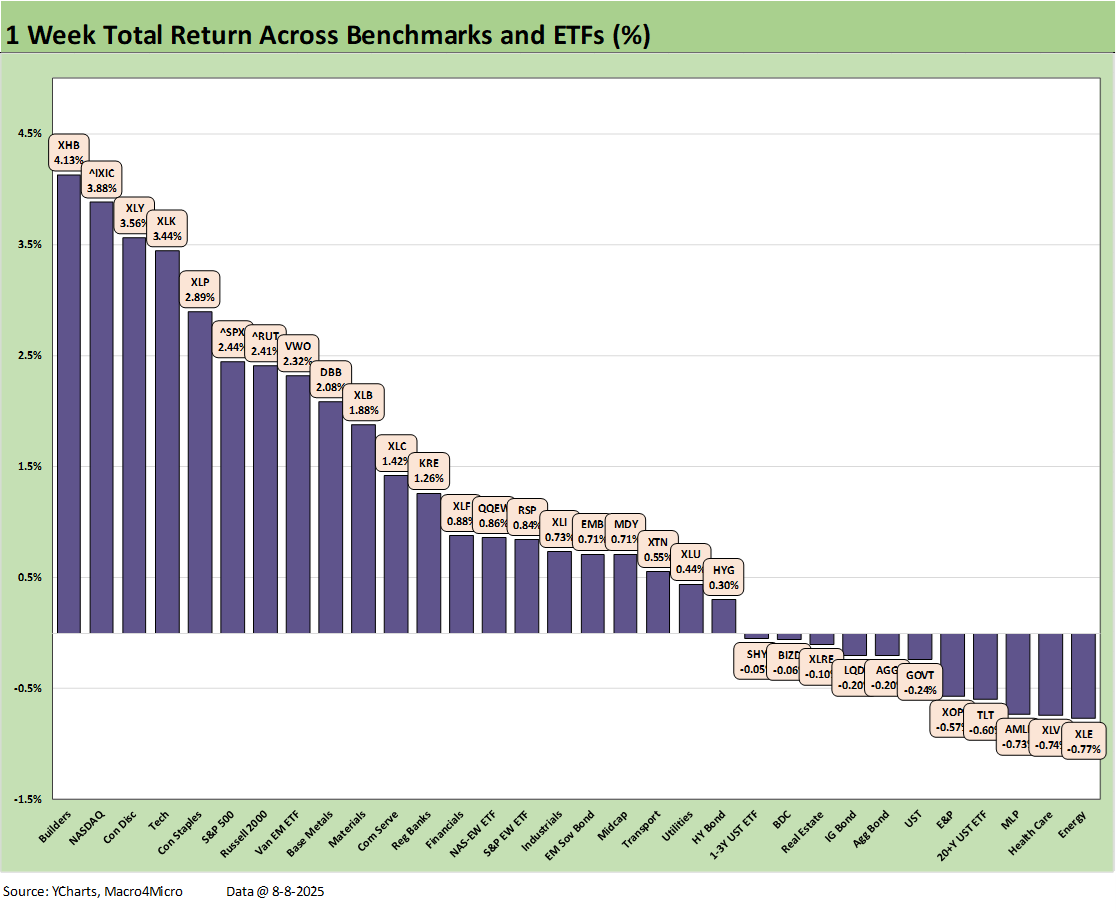
We recapped the 1-week timeline in our Mini Market Lookback: Ghosts of Economics Past (8-9-25), and this week was a solid one for large caps and small cap benchmarks even if midcaps lagged in the 3rd quartile. The 21-11 score includes weakness in bond ETFs with 5 of 7 negative and more aggressive credit subsectors (HYG, EMB) in positive range with the longer duration IG Corporate ETF (LQD) in the red. Tech benchmarks and tech-heavy ETFs had a lead role in the top quartile.
Homebuilders (XHB) are showing some benefits as more investors gain optimism on mortgage rates. That optimism will face hurdles into the fall on inflation and FOMC reactions and how that flows into UST steepening risks. XHB has clawed its way back YTD to the upper end of the 3rd quartile after the valuation beatdown that set in around the start of 4Q24. We see the small cap Russell 2000 alongside the S&P 500 in the top quartile this week, but the RUT is still residing in the bottom quartile YTD.
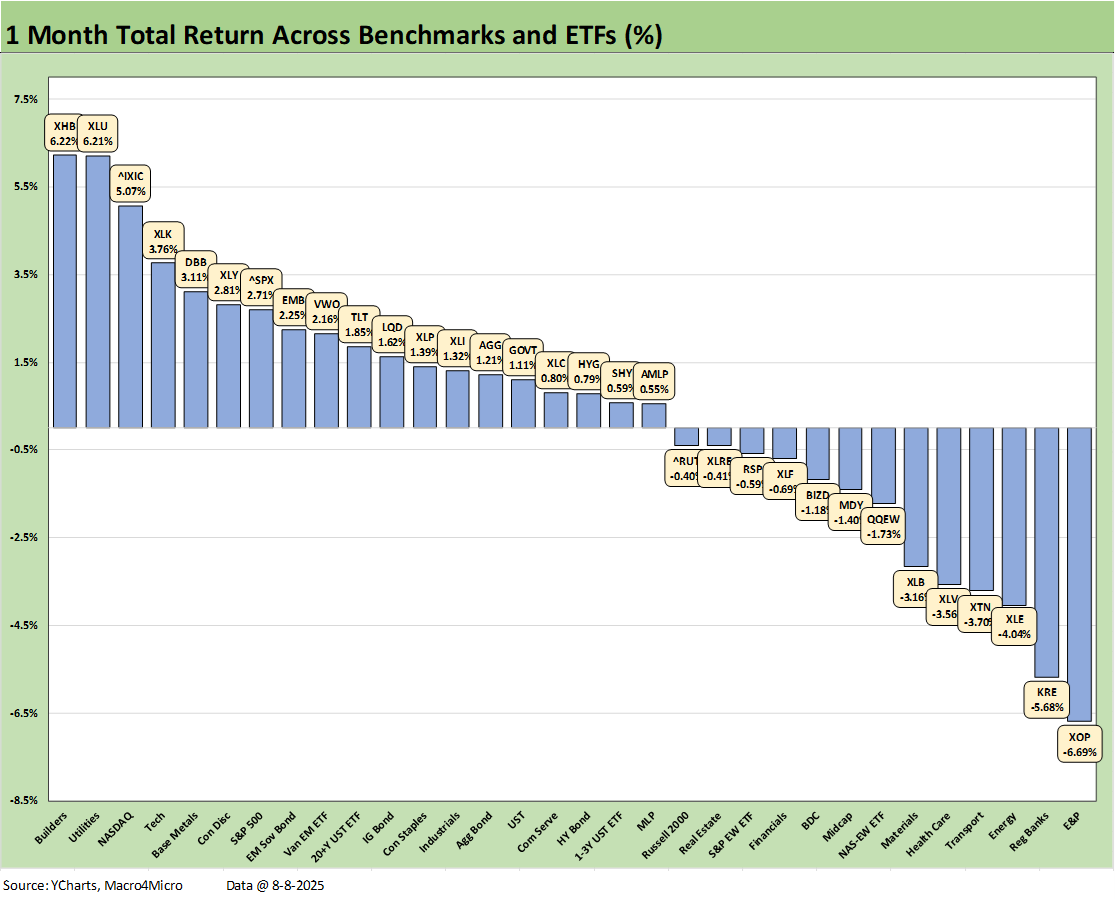
The 1-month returns posted a score of 19-13 with some of the usual underperformers bringing up the rear. The bottom of the ranking includes E&P (XOP) and broad Energy (XLE) which are both in the bottom quartile YTD (see the chart further below). The dividend heavy Midstream ETF (AMLP) performed better YTD in the 2nd quartile.
We also see tariff-exposed Transports (XTN) and Healthcare (XLV) and Regional Banks (KRE) in the bottom quartile with negative returns. Those 3 ETFs (XTN, XLV, KRE) are also in the bottom quartile YTD.
Notable winners for the 1-month period include Homebuilders (XHB) and Utilities (XLU) before NASDAQ and S&P 500 join the top quartile. Bond ETFs are all positive for 1-month with EM Sovereigns (EMB) even edging into the top quartile along with Base Metals (DBB).
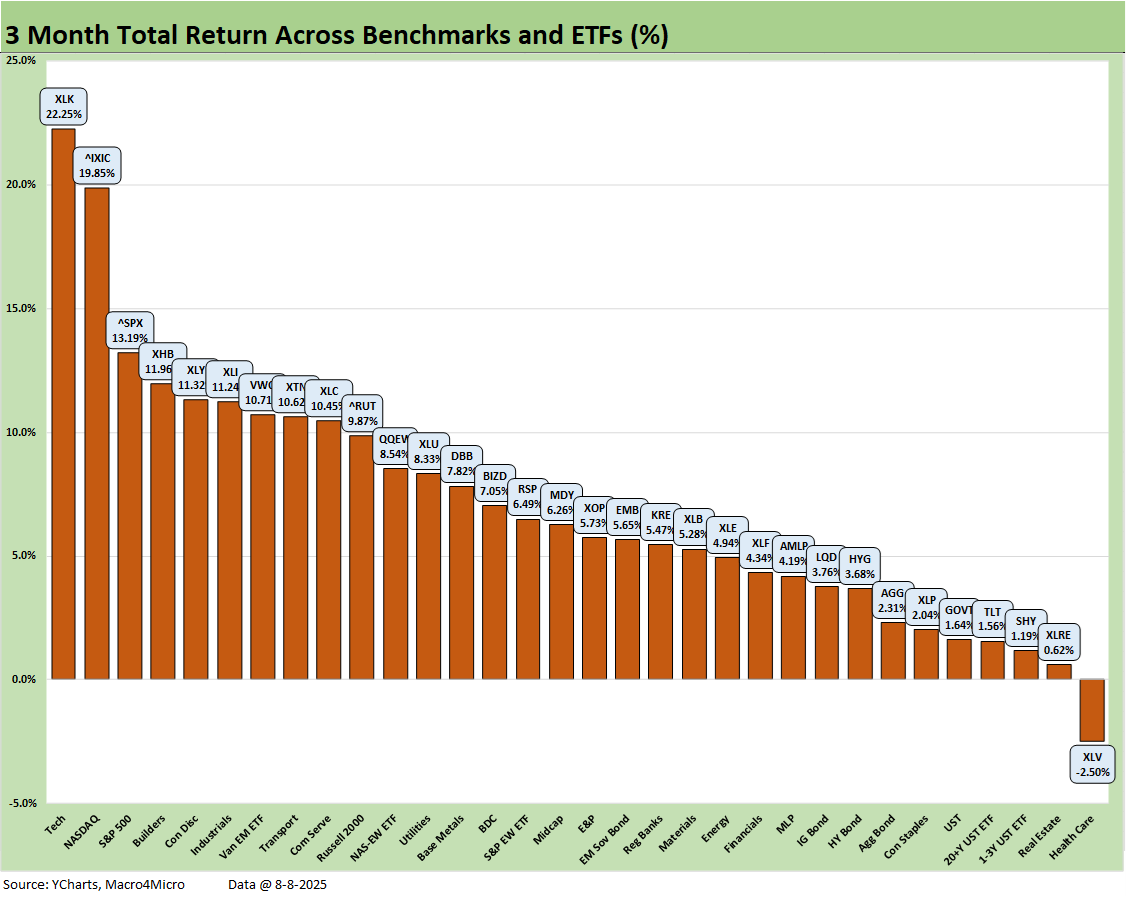
The 3-month rally and bouncing off the Liberation Day panic effects posts a 31-1 score as the market moved. We now await more details on the real economic effects of tariffs as they flow into working capital cycles and capex planning that can be described in fact rather than in theory and channeled through political rhetoric. The hope is that the facts see the light of day objectively and free of political taint and top-down pressure tactics (see Happiness is Doing Your Own Report Card 8-1-25).
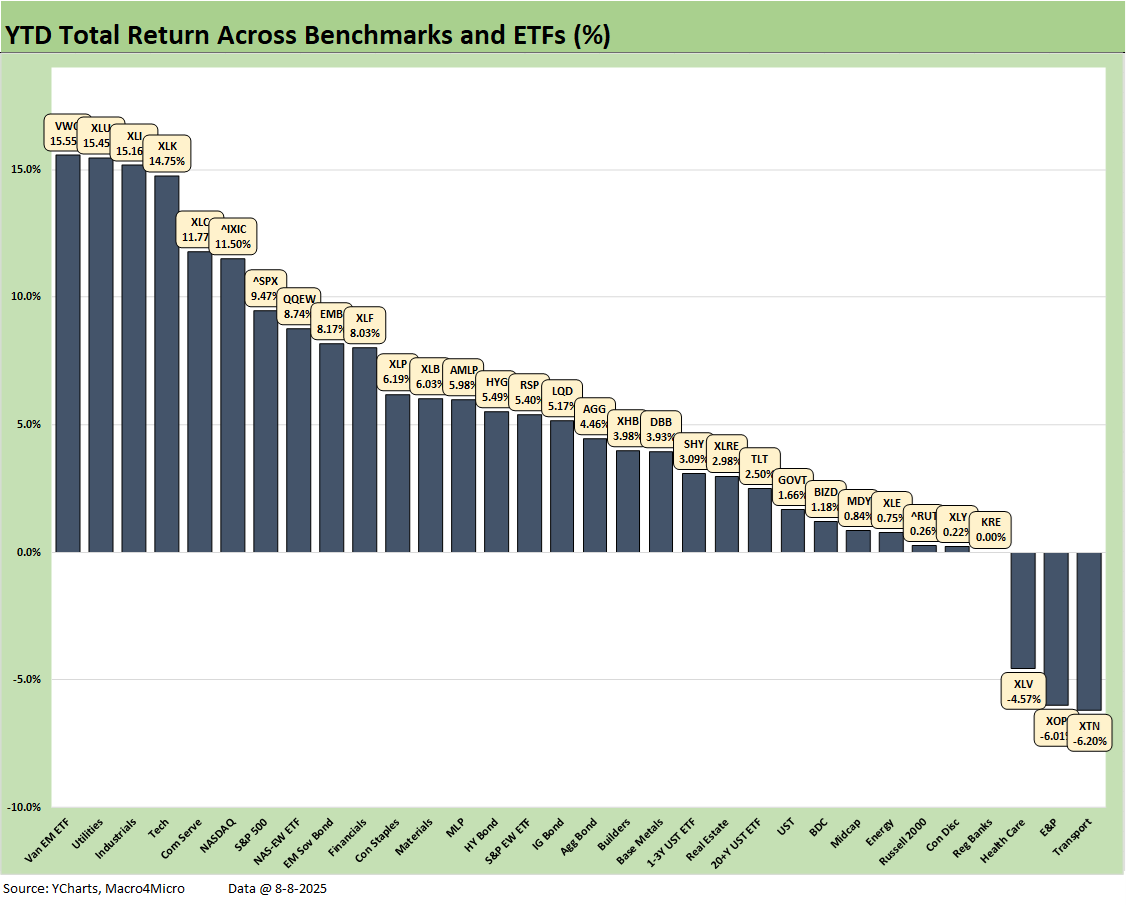
The 29-3 score YTD is impressive given the mix of macro indicators and policy uncertainty. The median asset line return across the 32 benchmarks and ETFs is just below 5%, which is not impressive at this point in August but at least in line with long term returns on the equity asset class. The only 3 negative returns were posted by recurring underperformers in 2025 with Transports (XTN), E&P (XOP), and Health Care (XLV).
We see midcaps and small caps in the bottom quartile YTD, so that earns a low score for market sector breadth. That said, there is “a lot of year left’ with some very critical turning points tied to inflation and the Fed and the transaction level specifics as tariffs flow in.
The 7 bond ETFs are all positive and sprinkled across the 2nd and 3rd quartile. On a brighter note, the top 3 are not just tech names with EM Equities at #1, Utilities (XLU) at #2, and Industrials (XLI) at #3. That is before tech and Mag 7 heavy names take over the top quartile with Tech (XLK), Communications Services (XLC), NASDAQ (IXIC), the Mag 7-heavy S&P 500, and Equal Weighed NASDAQ 100 (QQEW) rounding out the top quartile.
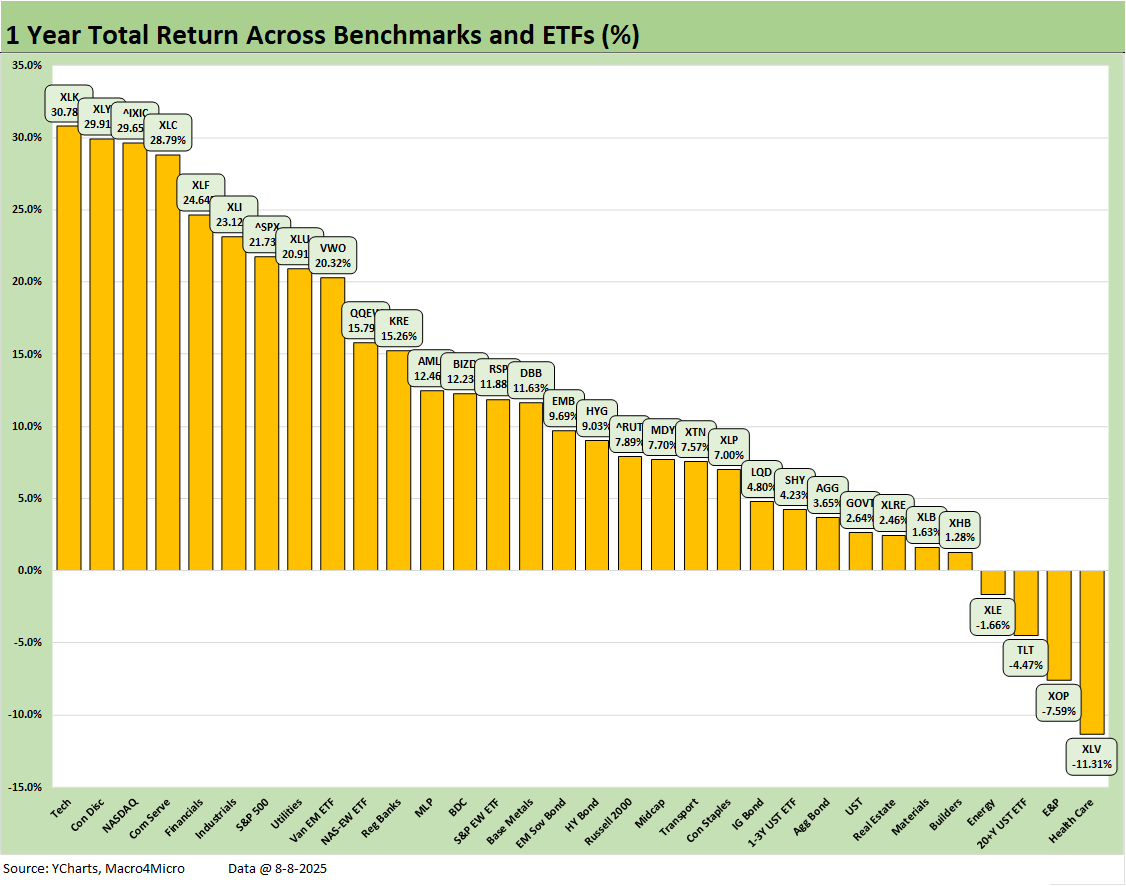
The LTM period posted a score of 28-4. We see the top 4 rankings in the tech buckets with Financials (XLF) Industrials (XLI), the S&P 500, and Utilities (XLU) rounding out the bottom half of the top tier. We see 6 of 7 bond ETFs in positive range with the long-duration UST 20+Y ETF (TLT) in negative range alongside two energy ETFs (XOP, XLE) and the Health Care ETF (XLV) at an abysmal -11.3%.
The run rates above include just under 5 months of the 2024 banner year in equities. The year 2024 was Part 2 of the best 2-year run in the S&P 500 since the late 1990s, so that sets a high bar (see Footnotes & Flashbacks: Asset Returns for 2024 1-2-25). The S&P 500 return of +25% for 2024 (26% 2023) and more than double those for the cumulative 2 years (2023 through 2024) will be very hard to match in 2025-2026. As of now, the YTD S&P 500 is +9.47% after a solid week (see prior chart) while the LTM is +21.7%. The S&P 500 has to really finish strong in the home stretch of 2025 to match either 2024 or 2023.
The broad market benchmark performance in 2023-2024 on the way to the LTM 2025 above undermines the weak premise of the Trump rhetoric that the country was “dead” or “dying” until Trump came along. You can also look at annual GDP or payrolls (even after the revisions). Trump also indicated the US would fall into a “Depression” if tariffs are blocked by the courts. It does manage to get stranger each week – somehow.
The YTD S&P 500 numbers are running at an annualized pace ahead of long-term equity return averages but well behind each of the last two years at annual rates. The LTM S&P 500 return above is 21.7%, which is very strong but below calendar 2024 and 2023 while using some of the 2024 performance in the LTM 2025 returns.
As the market hopes for a strong summer and fall finish in equity markets, the CPI and PCE inflation metrics could not be more critical. CPI will be a MoM exercise in reviewing product pricing trends, and the next PPI might offer some more color on the fallout from materials tariffs. This week’s Retail Sales numbers will also get closer scrutiny with the consumer under a microscope. That also holds true with the income and outlays data due with the PCE release at the end of August.
See also:
Mini Market Lookback: Ghosts of Economics Past 8-9-25
Macro Menu: There is More Than “Recession” to Consider 8-5-25
Footnotes & Flashbacks: Credit Markets 8-4-25
Footnotes & Flashbacks: State of Yields 8-3-25
Mini Market Lookback: Welcome To the New World of Data 8-2-25
Happiness is Doing Your Own Report Card 8-1-25
Payrolls July 2025: Into the Occupation Weeds 8-1-25
Employment July 2025: Negative Revisions Make a Statement 8-1-25
Employment Cost Index 2Q25: Labor in Quiet Mode 7-31-25
PCE June 2025: Prices, Income, and Outlays 7-31-25
2Q25 GDP: Into the Investment Weeds 7-30-25
2Q25 GDP: First Cut of Another Distorted Quarter 7-30-25
United Rentals: Cyclical Bellwether Votes for a Steady Cycle 7-29-25
JOLTS June 2025: Lower Openings and Hires, Higher Layoffs YoY and Flat MoM 7-29
25
Mini Market Lookback: Mixed Week Behind, Big Week Coming 7-26-25
Durable Goods Jun25: Air Pocket N+1 7-25-25
Taylor Morrison 2Q25: Resilient but Feeling the Same Macro Pressure 7-25-25
New Home Sales June 2025: Mixed Bag 7-24-25
Existing Home Sales June 2025: The Math Still Doesn’t Work 7-23-25
PulteGroup 2Q25: Still-Lofty Margins see a Mild Fade 7-23-25D.R. Horton 3Q25:
Material Slowdown Still Good Enough 7-22-25
Housing Starts June 2025: Single Family Slips, Multifamily Bounces 7-18-25
Mini Market Lookback: Macro Muddle, Political Spin 7-19-25
Housing Starts June 2025: Single Family Slips, Multifamily Bounces 7-18-25
Retail Sales Jun25: Staying Afloat 7-17-25
June 2025 Industrial Production: 2Q25 Growth, June Steady 7-16-25