
The Curve 12-15-25
We update the latest moves in yield curve gyrations and segment slopes as the market braces for a lot of moving parts in 2026.


Life with the yield curve and monetary policy cycle…
As we wind down a wild year of debates on tariffs, fears around Fed independence, and the zigzagging handicapping of payroll vs. inflation, the market is reframing the trends against rapidly shifting policies on tariffs as Trump’s tariffs see reality setting in (e.g., the buyer factually pays the tariffs). The data flow ahead might signal the winnings might not work out as planned for the “golden age.”
While trade partner reactions do not get much play in the discussion of why tariffs did not fall as hard on the economy as feared, the game theory around how trade partners might react generally saw most fold up their tent and not engage in tit-for-tat and aggressive countermeasures. Overall, it was a case study in surrender. Only China fought the fight. That willingness to fight back could change in 2026 with significance for UST demand.
Many domestic constituencies in the EU (the #1 trade partner as a bloc), Canada (highest value-added export market), and a relatively quieter Mexico (#1 trade partner nation) will face fresh tests of will and tolerance in 2026 as Trump pursues very aggressive foreign policy goals. As framed in the recent National Security Strategy release (and some items not released on squeezing the EU and Canada out of the inner circle), some policy aims are explicitly anti-EU in tone (see Market Lookback: FOMC Fragments, Rate Debates Murky 12-13-25).
Mexico and Canada will face the USMCA review in 2026, and that could bring different domestic political challenges to Carney and Sheinbaum. The reactions could be different than the restraint of 2025. Those reactions could extend to UST purchasing and retaliatory tariffs.
As we have been covering in our yield curve research along the way, we see inflation pressure remaining stubborn with some important product lines higher than others. The supply-demand imbalance and FOMC dynamics favor a steepening of the UST curve in 2026 from both the front end (lower) and long end (stubborn if not higher). Recent history has not been kind to the bull flattener forecasts that were expected through the end of 2024 and later (see The Curve: Flying Blind? 11-24-25).
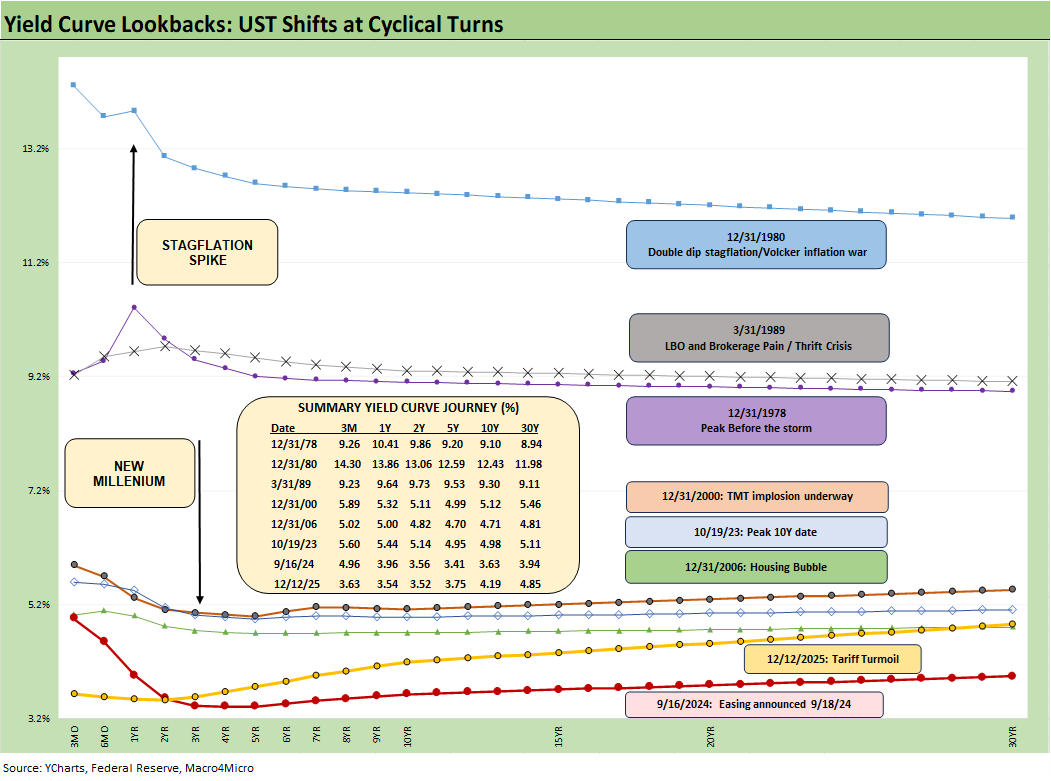
The above chart details some notable UST curve shifts and transitions in monetary cycles since the Carter inversion of 1978. The debates in economics class back in the late 1970s were riveting for those of us who had idled in gas lines (before shutting the car off) in the odd-even license plate days of 1974. That stagflation period included the peak recession months after the Arab Oil Embargo of Oct 1973 played out.
The arrival of Volcker on the scene in 1979 during the Iran oil crisis and inflation pain then took us through the 1980-1982 stagflation double dip that saw the Misery Index (inflation + unemployment) hit 22% in June 1980. Those were different worlds, so the “worst in 4 decades” mantra had some real pain behind it and underscores why stagflation was more than just a boogeyman. It was quite real and shaped a generation of Fed economists for decades.
The UST flattening seen during periods of risk excess (1989, 2000, 2006) is well above the current curve. The post-crisis ZIRP and QE years from 2008 and then across COVID had too many Fed-driven distortions, so we omit them from this chart. We pick up the history with peak the 10Y UST date of 10-19-23 as the transition from the end of ZIRP in March 2022 gave way to the easing cycle that started in Sept 2024 (see separate comments on that transition below).
When commentators give history lessons on how brutally high interest rates are now, it is worth keeping in mind they are using the ZIRP and QE years as the frame of reference, which includes some sub-1% UST bond yields. They are not using the economic and monetary cycles across the booming growth of the US capital markets that were really ignited in the early 1980s and soared into the 1990s and 2000s.
The current yield curve (12-12-25) in the chart has been transitioning into a shift to upward sloping as fed funds get trimmed and the 10Y and 30Y are more stubborn. How that upward sloping UST shift gets swept up in the array of overriding variables – FOMC action (dual mandate), inflation expectations (wagging the long end), and supply-demand balances (or imbalances on record borrowing needs on record US deficits) for UST bonds – sets the stage for the 2026 adventure.
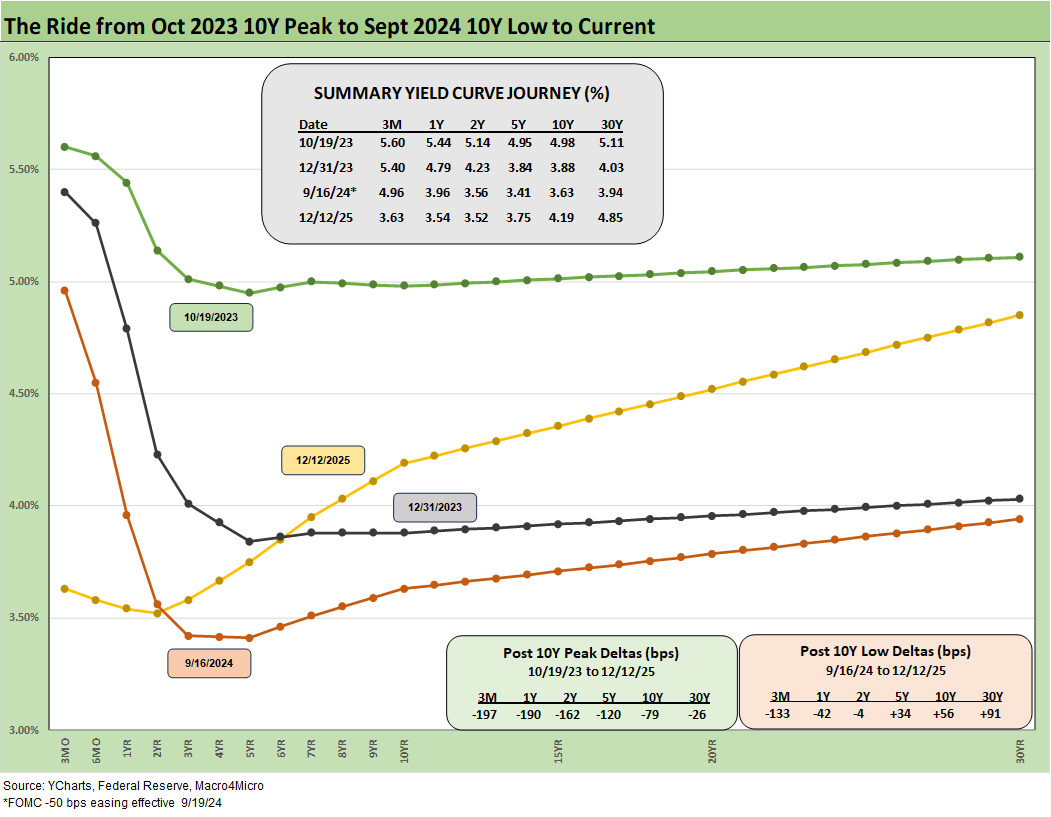
The above chart revisits the shift from the 10-19-23 peak on 10Y UST rates (just missed 5.0%) to an impressive rally in risk and the UST to end 2023. The easing cycle began in Sept 2024 with the -50 bps easing (with another -50 bps of cuts to follow in 4Q24). That easing move did not derail the dramatic inversion that was joined by a downward shift out the curve. That rally in the long end proved short lived as a bear steepening then was set in motion that spoiled a lot of 2024 year end forecasts.
While there has been more than a few gyrations since then, the UST shift through 12-12-25 UST shows a pattern that has hurt housing and kept mortgage rates high (see Market Lookback: FOMC Fragments, Rate Debates Murky 12-13-25). There are a range of factors pressuring the housing sector, but the inability of the 10Y to move materially lower during an easing cycle is a big part of it. The truism of “the Fed controls the short end, and the market controls the long end” is alive and well.
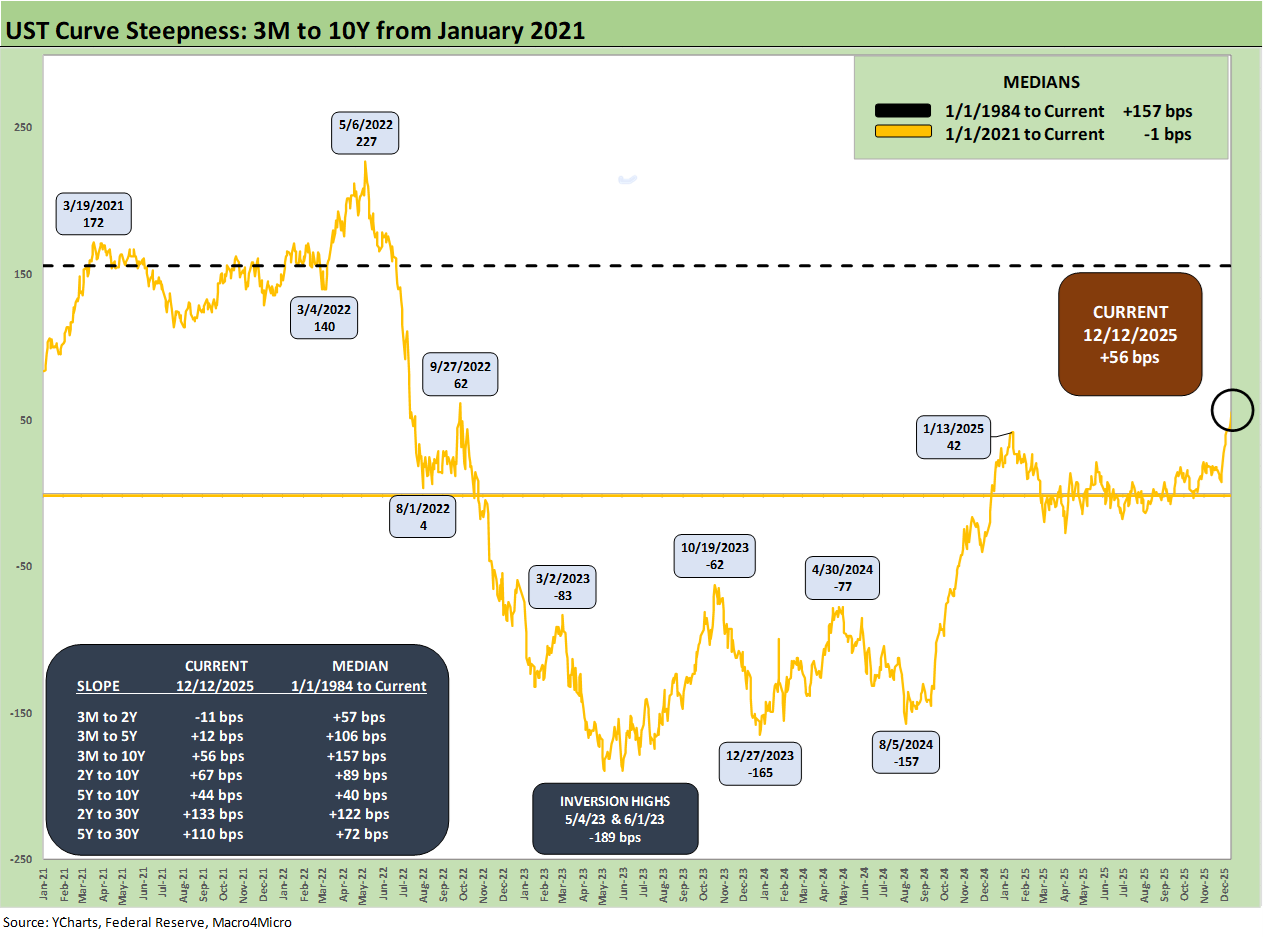
The steepening vs. flattening debate will continue, and the above chart frames the recent cyclical moves since the ZIRP period of early 2021 in Biden’s term and then across the transition from tightening and into the easing cycle of late 2024 into 2025.
The box details the UST segment slopes we monitor with the 3M to 10Y now at +56 bps vs. the long-term median (from 1/1/1984) of +157 bps. While there are a lot of ingredients in the recipe book on how the 3M to 10Y UST might move in 2026, one easing action, as projected at the median by the FOMC this past week, leaves room for more steepening from both the long and short end before it reaches the median slope. As of the most recent period in the chart, the 3M to 10Y UST slope is around 100 bps below the median.
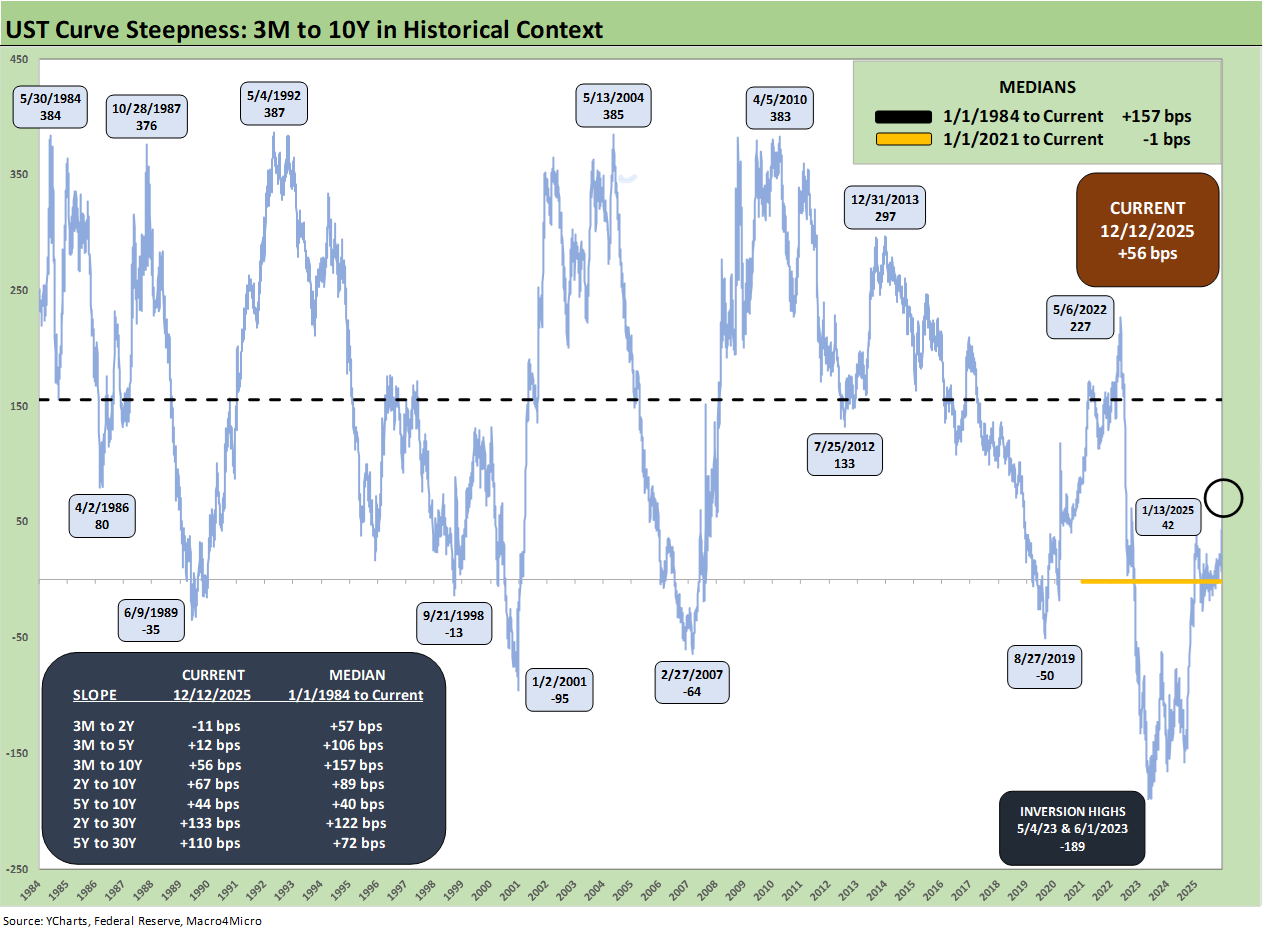
The above chart shows the long-term horizon from 1984. We see the inversions along the way and generally during times when the market timeline does not end well (June 1989, Sept 1998, Jan 2001, early 2007, Aug 2019). There was a lot going on during all those periods which we cover at length in other research. The backdrop after 2015 was an attempt to normalize, and Trump was not happy with any tightening after he took the helm to start 2017.
Looking back across the 3M to 10Y inversions, June 1989 saw the late 1980 LBO boom (and bridge loans) ticking. Sept 1998 was mired in EM problems and LTCM, Jan 2001 was the tech bubble imploding and the mad scramble to ease by Greenspan. Feb 2007 had a few months of structured credit excess and binging to run before the summer of 2007 went into suspended animation.
August 2019 was heading toward a record expansion with spreads tight after a breadth of recovery that stayed impressive until COVID. That post-crisis recovery does not fit the pattern of earlier peak inversions. As most will recall, Trump was trying out his theories on tariffs in 2018 and into 2019. Economic growth was slowing into 2019 and capex plans were getting scaled back even as exports were weakening. Then the Fed stepped in to ease.
The year 2018 was actually quite an ugly one for asset returns as covered in past commentaries (see HY Pain: A 2018 Lookback to Ponder 8-3-24, Histories: Asset Return Journey from 2016 to 2023 1-21-24). The 2018 setbacks were real. Then the FOMC “bailed out” Trumps slowing economy in 2H19, risk asset rebounded sharply and HY credit markets moved into “par plus” mode. We would argue Trump owes Powell a “thank you.”
During 2019, Fed Chair Powell et al. basically saved Trump’s economy, which was most definitely not even close to the “greatest in history” (see Presidential GDP Dance Off: Clinton vs. Trump 7-27-24, Presidential GDP Dance Off: Reagan vs. Trump 7-27-24, Payroll % Additions: Carter vs. Trump vs. Biden…just for fun1-8-25, Annual GDP Growth: Jimmy Carter v. Trump v. Biden…just for fun1-6-25). Even if Trump restated that he had the greatest economy in history 1,000 more times, the numbers will not change.
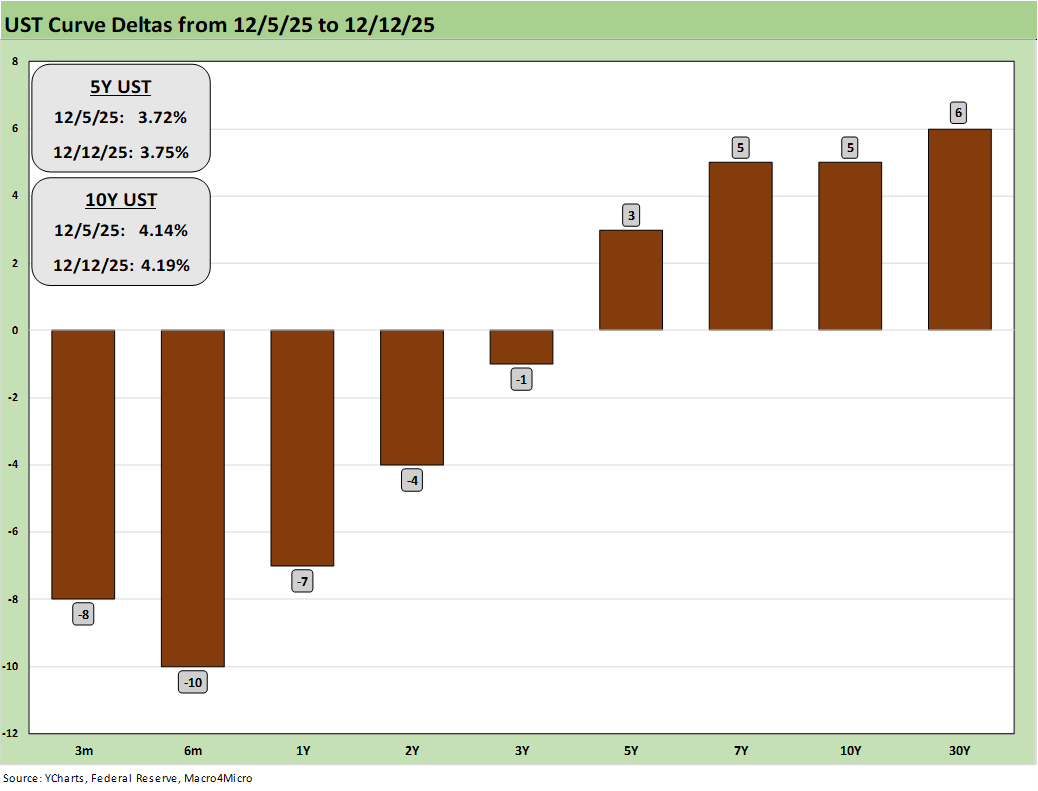
The chart above and below updates some of the UST deltas with the above showing the 1-week move with the FOMC meeting unfolding this past week. This current week should get more interesting with the payroll and CPI data, but the above chart for last week shows a split decision with the short end rallying and 5Y and beyond steepening.
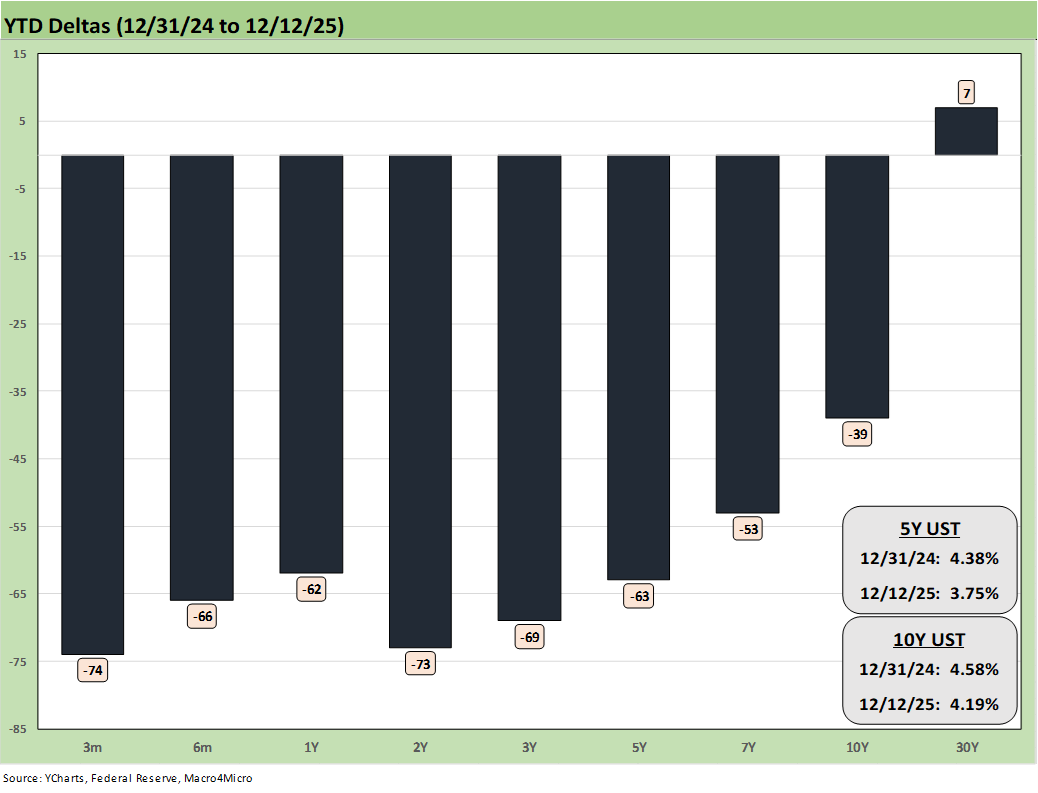
The YTD UST deltas are updated above, and the ability of the UST market to reward duration again in similar fashion in 2026 will require more than a supportive “yes man” as Fed chair. This type of rally in 2026 would seem to require a flight to quality move tied to “bad things” happening in the economy or in the world. Some of the “bad things” could be of a geopolitical nature and there is no assurance that would favor the dollar and UST demand if the “bad things” included trade wars (USMCA reviews) or the EU balking at Trump’s incessant strategic attacks on Europe. The 2026 election worries will be something for trade partners to weigh. The SCOTUS decision on IEEPA will be in hand at some point.
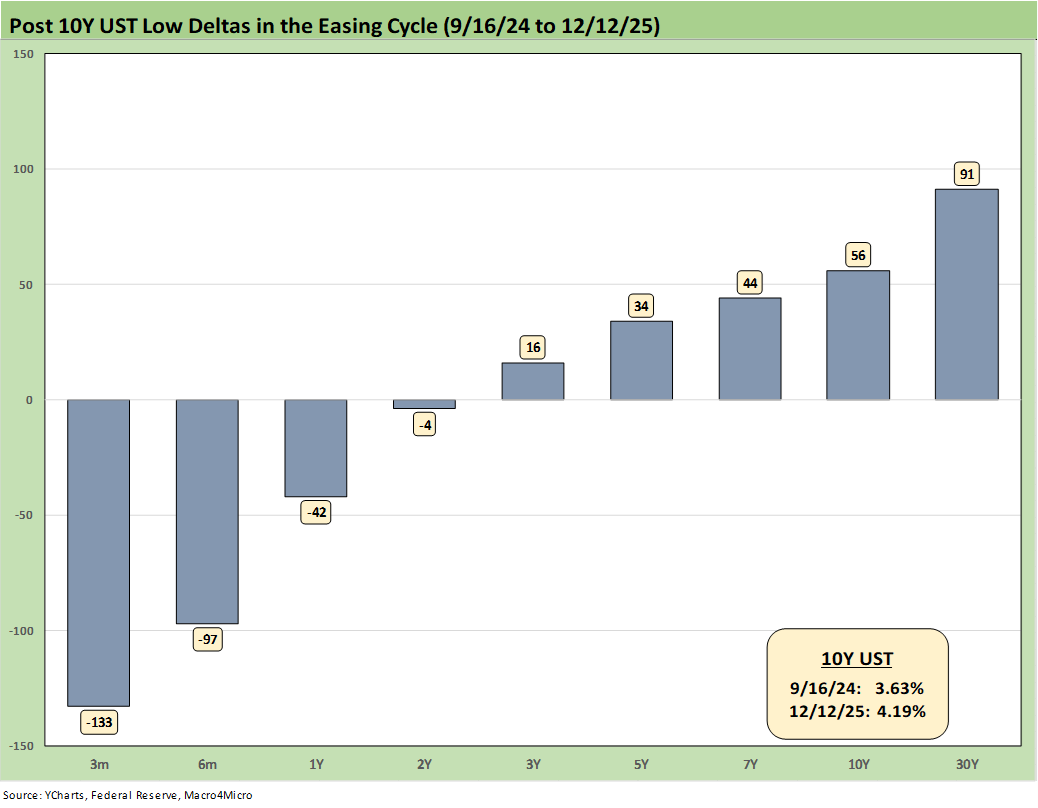
The above chart shows the UST deltas since the 9-16-24 key date when easing was hitting the screen. We see the major move lower driven by the Fed but the less supportive view of the market beyond 3Y UST with the bear steeper further out the curve. With Trump citing “below 1%” as the fed funds goal this week, the supportive FOMC themes get revisited at a time when inflation and UST demand might not be up to the challenge. The desire for extremely low short rates is in part a desire to avoid needing to tap the long end and hurt the 10Y part of the curve and thus mortgages.
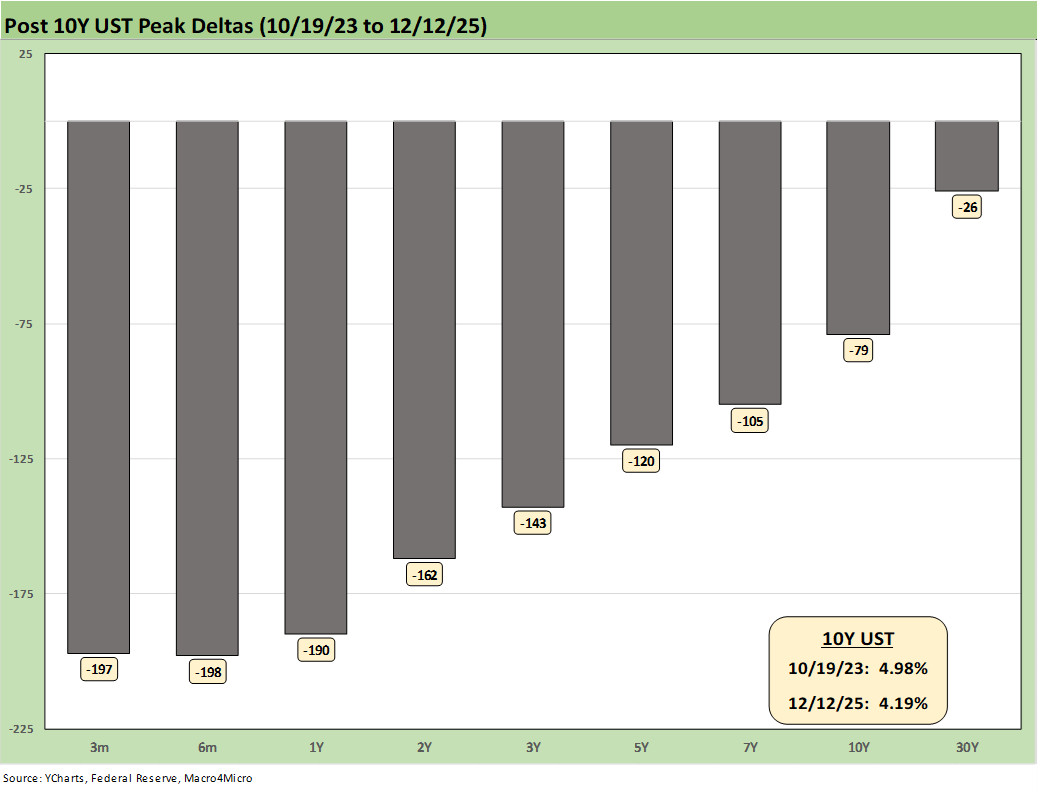
The above updates the running UST deltas from the peak 10Y UST date of 10-19-23. The starting point as of today for the UST curve, the inflation worries in the age of tariffs along with the massive increase in UST supply needs all point to this pattern showing very low odds of repeating.
That curve shape handicapping will be a major factor in asset allocation and how to position along the curve and along the credit tiers. IG and HY have been relatively close in total return performance to this point in the year (see Market Commentary: Asset Returns 12-14-25).
IG has been riding duration winnings as well as favorable excess returns, but HY is also winning on the curve shape and coupons with the BB tier the best excess return performer in HY YTD. HY OAS has seen muted OAS moves on a YTD basis at only -1 bps tighter and the same for IG OAS at -2 bps tighter. HY has seen good spread moves more recently with HY OAS inside the range of the June 2007 zone.
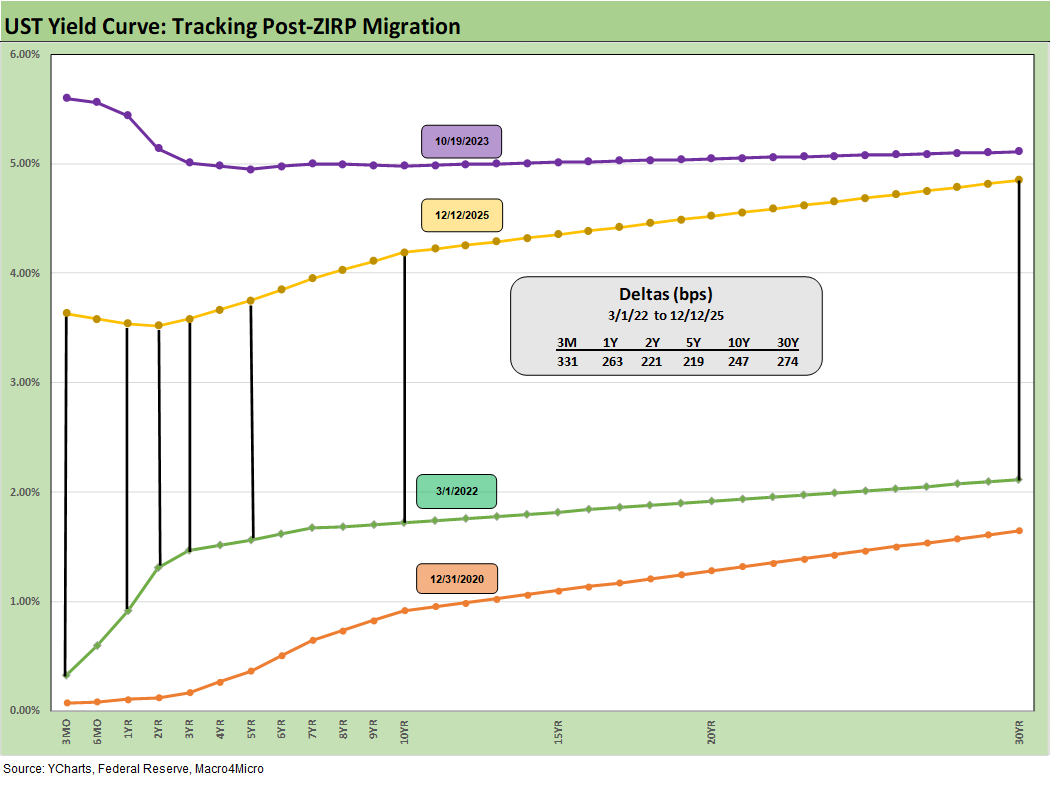
We wrap up with a chart framing the range from the 12-31-20 UST curve after the year of COVID to the 10-19-23 peak 10Y UST curve. We also break out the March 2022 UST curve (3-1-22) in the month when ZIRP ended (effective March 17). We also plot the 12-12-25 UST curve from Friday, which is much closer to the peak than the end of ZIRP. We show the deltas from 3-1-22 to 12-12-25 in the box.
See also:
Market Commentary: Asset Returns 12-14-25
Market Lookback: FOMC Fragments, Rate Debates Murky 12-13-25
FOMC: Dot Plot Scatters for 2026 12-10-25
Employment Cost Index 3Q25: Slowing but Above CPI 12-10-25
JOLTS: Goldilocks’ Ugly Twin 12-9-25
Mini Market Lookback: Data Digestion 12-6-25
PCE, Income & Outlays: Calendar Gap Closing 12-5-25
Credit Markets 12-1-25
Mini Market Lookback: Back into the June 2007 Zone 11-29-25
Durable Goods Sep 2025: Quiet Broadening of Core Capex 11-26-25
Retail Sales September 2025: Foot off the Gas 11-25-25
The Curve: Flying Blind? 11-24-25
Mini Market Lookback: FOMC Countdown 11-23-25
Employment Sept 2025: In Data We Trust 11-20-25
Payrolls Sep25: Into the Weeds 11-20-25
Mini Market Lookback: Tariff Policy Shift Tells an Obvious Story 11-15-25
Retail Gasoline Prices: Biblical Power to Control Global Commodities 11-13-25
Simplifying the Affordability Question 11-11-25
Mini Market Lookback: All that Glitters… 11-8-25
Mini Market Lookback: Not Quite Magnificent Week 11-1-25
Synchrony: Credit Card Bellwether 10-30-25
Existing Home Sales Sept 2025: Staying in a Tight Range 10-26-25
Mini Market Lookback: Absence of Bad News Reigns 10-25-25
CPI September 2025: Headline Up, Core Down 10-24-25
General Motors Update: Same Ride, Smooth Enough 10-23-25
Mini Market Lookback: Healthy Banks, Mixed Economy, Poor Governance 10-18-25
Mini Market Lookback: Event Risk Revisited 10-11-25
Credit Profile: General Motors and GM Financial 10-9-25