
Industrial Production Dec 2025: CapUte Resilience
Industrial Production ended 2025 on a slightly positive note, ticking higher in Dec but declined for 4Q25.


Steady production in dark times…
Industrial Production and capacity utilization (CapUte) stayed in a narrow band across 2025 and finished on a slightly favorable note. The stabilizing factor in the broader cyclical story is the recovery of the consumer in 3Q25 and into 4Q25.
With PCE at 68% of GDP, the consumer will always be the key variable along with unemployment. Unemployment is close to what would be considered full employment in past decades/cycles. The manufacturing sector is not the driver by any stretch, but at least it is not fading.
The fixed investment lines and capex trend line is the part of the economic story that has not lived up to the tariff end game and the tax bill incentives - yet (see Cyclical Histories: Will Facts Be in Vogue in 2026? 1-2-26).
For now, Durables capacity utilization rates at 73.6% in Dec 2025 is below the long-term average of 76.8%. Nondurables at 77.7% is below the 80.0% average from 1972.
The Industrial Production takeaway is a case of economic mediocrity, but the backdrop is not signaling contraction or recession. The subpar metrics are not uncommon across the new millennium cycles in a low-growth US economy undergoing a lot of structural change. We look at those cyclical histories in the charts below.
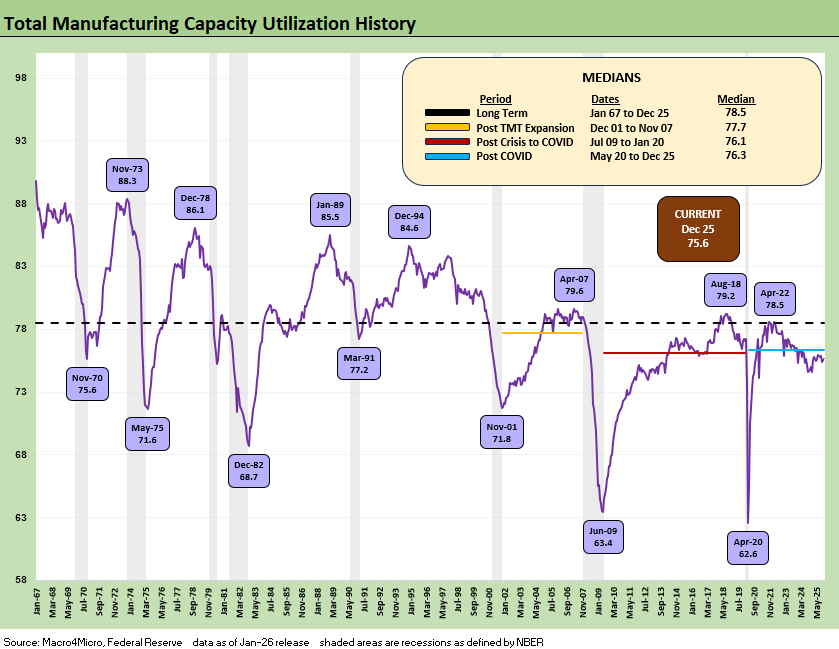
The above table frames the long-term history from 1967. The current capacity utilization level for manufacturing of 75.6% is below the July 2009 to Jan 2020 cycle median (vs. average) of 76.1%. The current level is below the post-TMT cycle through Nov 2007 of 77.7% (note: the credit crisis recession started in Dec 2007).
A material leg down in manufacturing from here requires a massive macro event such as COVID or the systemic bank crisis that also crushed the Auto OEMs and supplier chain. The 1980-1982 stagflationary double dip also shows up across the times series on the “worst of” decline in manufacturing utilization.
The good news is that the US economy is larger, more diverse, and more service-intensive than ever with much lower levels of cyclicality. The tariffs are tied to the fact that the shift to services and global sourcing went too far. That has been the topic for years now. The laws of the dismal science of economics do not magically disappear, and reversing the trends requires painful transition adjustments, higher costs, and disruptions for many businesses. If the current policy choices remain in place, so be it. You just cannot pretend the challenges of adjustments and multiplier effects are not there. That is dishonest (a rare thing in Washington of course). The worst of the impact has fallen on the small business sector.
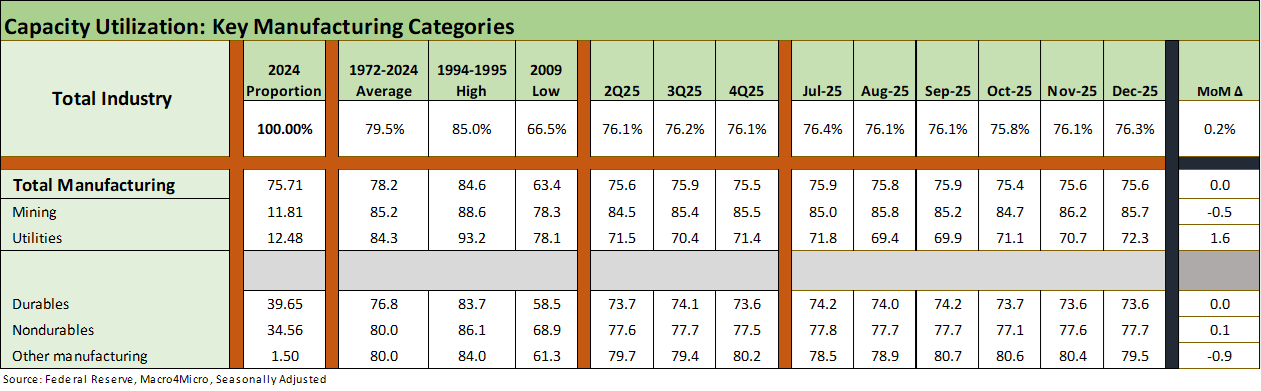
The above table breaks out the trends from the headline level for Total Industry and Total Manufacturing and across the major subsector groupings. We tend to focus on the moving parts of Durables and Nondurables, but Utilities will be getting a lot more focus in 2026 and beyond given the inflation spikes in Electricity and Utilities (Piped) Gas. The Dec 2025 moves in capute were mild for Manufacturing
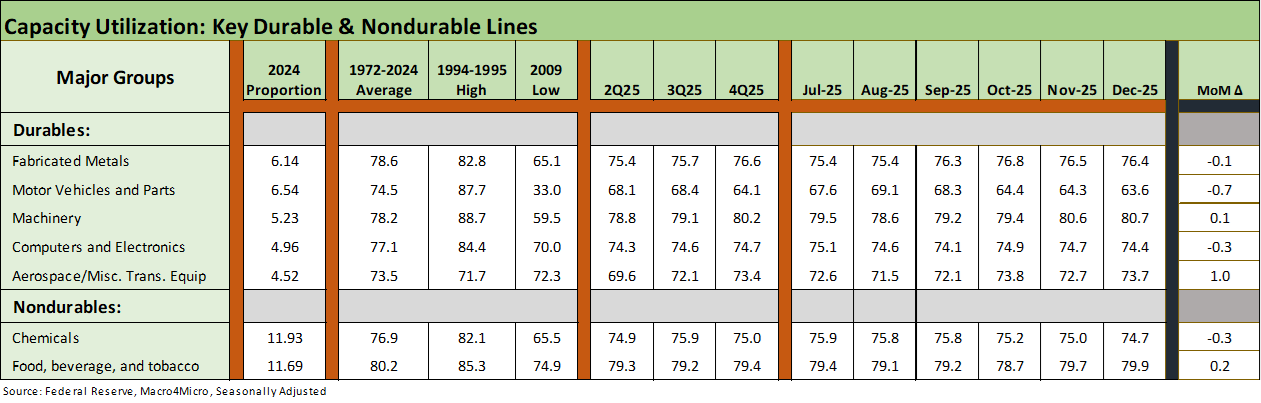
.The above table updates the top 5 Durables subsector and the two largest in Nondurables. We see Aerospace ticking higher and Motor Vehicles and Parts moving lower.
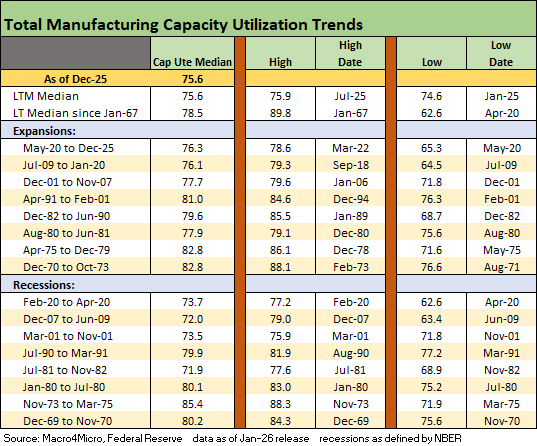
The above table updates the capacity utilization history for expansions and recessions. The ability of more companies to generate solid profits at lower capacity utilization in today’s markets vs. past cycles is tied in part to automation and in part to the development of low-cost supplier chains. Low-cost supplier chains are getting dramatically undermined by tariffs, so the demands to improve efficiency will now be more pressing.
“Tariff cost mitigation strategies” has been a more common phrase since manufacturers need to take action to offset tariff damage to their cost structures. Cost-cutting can impact payroll (headcount reduction), product mix (lower margin product line exposure can be discontinued as we saw with Nike), rental costs (space) can be reviewed, capex planning adjusted (as in lower), and process improvements can bring efficiencies (this is where AI is high on the list).
The current utilization level of 75.6% is below the long-term median from 1967 of 78.5%. That is below half the recession averages from earlier recession periods as noted in the chart. The pressure will be high on manufacturers as we move into 2026 to react to the next wave of “attack tariffs” tied to such matters as the Greenland sovereignty threat. That latest tariff threat against 8 EU countries (Saturday, Jan 17) starts at 10% on 2-1-26 and moves to 25% as of June 1.
Over the past cycle, the low-cost supply chains were risk-mitigating structural advantages of global sourcing. The goal was profit maximization in line with fiduciary duties to shareholders that management teams tend to take seriously. After all, such goals are in line with legal requirements in addition to the risk of litigation or shareholder rebellion.
The Trump tariff policies are based on a highly speculative concept of how tariffs will translate into mass investment in the US to reshore and expand as producers scrap their offshore asset base and pour money into US operations or supplier chains. That capex wave end result is more a matter of faith and speculation for many (notably MAGA) fed in part by partisan misinformation.
Reshoring and capacity shifts are evident in some sectors such as the legacy Detroit 3 OEMs, but the fixed investment lines in GDP reports are not showing those trends -yet (see 3Q25 GDP: Morning After Variables to Ponder 12-27-25, Cyclical Histories: Will Facts Be in Vogue in 2026? 1-2-26).
The truth about tariffs is that this will take quarters and even years for the tariff-price connections to play out. The ability to replace supply chains domestically will take years. In some cases, the reshoring will not happen at all and supplier chain-to-OEM “pain sharing” will need to play out.
The Section 232 tariffs will just keep on coming while the IEEPA tariffs (“reciprocal” is a misnomer) face a key test in front of SCOTUS that has been very slow to arrive. Even if IEEPA gets scuttled by the court decision, Trump will substitute Section 232 tariffs (national security) and/or Section 301 tariffs (unfair trade). There is also Section 122 (trade imbalances), but that comes with a time limit.
Section 301 was a favorite in Trump 1.0 in targeting China. Section 232 has been an abused criteria that includes items such as upholstered furniture (a major stretch for “national security”). Whatever avenue they might pursue, the main question is around retaliation. During 2025 most trade partners backed down except China. This latest Greenland tariff gambit would have more domestic political air cover to fight back
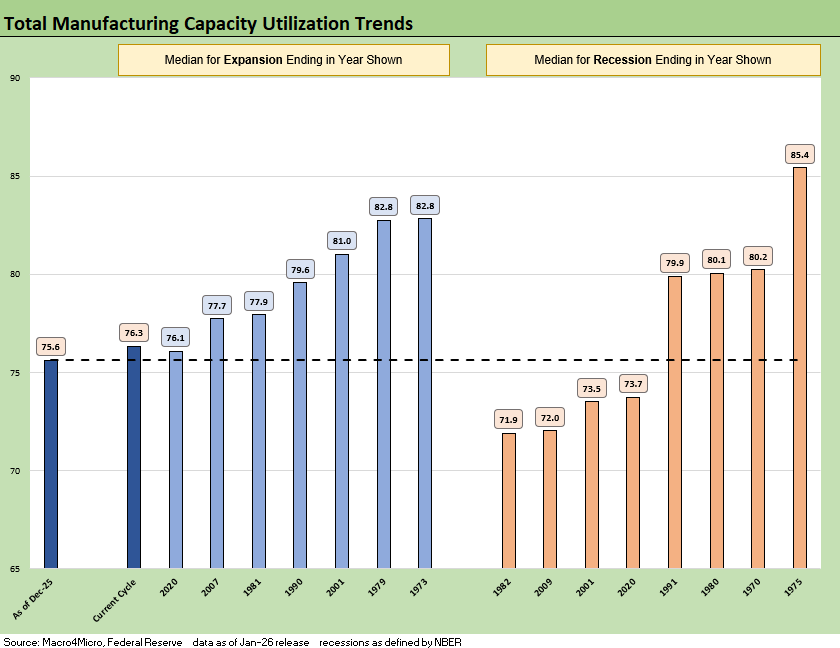
.The above chart details economic expansion and recession averages and lines them up by height as a frame of reference. We see the current level on the left at 75.6%. What has been striking after the credit crisis and protracted recession that followed was that US manufacturing could be so profitable at capacity utilization rates that were below numerous prior recessions.
Low-cost global sourcing was the rage in some industries (notably autos) in the US as well as in Europe. That process had been ongoing for years (e.g., component and finished goods assembly in tech from laptops to semis and integrated tech systems in the pan-Asia chain). That “lower breakeven” plan is now “toast” with the tariffs. The oft-stated theory is that supplier chains will rapidly return to the US or come to the US for the first time. That is a long-term hope.
The theories on reshoring or onshoring combines a level of optimism with a disdain for the concept of “time lags” and willingness of companies to make substantial multiyear capital outlays when the tariffs could be one election away from material revisions. The problem with emergency declarations to enact so many tariffs is that the “next guy” can simply say – in whole or in part – that “the emergency is over.”
Legislation would be a bigger barrier, but these tariffs as of now are all about one decision-maker – Trump. The erratic nature of the tariff numbers and related exemptions were the opposite of what Trump and his team stated at the outset. The idea was that they would be fixed and could be planned around. Then came Liberation Day chaos and the process has been “Dodge City” since then.
The constant changes undermine the ability of companies to plan. For example, Brazil with a US trade surplus at a 10% flat tariff spiked to 50% since they would not release Trump’s “coup bro” from prison.
One way to ease the threat of reversing tariffs later via legislation in the future is to make the federal budget dependent on tariff revenue. In other words, undoing tariffs could lead headlong into a tax legislation battle. Navigating the “reconciliation” process in Congress might support maintaining tariffs. Some tariffs are even in favor with Democrats (notably autos). The revenue line might be needed to evade the filibuster. There is no dialing them back with Trump in office. It was tried by some leading GOP Senators in Trump 1.0 and went nowhere.
We await 4Q25 GDP lines to see how fixed investment is following through in the manufacturing sectors.
See also:
Existing Home Sales Dec 2025: Getting up off the Mat? 1-16-26
Policy Mud on the Wall: Consumer Debt, Residential Mortgages 1-15-26
CPI Dec 2025: Sideways Calms Nerves – For Now 1-13-26
Payrolls Dec 2025 and FY 2025: Into the Weeds 1-10-26
JOLTS Nov 2025: Job Openings and Hires Down, Layoffs Lower 1-7-26
2025 Spread Walks and Multicycle Return Histories 1-5-26
Annual Return Differentials: HY vs. IG Across the Cycles 1-3-26
Total Return Quilt Across Asset Classes 2008-2025 1-2-26
Cyclical Histories: Will Facts Be in Vogue in 2026? 1-2-26
3Q25 GDP: Morning After Variables to Ponder 12-27-25