
Market Commentary: Asset Returns 2-16-26
A mixed week saw divergence in tech performance as the UST curve, CPI, and payroll numbers offered support.


The Dow hit “50,000 dollars.” Need I say more?
A bull flattener carried the day for bonds this week while credit is feeling some slight pressure with +19 bps of HY OAS widening over the past month and +8 bps this week. The trend toward mega-issuance from Big Tech to fund the hyperscalers’ capex programs will get a lot of attention in 2026 around how the profile of the index will change in terms of issuer concentration, credit risk, correlation, and duration sensitivity.
The favorable CPI release helped the rally, but there are still plenty of worrisome line items to annoy the consumer and the voter when they hear how great things are (see CPI Jan 2026: Reassuring Numbers, Missing Pieces 2-13-26).
The payroll numbers beat consensus, but there is still a heavy concentration of the job adds in low economic multiplier sectors such as “Health Care and Social Assistance.” The Manufacturing line posted a rare increase while remaining down by -83K jobs YoY (see Employment Jan 2026: Good Headline, So-So Mix 2-11-26, Payrolls Jan 2026: Into the Weeds 2-11-26).
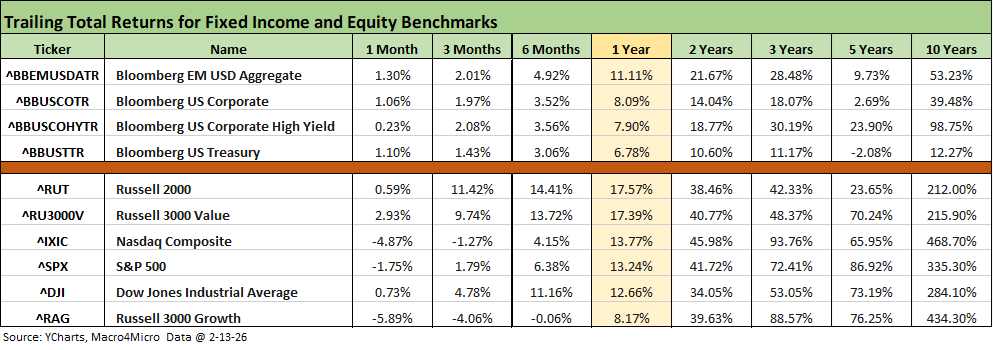
The above table updates some of the main benchmarks in credit and equities that we monitor. The struggles of tech and growth stocks are clearly in evidence in the returns. The trailing 1-month for NASDAQ is -4.87% while the rolling 3-months return is also in the red at -1.27%. Russell 3000 Growth was tagged at -5.89% for the month, -4.06% for 3-months, and a very slight negative for 6 months.
Debt has posted more favorable results on tight spreads and a constructive UST curve move in 2026 with a solid UST rally this week being the main driver. Credit spreads have been steady and largely stable up until the recent HY OAS widening. HY OAS still cleared the week slightly under the high end of the range seen in the June 2007 bubble month. IG OAS remains (barely) in the +70 bps handle range.
The rolling return visual
In the next section, we get into the details of the 32 ETFs and benchmarks for a mix of trailing periods. Below we offer a condensed 4-chart view for an easy visual on how the mix of positive vs. negative returns shape up. We see it as a useful exercise in looking for signals across industry groups and asset classes.
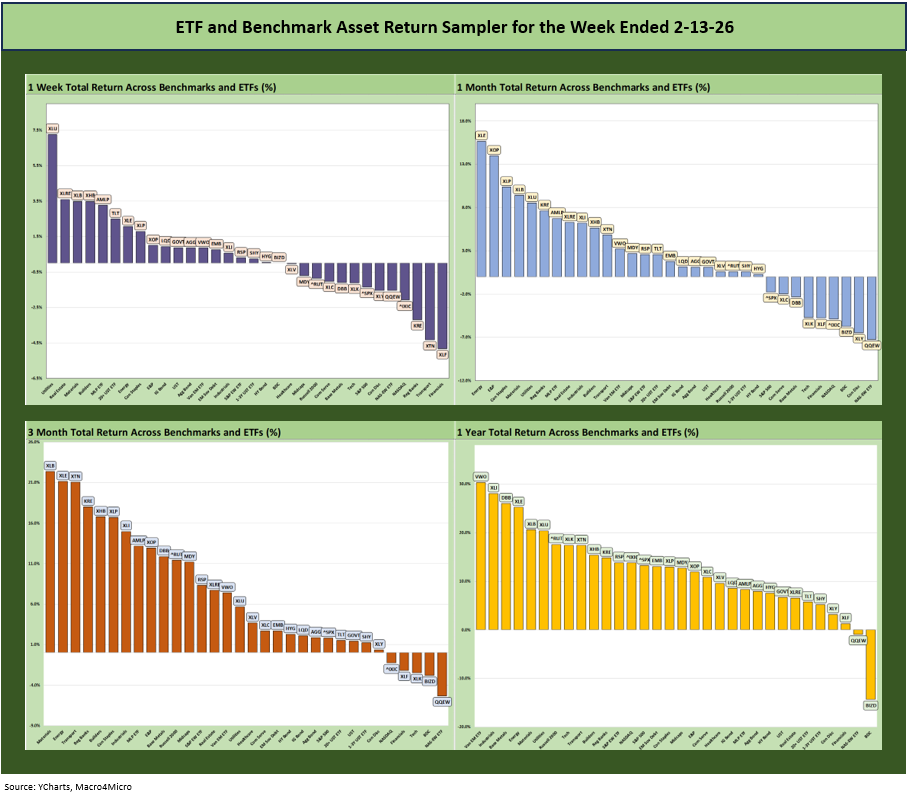
The positive vs. negative symmetry is still favorable with some signs of weakening in early 2026 with all the tech noise as we detail in the charts below. The FOMC policy betting is mixed, but the bias is still favoring easing once the FOMC gets a few more payroll reports and CPI releases under its belt ahead of the new Warsh regime. The “new guy” in the Chair seat will still need to get the broader FOMC team on board.
In terms of economic growth, the sequential GDP and PCE numbers have been trending favorably. We get more data this week. There is plenty to come as key swing factors. The dual mandate needs (full employment, price stability) are subject to plenty of to-and-fro as evident in the Fed leaders’ “speechifying.”
The Magnificent 7 heavy ETFs…
Some of the benchmarks and industry ETFs we include have issuer concentration elements that leave them wagged by a few names. When looking across some of the bellwether industry and subsector ETFs in the rankings, it is good to keep in mind which narrow ETFs (vs. broad market benchmarks) get wagged more by the “Magnificent 7” including Consumer Discretionary (XLY) with Amazon and Tesla, Tech (XLK) with Microsoft, Apple, and NVIDIA, and Communications Services (XLC) with Alphabet and Meta.
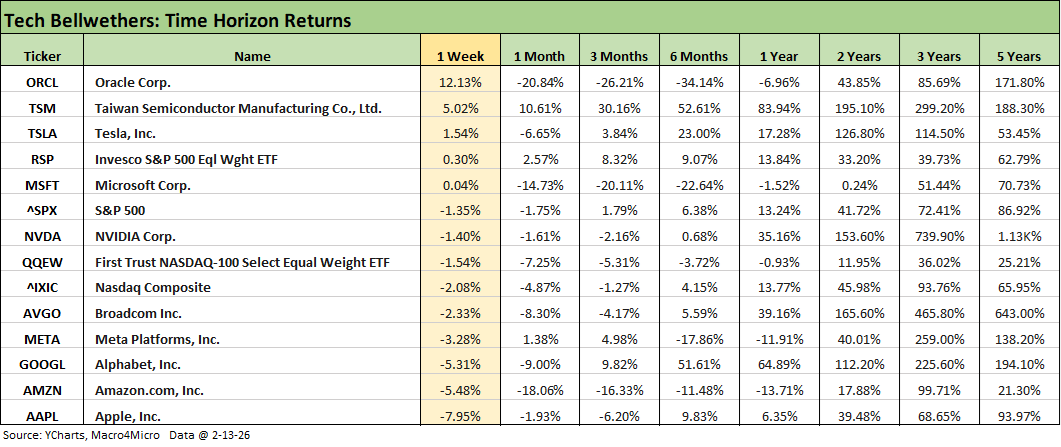
The above table breaks out more time horizon returns for the tech bellwethers including the Mag 7 and the “Mag 7+3” (including Broadcom, Taiwan Semi, and Oracle). For the trailing 1-month, we see 6 of the Mag 7 in the red with only Meta positive. In the other 3 bellwethers, only Taiwan Semi is positive for the month among the “Mag 7+3.”
Perhaps the most telling number is in the trailing 1-year return at this point with Oracle, Microsoft, Meta, and Amazon in negative range. NVIDIA is barely positive looking back 6 months.
We looked at the trailing 1-week returns for the 32 benchmark and ETFs we monitor each week in a commentary we earlier posted on LinkedIn. This is a cut and paste of that note:
Favorable payroll trends and lower inflation did not get the job fully done this past week. A solid 4Q25 earnings season also did not offset some investor angst.
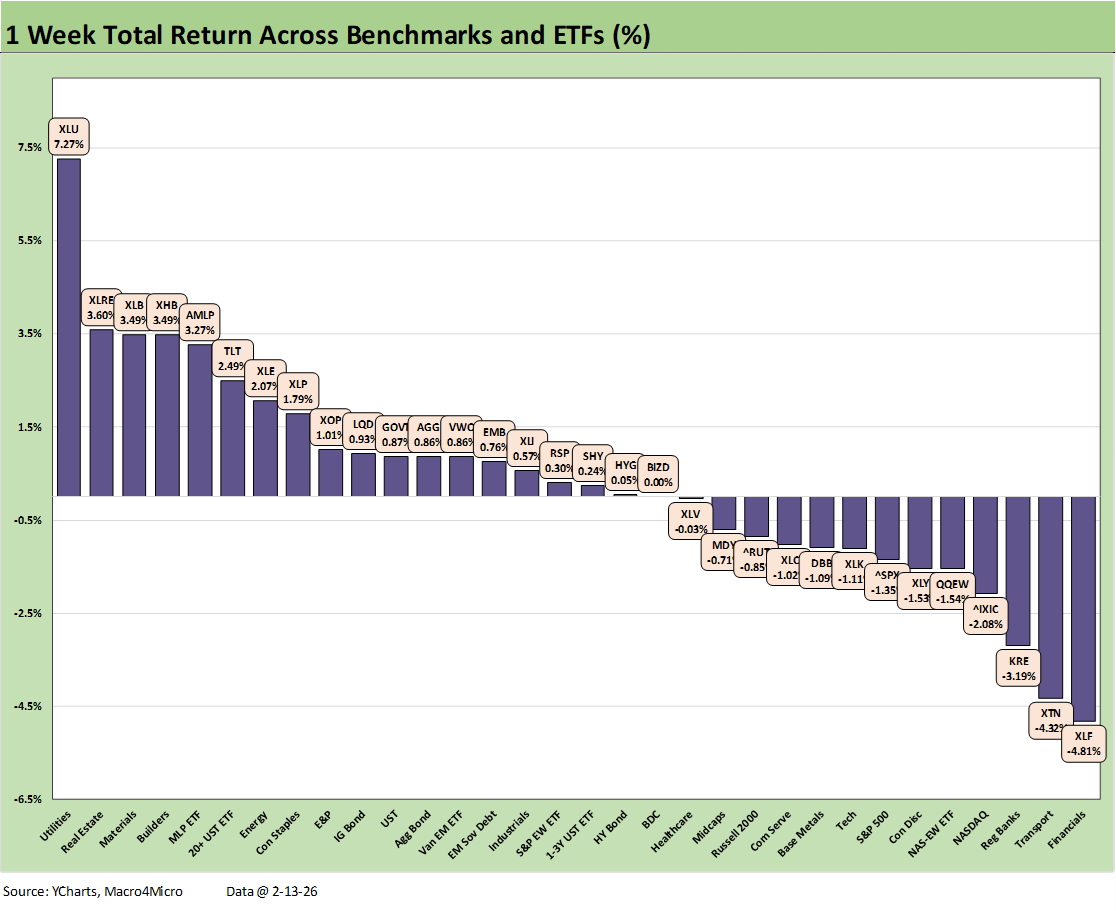
The past week kept the broad benchmarks under pressure with the S&P 500, NASDAQ, Russell 2000, and S&P 400 Midcap all in the red. The UST rally sent the long duration UST ETF (TLT) into the top quartile in our peer group of 32 benchmarks and ETFs. The overall score of 19 positive and 13 negative reflects a mixed set of moving parts across subsectors and industries – and notably tech.
The 11 S&P 500 sectors posted a score of 6-5 favoring positive returns, but the larger sectors such as Info Tech and Communications Services, Financials, and Consumer Discretionary dominated the negative bias in total.
We see the Financials ETF (XLF) on the bottom in the group of 32 with Regional Banks (KRE) 3 off the bottom. The bottom quartile also features NASDAQ, the tech-heavy S&P 500, the Equal Weight NASDAQ 100 ETF (QQEW), and the Tech ETF (XLK). Also lagging was the Consumer Discretionary ETF (XLY) with its heavy weighting in Amazon, which posted a -5.5% return on the week. Consumer credit quality is drawing some headlines lately including from the NY Fed, which includes some attention to upticks in delinquent mortgages.
The Utilities ETF (XLU) was the runaway winner for the week at +7.3% as XLU has hung around in the top quartile for the trailing 1-month and 3-months period as well as the trailing year. The sleepy dividend-fixated utility sector of bygone years has morphed into a growth story now. Electricity prices and supply-demand imbalances show up in detail as part of the AI and Data Center fundamentals and in a damaging Energy Services CPI story line. For piped utility natural gas, the CPI headlines also are tough on consumers and businesses.
The energy story was positive again this week for the Energy ETF (XLE) and Midstream ETF (AMLP) with the E&P ETF (XOP) just short of the top quartile. The UST rally rewarded the Homebuilder ETF (XHB), the cyclical Materials ETF (XHB), and the dividend-heavy Consumer Staples ETF (XLP). All 7 bond ETFs were in the positive return range despite HYG feeling some spread widening and thus barely positive.
We looked at the trailing 1-week returns for the 32 benchmark and ETFs we monitor each week in a commentary we posted on LinkedIn earlier today. This is a cut and paste of that note:
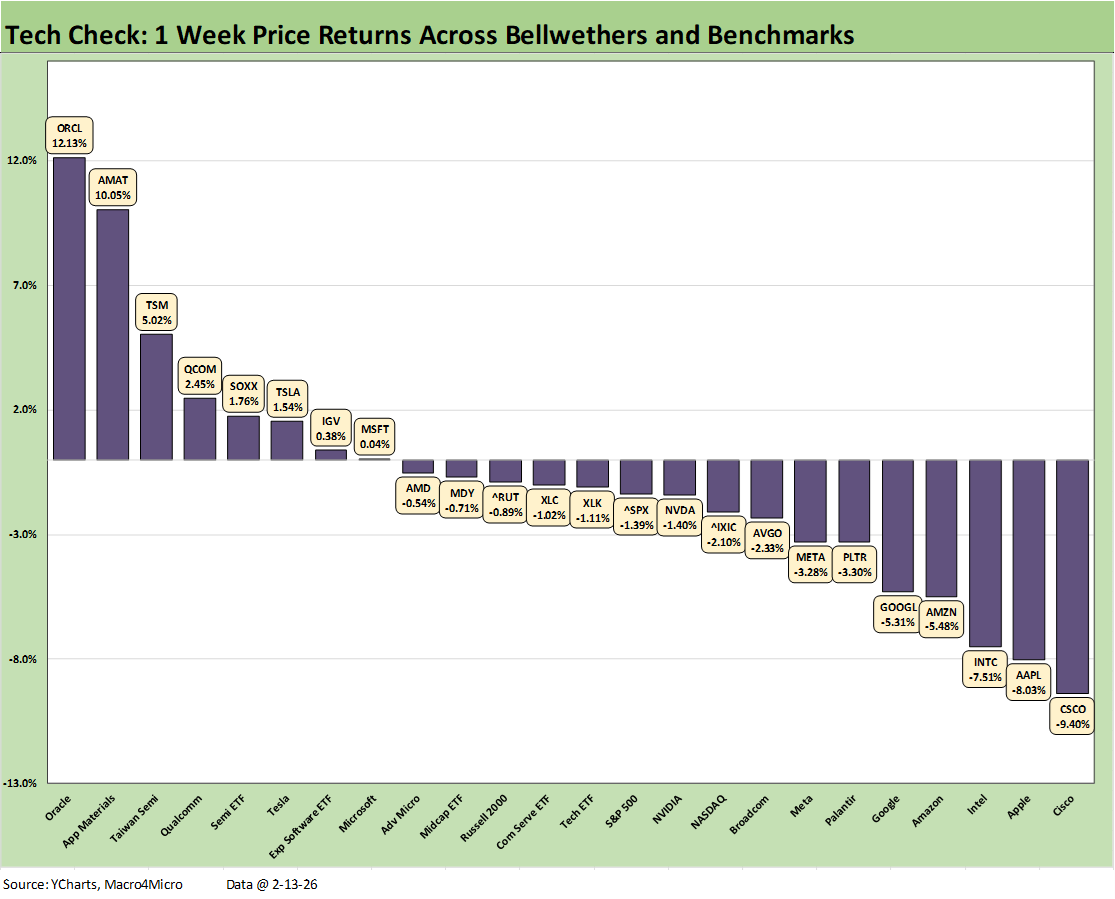
The tech bellwethers remained under the gun this past week following the turmoil of the prior week. The debate around the Good, Bad, and Ugly checklist of AI evolution is now setting off bouts of volatility tied to the downside of the multiplier AI effects.
The worries have infected major software and analytics providers as worst case scenarios get handicapped. We addressed the moving parts in last week’s LinkedIn posts, and the negative bias was evident again this week.
The above chart updates the peer group of benchmarks, single names, and ETFs that we use in our weekly tech check. The 24 lines show 8 positive and 16 negative price returns with the main broad benchmarks/ETFs (S&P 500, NASDAQ, Russell 2000, and S&P 400 Midcaps) all in the red.
We see 5 of the Mag 7 post negative price returns on the week with MSFT barely positive and TSLA marching to its own beat with a more distinctive set of valuation drivers. ORCL bounced back to #1 in the current week with +12.1% after being dead last the prior week with -13.2%. ORCL has experienced an especially rough ride of late at a -26% return over the rolling 3 months.
The software ETF (IGV) clawed back into positive range this week while the Semis ETF (SOXX) was positive in both weeks. IGV has been beaten up since late fall while SOXX had been strong.
Last week had some old school names (Intel, Cisco) at #1 and #2, but those two dropped back down to near the bottom of the list this week. The tech equity community is in a mad scramble to get into the weeds on which names are more exposed or insulated and which subsectors (semis, capital equipment, software) can make their case as winners or get tagged as losers. Applied Materials (AMAT) was in the positive range both weeks and the same for Taiwan Semi.
The valuation boom was built on speculative assumptions (even if very well informed speculation). The 1000-pound gorillas in the space are doing a lot more than guessing with close to $1 trillion in 2026 capex announcements with a big slice of that from the major names at over $600 bn. The speculative fervor is now looking for negative outcomes and assembling a “winners and losers” list.
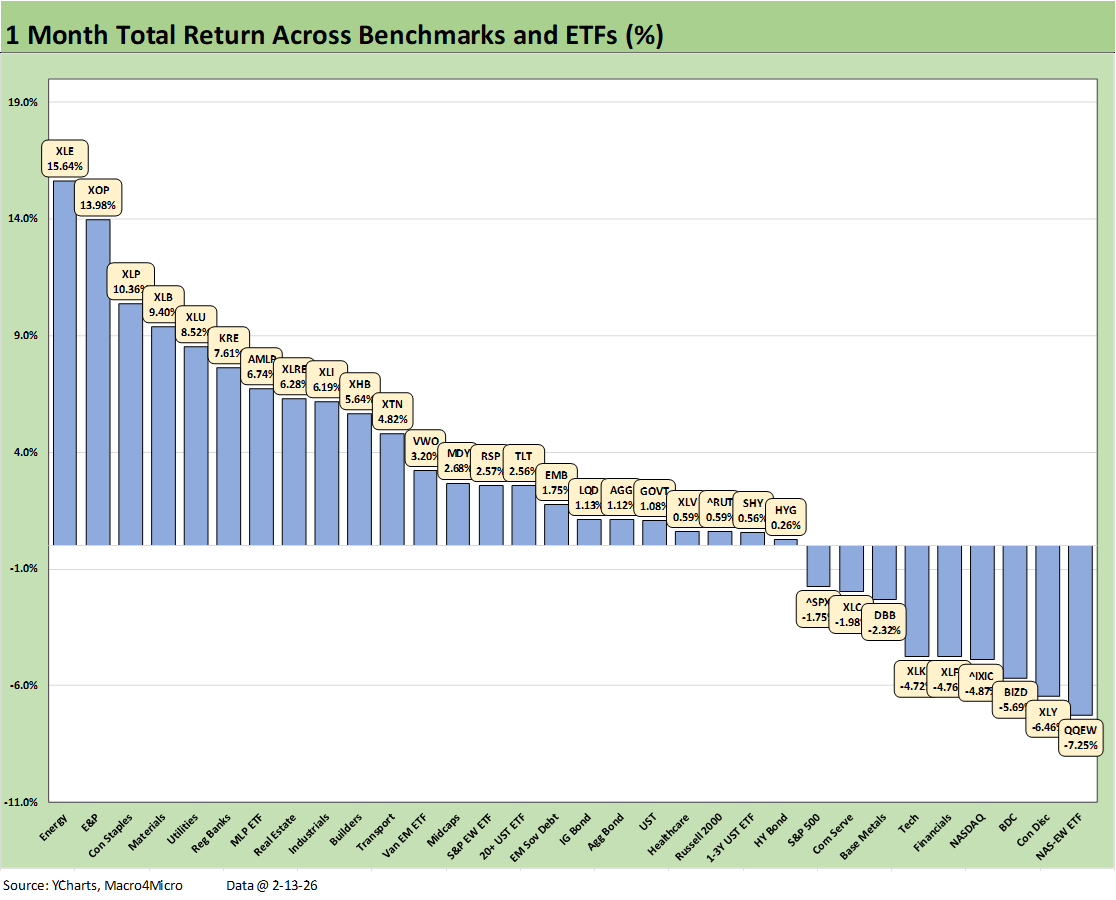
The above chart plots the trailing 1-month returns for the 32 benchmarks and ETFs that we monitor. A positive vs. negative score of 23-9 is a respectable start to 2026 by the numbers. There were no shortages of record high stock prices under both Biden and Trump, but the trick is voters want to feel like they are in on the good news.
For the month, all the bond ETFs are positive with HYG only slightly so on credit spread widening. The UST move was supportive this week, and the strong 4Q25 earnings season should be offering some comfort to the upper HY credit tiers, medium grade layers, and higher quality credit tiers. The high grade tiers will be facing some supply tests with the sheer volume of tech issuance to fund capex during a period when tech equities have been volatile.
The bottom tier returns for the 1-month timeline is concentrated in tech with 5 of the 8 names in the low quartile being tech-based names. We see the Equal Weight NASDAQ 100 ETF (QQEW) in dead last joined in the bottom ranks by Consumer Discretionary (XLY) with its Amazon concentration, the NASDAQ, the Tech ETF (XLK) and Communications Services (XLC). Just above, in the bottom of the 3rd quartile is the S&P 500 with its heavy weighting of Info Tech and Communications Services. Financials (XLF) has also been a laggard.
The top quartile has 3 energy related names with the Energy ETF (XLE) at #1 and E&P (XOP) at #2 and Midstream (AMLP) at #7. The favorable UST curve dynamics supported dividend heavy ETFs such as Consumer Staples (XLP), Utilities (XLU), and Real Estate (XLRE).
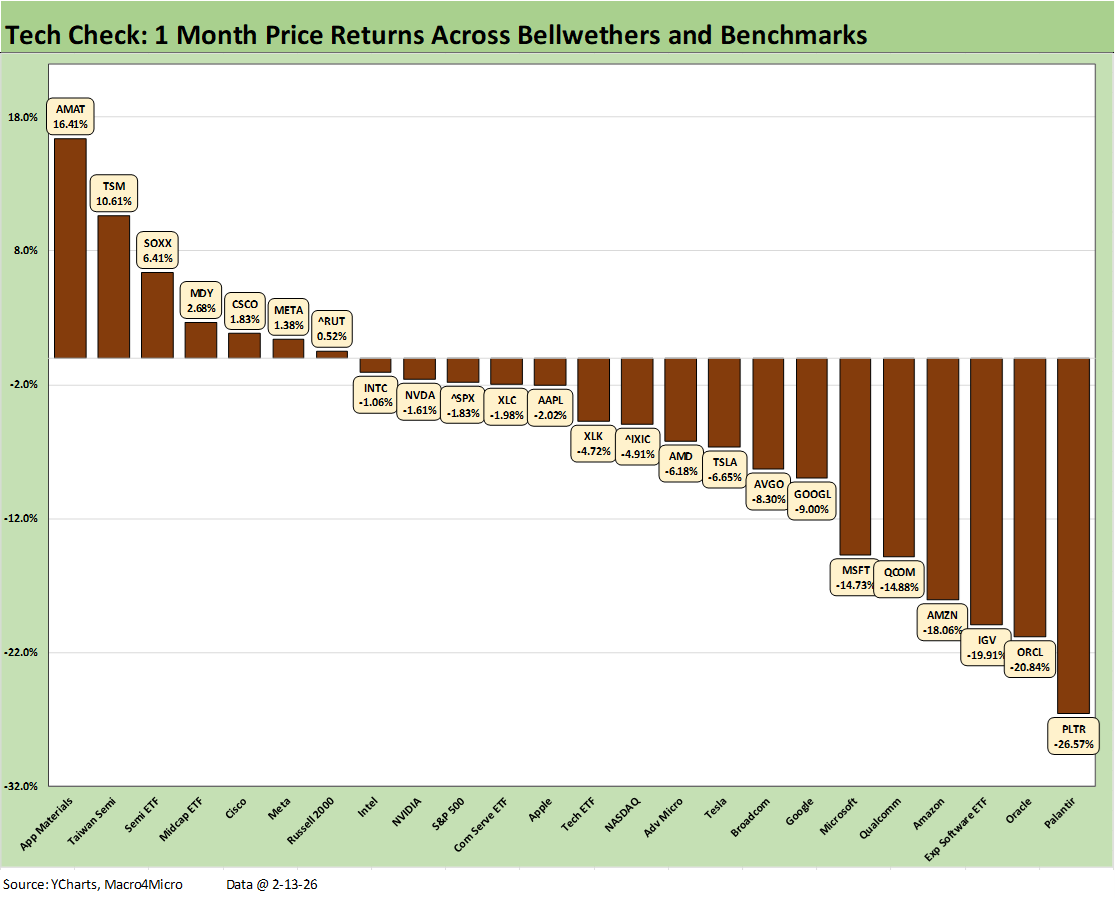
The above chart highlights the tech chaos with so many of the 24 names included above in the red. The weakness is tied to speculative scenarios around AI fallout. We see 17 of the 24 asset lines in negative range. We see Midcaps and Russell 2000 in positive range with the Semiconductor ETF (SOXX), but the few single names in positive range include Applied Materials at the #1 slot followed by Taiwan Semi at #2. The sole Mag 7 name to post a positive return was Meta.
The weakest performers are easy to scan, but Palantir sits on the bottom with Oracle in second to last with the Software ETF (IGV) three off the bottom. Amazon and Qualcomm round out the bottom 5 just slightly worse than Microsoft.
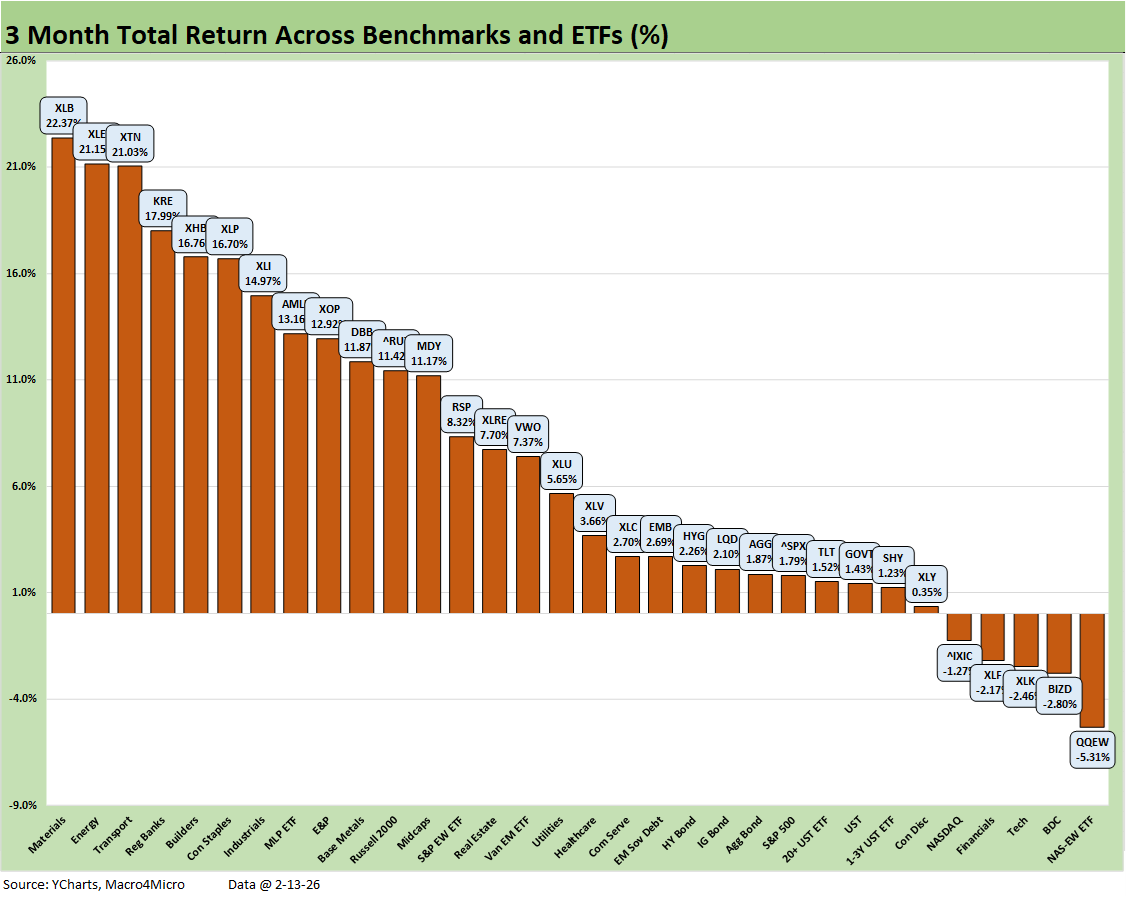
The trailing 3-month performance is solid at a 27-5 score. The sector rotation theme is very much in evidence with the cyclical Materials ETF at #1, Transports at #3 with Industrials (XLI) in the mix at #7. We even saw some data centric freight and logistics services providers take some heat for AI risk.
We see the UST curve supporting the interest rate sensitive Homebuilders (XHB) for the past three months and the dividend heavy Consumer Staples (XLP) along with it. The Energy names took some top tier slots with XLE and AMLP, but XOP just outside the top quartile.
The big gap between Regional Banks (KRE) in the top quartile and broad Financials (XLF) in the bottom quartile is a trickier topic. The regional banks have had their scary moments in recent years (spring 2023) but are in consolidation mode and are less exposed to the credit card regulation headlines. The FOMC actions and cyclical credit quality apply to both KRE and XLF.
As we see in other recent timelines, tech has badly underperformed with 4 tech-centric lines in the bottom quartile. The Equal Weight NASDAQ 100 ETF (QQEW) is on the bottom with the BDC ETF (BIZD) in second to last with all the adverse coverage of private credit and some headline meltdowns that fed extrapolation exercises and dividend warnings.
The bottom quartile includes the Tech ETF (XLK), the NASDAQ, and the Consumer Discretionary ETF (XLY) with its heavy Amazon exposure. AMZN equity posted an ugly -16.3% over 3 months.
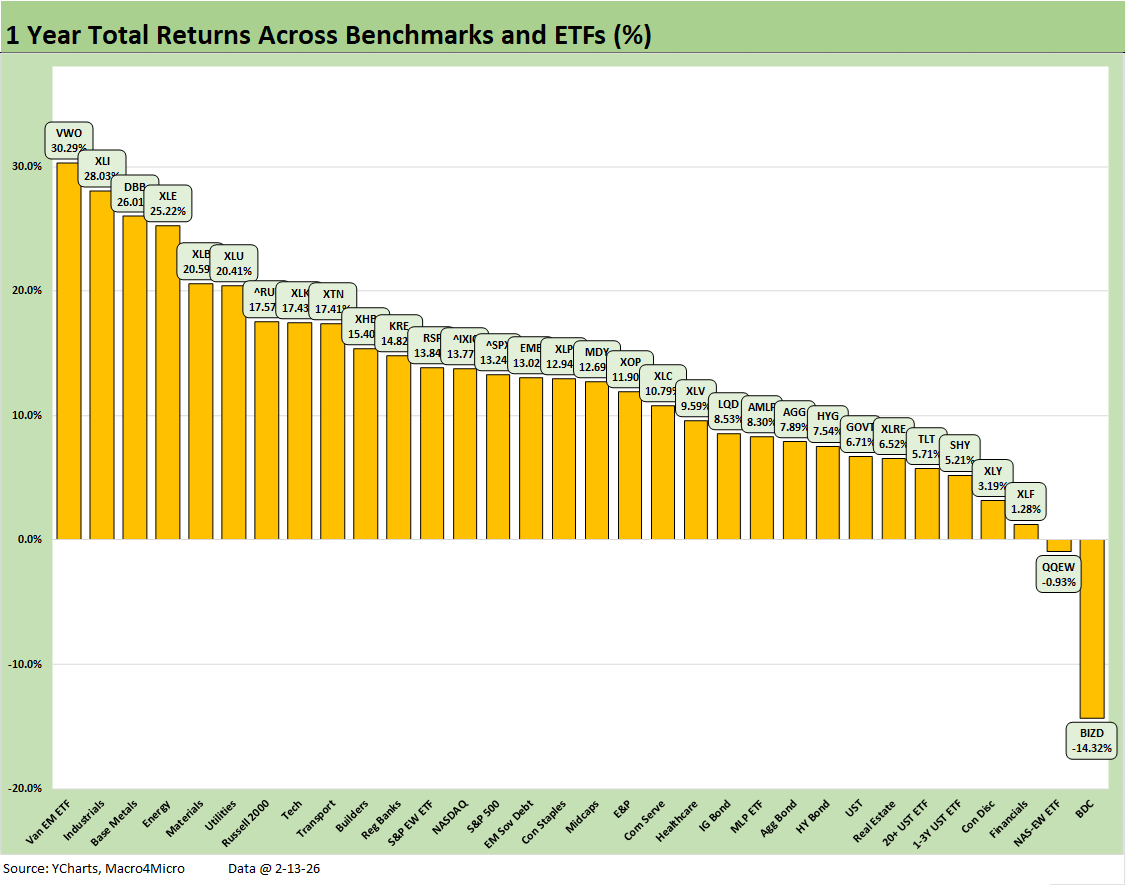
The 30-2 score LTM makes for an easier assessment on a good trailing year overall with the median return in the mix just under 13% and 17% handle returns to make the top quartile. The Hi-Lo range (VWO vs. BIZD) was almost 45 points. The big loser was the BDC ETF (BIZD) on the back of brutal headlines around private credit even if the brush was spreading a lot of paint on BDCs that showed better underwriting and risk management practices. The dispersion across the BDC peers in equity performance was extreme. The reality is that a few major private credit borrower meltdowns and some major fraud cases spooked the markets.
See also:
CPI Jan 2026: Reassuring Numbers, Missing Pieces 2-13-26
Existing Home Sales Jan 2026 2-12-26
Payrolls Jan 2026: Into the Weeds 2-11-26
Employment Jan 2026: Good Headline, So-So Mix 2-11-26
Retail Sales Dec 2025: Muted Year-End 2-11-26
Market Lookback: Monkey Business 2-9-26
Market Commentary: Asset Returns 2-8-26
Switzerland-US Trade: A Deficit that Glitters 2-3-26
US-Taiwan Trade: Risks Behind the Curtain 2-1-26
Market Commentary: Asset Returns 2-1-26
Trade Deficits: Math Challenge 1-30-26
China Trade: Shrinkage Report 1-28-26
Mexico Trade: Gearing up for More Trade Trouble? 1-27-26
Canada-US Trade: Trump Attack N+1 1-25-26
PCE Income & Outlays Nov 2025: Resilient Consumer, Higher Inflation 1-24-26
3Q25 GDP: Updated Estimate 1-22-26
Industrial Production Dec 2025: CapUte Resilience 1-17-26
Policy Mud on the Wall: Consumer Debt, Residential Mortgages 1-15-26
CPI Dec 2025: Sideways Calms Nerves – For Now 1-13-26
2025 Spread Walks and Multicycle Return Histories 1-5-26
Annual Return Differentials: HY vs. IG Across the Cycles 1-3-26
Total Return Quilt Across Asset Classes 2008-2025 1-2-26