
Market Commentary: Asset Returns 2-1-26
We update asset returns after a mixed month, a new Fed Chair named, erratic geopolitics, and even worse domestic political functionality.

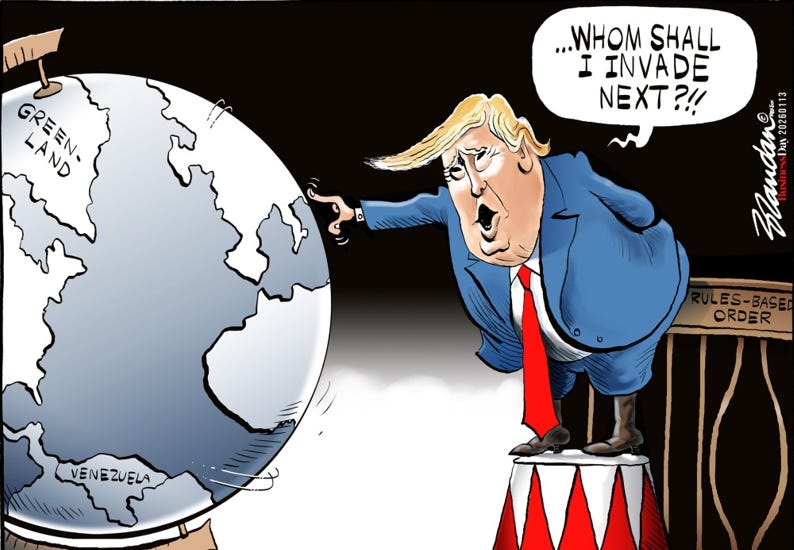
Spinning the wheel of fortune?
The past month has seen a wave of risk factors with attacks on NATO allies (some diplomatic, some almost literal), a Venezuela military action where the rationale quickly morphed, an “armada” deployed to support Iran threats, and domestic turmoil around ICE that generated some manageable budget/shutdown threats. That is all set against better-than-expected GDP growth but minimal inflation progress (see PCE Income & Outlays Nov 2025: Resilient Consumer, Higher Inflation 1-24-26, CPI Dec 2025: Sideways Calms Nerves – For Now 1-13-26). We get more payroll info this week.
The GDP numbers tend to get overhyped by annualizing quarters and ignoring the distortions from the unprecedented tariffs and accounting treatment of declining imports and working capital whipsaws. We prefer to lock in on the PCE line in GDP for consumer trends and the fixed investment lines for investment reality. The consumer is doing much better (or in some cases leveraging up and borrowing), but the investment promises still are not in the numbers with weak GPDI (see 3Q25 GDP: Updated Estimate 1-22-26, Cyclical Histories: Will Facts Be in Vogue in 2026? 1-2-26).
The good news across the asset lines has been the Russell 2000 small caps that just missed the top quartile for the 1-month timeline with midcaps not far behind and both ahead of the large caps. The vote of confidence in earnings season is a positive sign while earnings are not rattling the cyclical confidence even where there is some debate over valuation in the large caps.
Financials are all over the place with the broad Financials ETF (XLF) struggling but Regional Banks (KRE) solid. BDCs (BIZD) face ugly headlines that tend to get extrapolated into a broader credit quality crisis, but the HY bond pricing and stability is reassuring. The 10% credit card cap roiled the markets somewhat for large banks, but the FOMC actions and curve dynamics will remain the main event.
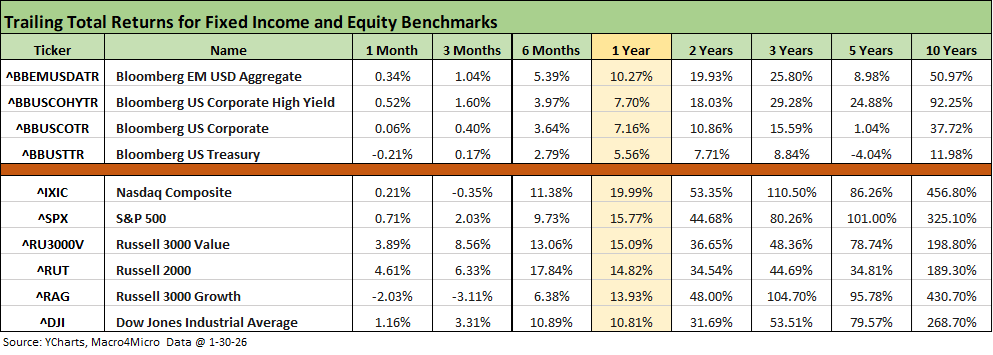
The above table shows an unimpressive start to 2026 but a solid 3-month run across some major headlines and near disasters. Growth benchmarks have been weak, but Russell 2000 and Value benchmarks have been solid. Bonds have struggled with inflation remaining stubborn, tariffs are still a source of worry, and some major risk factors lurk dead ahead with the USMCA review and EU’s lingering shock on the near NATO demise and Greenland fiasco.
The 1-month and rolling 3-month periods included a near meltdown of NATO with no explicit Congressional involvement apart from backroom whispers. Besides military threats (before he withdrew those at Davos), Trump also threatened tariffs on major EU allies who refused to approve of his violation of sovereignty of a NATO ally. It was especially strange – even for Trump.
The disaster avoidance was a relief and brought a very muted reaction in the aftermath. The market has started grading on the curve with Trump’s typical behavior being the curve. Trump sets a high bar for worrisome irrational economic policies at odds with basic facts and concepts and that gets chalked up to “TACO” or just “Trump being Trump.” The irony is that can be reassuring to the market. Liberation Day and the threatened invasion of a NATO ally sets a very high bar for defensiveness. The US dollar has reacted, and it has been a bad period for the dollar, but not dramatically so when looking back across time on where the dollar has been valued.
The rolling return visual
In the next section, we get into the details of the 32 ETFs and benchmarks for a mix of trailing periods. Below we offer a condensed 4-chart view for an easy visual on how the mix of positive vs. negative returns shape up. We see it as a useful exercise in looking for signals across industry groups and asset classes.
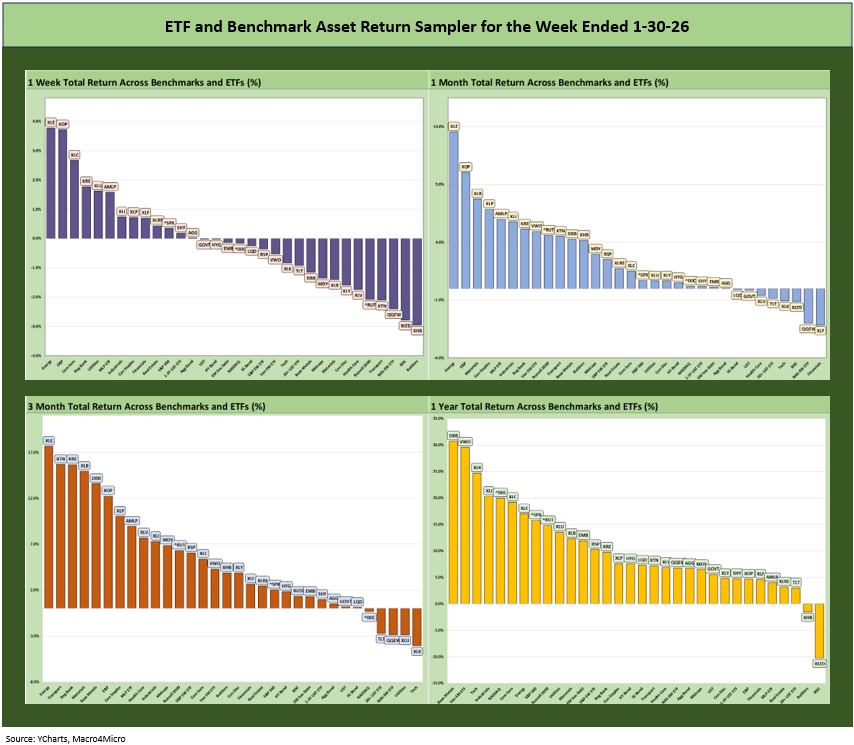
The symmetry above shows the favorable mix of 1-month, 3-month and LTM positive vs. negative balance. The past week was soft. There is a lot going right in the economy even with the payroll worries and potential for more threatening “policy event risk.” Half the country is in a comfort zone around Trump’s conduct and half sees the White House as an insane asylum. Some see too much Mussolini, Epstein, gold fixation, and ballroom self-celebration and not enough Graham & Dodd, free trade, or FDR (concerns for lower economic tiers). That is why God made elections (in theory), and 2026 is the midterm.
The Magnificent 7 heavy ETFs…
Some of the benchmarks and industry ETFs we include have issuer concentration elements that leave them wagged by a few names. When looking across some of the bellwether industry and subsector ETFs in the rankings, it is good to keep in mind which narrow ETFs (vs. broad market benchmarks) get wagged more by the “Magnificent 7” including Consumer Discretionary (XLY) with Amazon and Tesla, Tech (XLK) with Microsoft, Apple, and NVIDIA, and Communications Services (XLC) with Alphabet and Meta.
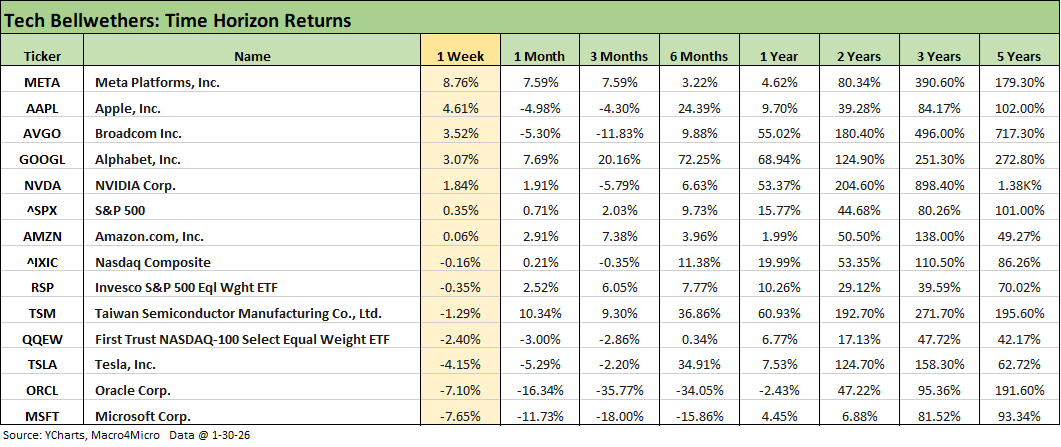
The above table updates the tech bellwethers and some relevant broad benchmarks and ETFs. We again see a divergent performance across the Mag 7 names with Meta rewarded for its earnings report and Microsoft hammered by questions around its growth rates despite very strong numbers. The sensitivity of the market to any hints of companies missing bullish growth targets in the face of massive spending generates outsized responses.
The return mix for the week showed 5 of the Mag 7 positive and 2 negative. Looking at the “Mag 7+3,” we see 6 positive and 4 negative in a continuation of mixed performance across 1-week, 1 month, and 3 months as posted in the table. MSFT has faced a rough ride over the past 3 months and so has Oracle.
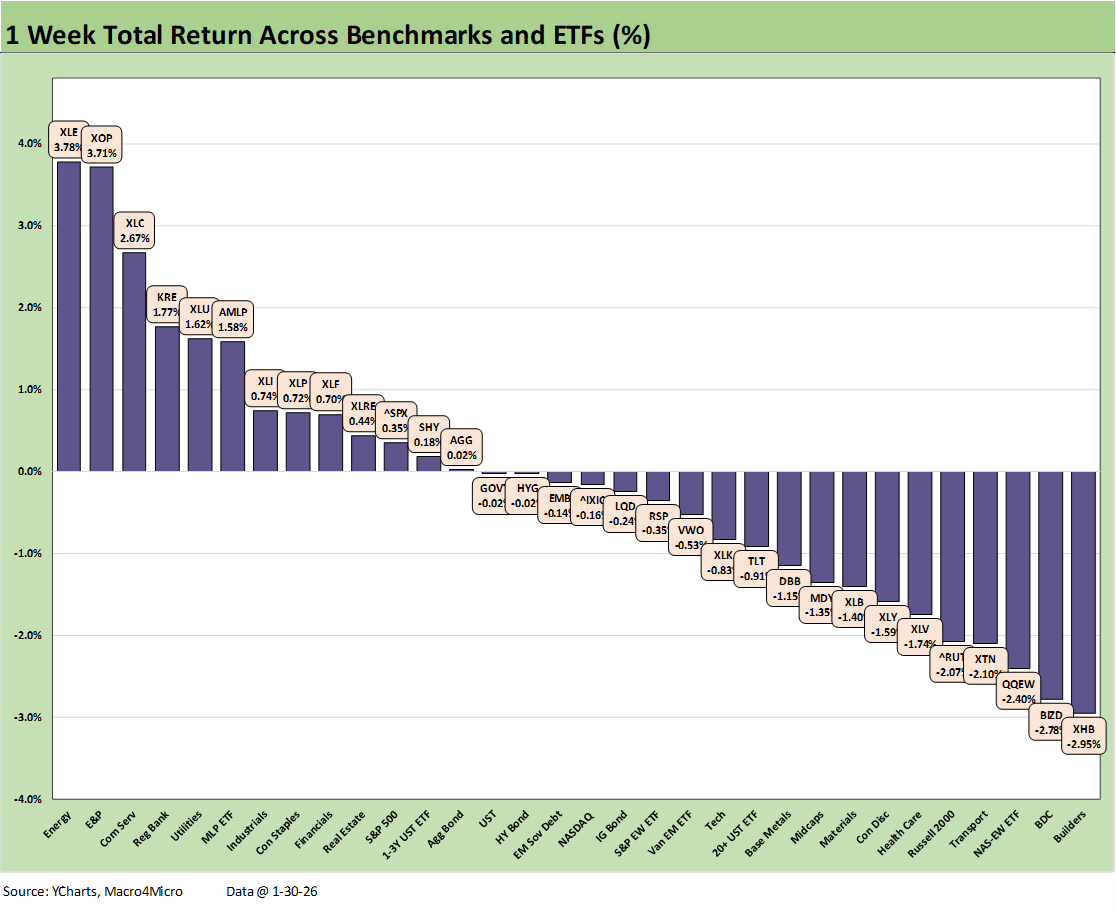
We already looked at the 1-week numbers in a LinkedIn post, and the top quartile saw only one tech-centric member with Communications Services (XLC) making the top quartile on the back of Meta and Alphabet. Energy-related ETFs carried the week with the broad Energy ETF (XLE) at #1, E&P (XOP) at #2, and Midstream (AMLP) at #6. Regional Banks (KRE) made the top tier while the broader Financials ETF (XLF) lagged modestly after a bad month (detailed in the next chart).
Tech struggled overall with the Equal Weight NASDAQ 100 (QQEW) in the bottom 3 and the Tech ETF (XLK) in the third quartile. The low quartile showed Homebuilders (XHB) on the bottom list ahead of the BDC ETF (BIZD). The Russell 2000 faltered this week and dropped into the bottom tier.
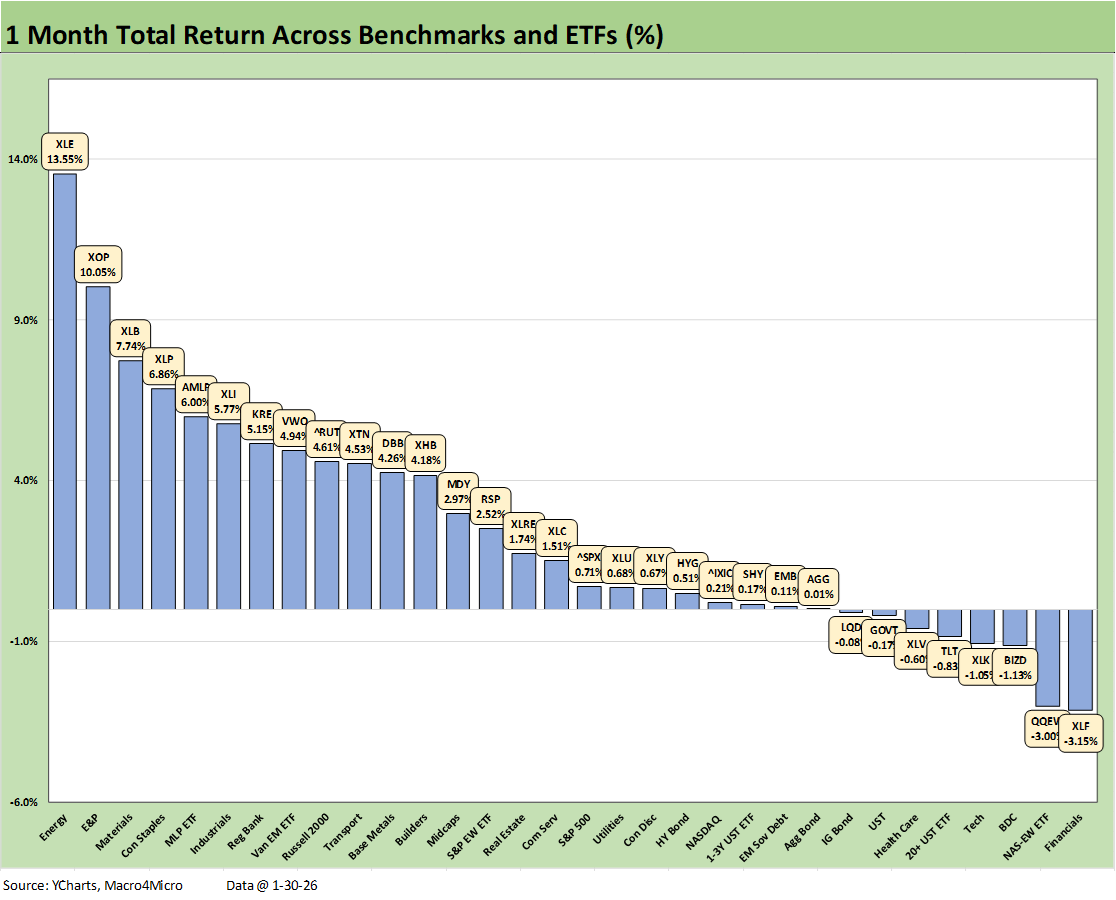
The 1-month timeline showed a very respectable score of 24-8 with Energy ETF (XLE) at #1 and E&P (XOP) at #2 and Midstream (AMLP) making the top 5. We see no tech line items in the top tier with Communications Services (XLC) in the bottom of the second quartile. The Equal Weight NASDAQ 100 (QQEW) and Tech ETF (XLK) are in negative range in the bottom tier.
It was a tough month for duration performance with 3 bond ETFs in the red with the long duration UST ETF (TLT) the worst performer and joined in negative range by GOVT and LQD. The Financial ETF (XLF) sat on the bottom with the 10% credit card cap headlines not helping even as Regional Banks (KRE) made the top quartile.
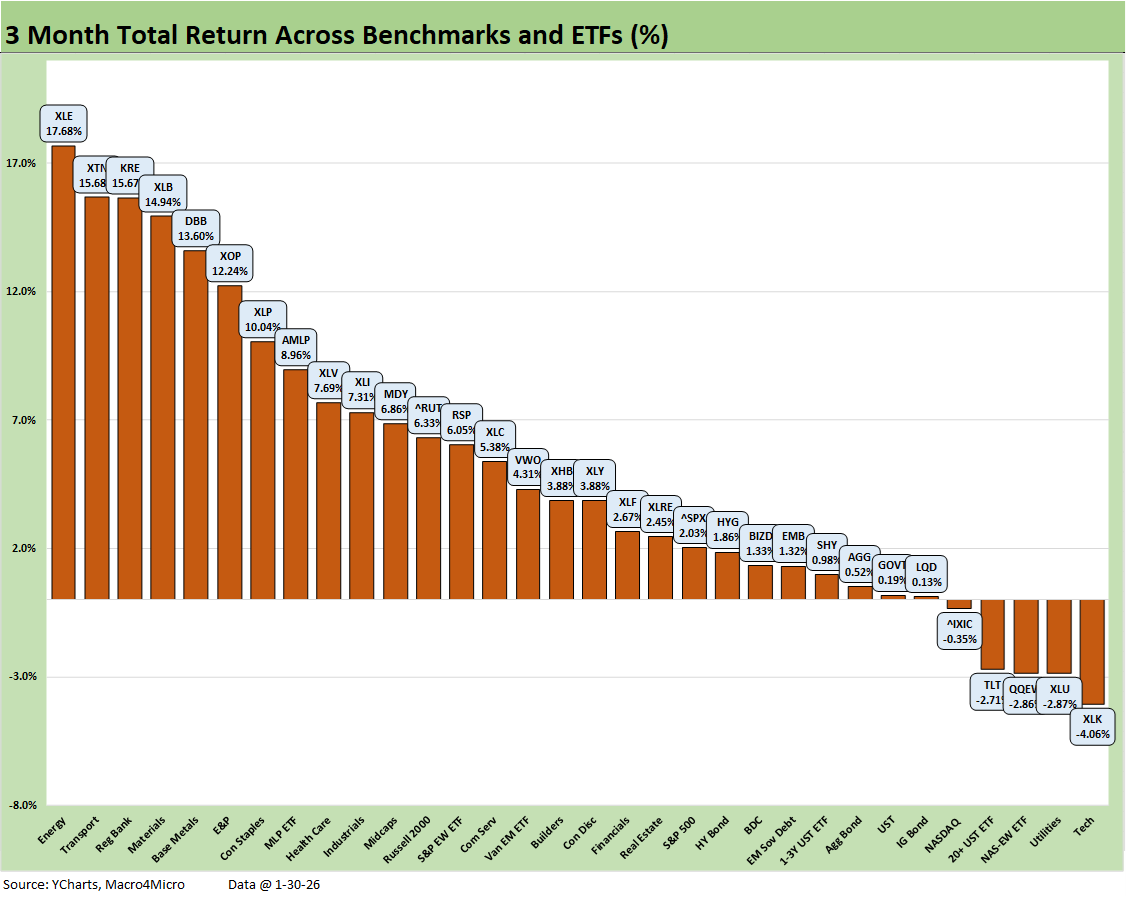
We looked at the 3-month trends in a recent LinkedIn post with a 27-5 positive-negative score pushing right through the headline noise in geopolitics, erratic Trump trade threats, and Fed speculation.
Once again, the Tech ETF (XLK) and Equal Weight NASDAQ 100 (QQEW) were weak and NASDAQ was also mired in the red zone. Bonds posted 4 ETFs in the bottom quartile (TLT, LQD, GOVT, and AGG) with TLT the worst of the group.
The top performers again included the 3 energy ETFs with XLE on top at #1 followed by XOP at #6 and AMLP at #8. Transports (XTN) were strong while Base Metals (DBB) have been all over the headlines and joined by the cyclical Materials ETF (XLB).
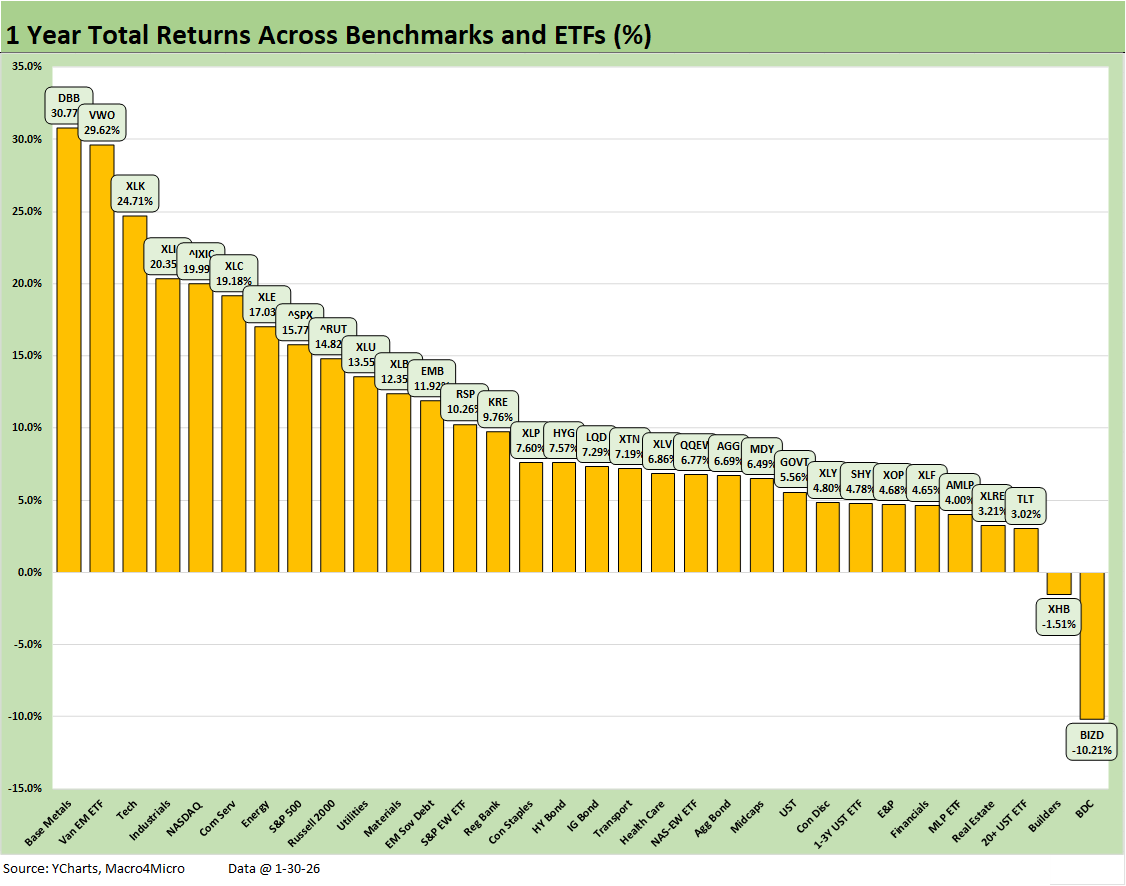
The LTM period highlights a great year for equities and a constructive bull steepener for bonds as the score of 30-2 underscores. Base Metals (DBB) takes the #1 spot with EM Equities (VWO) riding the currency advantage to #2.
The Tech ETF (XLK) stacks up well for the LTM period at #3 despite recent weakness with Communications Services (XLC) and NASDAQ joined by tech heavy S&P 500 in the top tier. Equal Weight NASDAQ 100 (QQEW) lagged and was down in the 3rd quartile. Industrials (XLI) made the top quartile and showed some breadth along with the Russell 2000 just missing the top tier.
The BDC ETF (BIZD) was by far the worst performer with all the private credit headlines and some asset concentration problems for a few bellwether names. Some of the notably weak performers include Blue Owl Capital (OBDC), FS KKR Capital (FSK), and Blackstone Secured Lending Fund (BXSL). The divergence across the private credit entities and BDCs is going to raise a lot of questions on due diligence quality and diversification.
Looking at the other LTM underperformers, we see Homebuilders (XHB) in the bottom quartile along with the long duration UST ETF (TLT) and the Real Estate ETF (XLRE). We also see Financials (XLF) in the bottom tier and well behind Regional Banks (KRE). The recent rallies in energy equities do not look as good over the LTM period as oil really struggled for much of the year on supply imbalance worries and some cyclical concerns ahead of the recent run. We see XOP in the bottom quartile.
Overall, there has been a lot of movement in rankings across the LTM timeline and various rolling horizons as “events” unfolded and economic trends stabilized. The wildcard near term is payroll trends and inflation and how the pending “new guy” (Warsh) as Fed chair addresses the moving parts. Of course, we could also have military action in the Middle East, the US could seize the Panama Canal, and tariffs could spiral into trade wars with the EU and Canada (subject to the USMCA review). Mexico is more likely to surrender unless Trump engages in military strikes on cartels. Event risk never goes away these days.
See also:
US-Taiwan Trade: Risks Behind the Curtain 2-1-26
Trade Deficits: Math Challenge 1-30-26
China Trade: Shrinkage Report 1-28-26
Mexico Trade: Gearing up for More Trade Trouble? 1-27-26
Canada-US Trade: Trump Attack N+1 1-25-26
PCE Income & Outlays Nov 2025: Resilient Consumer, Higher Inflation 1-24-26
3Q25 GDP: Updated Estimate 1-22-26
Industrial Production Dec 2025: CapUte Resilience 1-17-26
Existing Home Sales Dec 2025: Getting up off the Mat? 1-16-26
Policy Mud on the Wall: Consumer Debt, Residential Mortgages 1-15-26
CPI Dec 2025: Sideways Calms Nerves – For Now 1-13-26
Payrolls Dec 2025 and FY 2025: Into the Weeds 1-10-26
JOLTS Nov 2025: Job Openings and Hires Down, Layoffs Lower 1-7-26
2025 Spread Walks and Multicycle Return Histories 1-5-26
Annual Return Differentials: HY vs. IG Across the Cycles 1-3-26
Cyclical Histories: Will Facts Be in Vogue in 2026? 1-2-26
Total Return Quilt Across Asset Classes 2008-2025 1-2-26
Cyclical Histories: Will Facts Be in Vogue in 2026? 1-2-26
3Q25 GDP: Morning After Variables to Ponder 12-27-25
Durable Goods Oct25: Core Capex Still in Gear 12-23-25