
CPI Dec 2025: Sideways Calms Nerves – For Now
Little change in Dec CPI does not remove the big questions ahead on health care insurance and goods pricing strategies in 2026.

Are we there yet?
The CPI release did not bring much of a catalyst for more or less worry in either direction since much of the action still lies ahead. Services at 64% of the index and 3.3% YoY remains a sticky line item that will remain a headwind to material progress toward the 2% target area.
CPI ex-Shelter at 2.4% is reassuring since it ticked lower sequentially from 2.6%. The less comforting fact of life is that corporate America still faces a lot of planning around the pricing of tariffed goods with the need to handicap price increases or cost cutting. Tariff mitigation offsets in turn can bring payroll risk and capex reassessment.
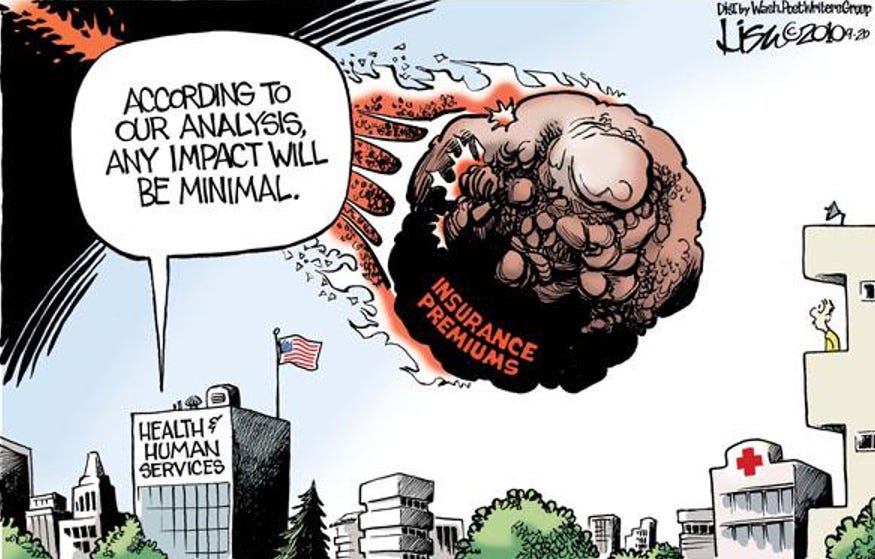
The minimal health care insurance CPI of -0.5% YoY raises eyebrows. Health care inflation is the wildest of the wildcards as health insurance premium spikes will not get into the numbers until further into 1Q26.
Oil is another factor that can always move the needle on CPI (despite the fact that Trump never mentions Putin’s invasion in his diatribes on Biden inflation), and we are entering another one of those periods of oil price uncertainty with Venezuela chaos and a brewing mess with Iran.
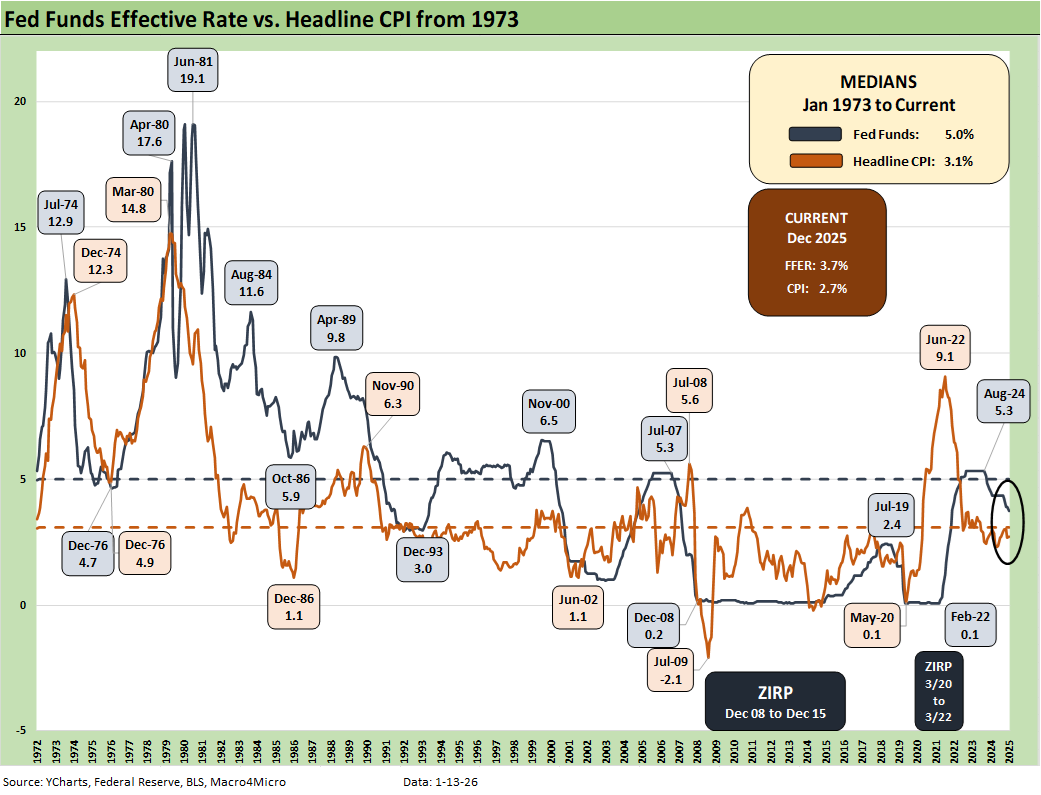
The above chart updates the historical relationship between fed funds and CPI. It’s worth keeping in mind that Trump would like this relationship to be flipped with fed funds below 1% as he has stated in some past comments. That would bring material negative real fed funds. That is not a relationship that the UST slope would smile upon. Steepening would likely be on the long end (controlled by the market) as well as the short end (controlled by the Fed).
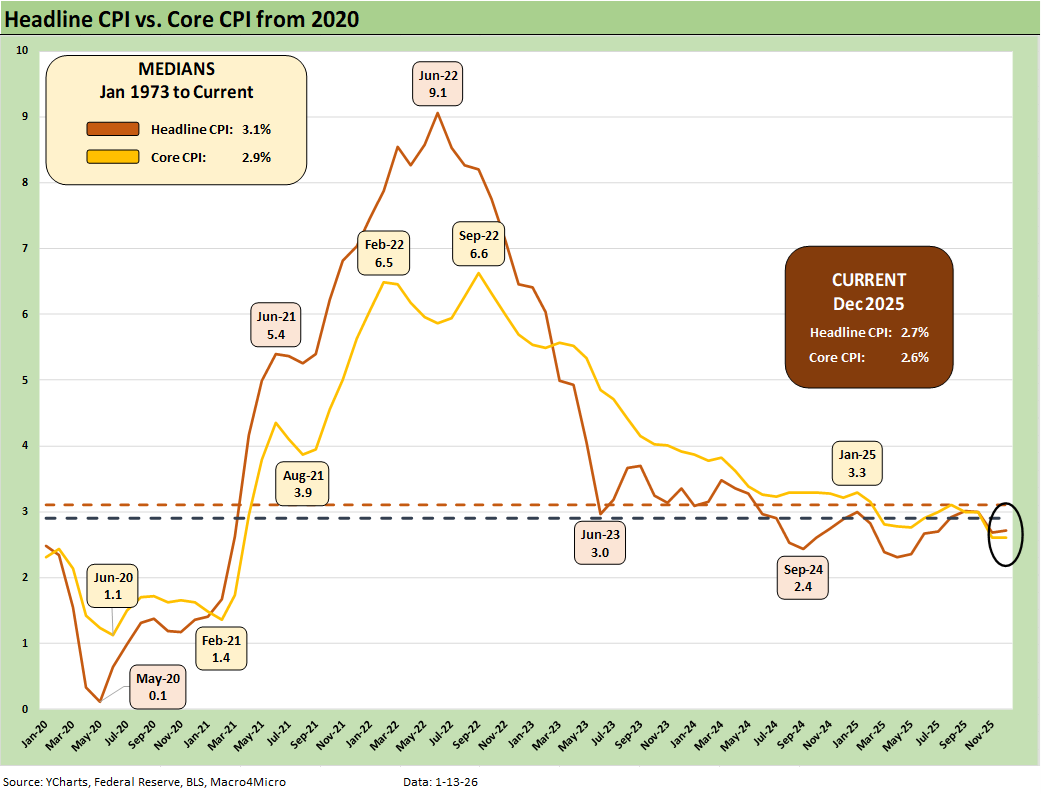
The above chart updates the path of Headline CPI vs. Core CPI from the period just before COVID. The long-term medians are from Jan 1973 before the wild ride that began with the oil embargo that started in the Fall of 1973. As Trump speaks of the record inflation under Biden that he “inherited,” he neglects to highlight that in Biden’s last full month in office (Dec 2024), inflation stood at 2.9%. Trump’s starting point is Jan 2025 - not June 2022.
We would argue that Powell and the FOMC did a masterful job handling the inflation spike even if they were late to the party. It is worth highlighting only two Presidents since 1980 finished their term(s) with no recession months. Those two Presidents are Clinton and Biden.
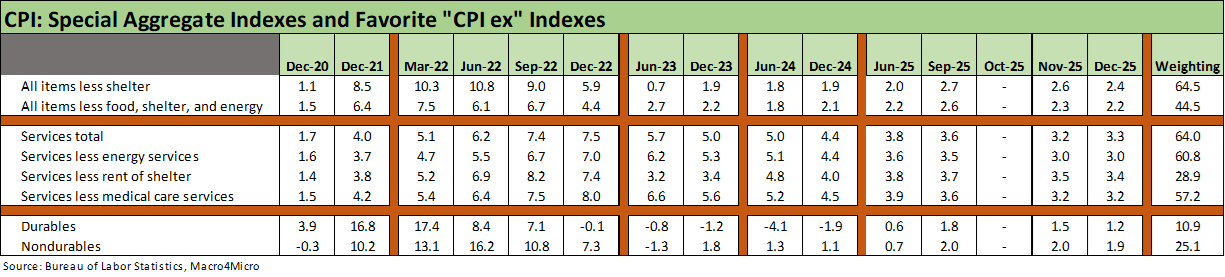
The above chart updates our favorite “CPI ex” collection from Table 3 of the CPI release. With Shelter CPI of less analytical value than what the BLS might have planned on when it changed shelter CPI methodology in the early 1980s, we tend to see CPI ex-Shelter as the best headline number to consider. Shelter also comprises 35.5% of the CPI index, so a low quality, theoretical, derived number does not help clarity in calling the inflation pressure. That is why we prefer getting into the product and services lines.
Core CPI had been the favorite of the Fed, but Food (13.7% index weighting) and Energy (6.3% CPI index weighting) are among the two most important drivers of how households feel.
As we cover below, total food ticked higher in YoY metrics with total Food, Food at home, and Food away from home all higher. That does not make consumers happy. For Energy, oil prices have helped gasoline but as we cover in other charts below, Energy Services (7.7 % CPI YoY) such as Electricity (6.7% YoY) and Utility (piped) gas (10.8% YoY) were ugly outliers.
The special CPI aggregate for All items less food, shelter and energy, barely moved lower from 2.3% YoY to 2.2% so that is at least mild by the standards of inflation. That line also underscores the stable month.
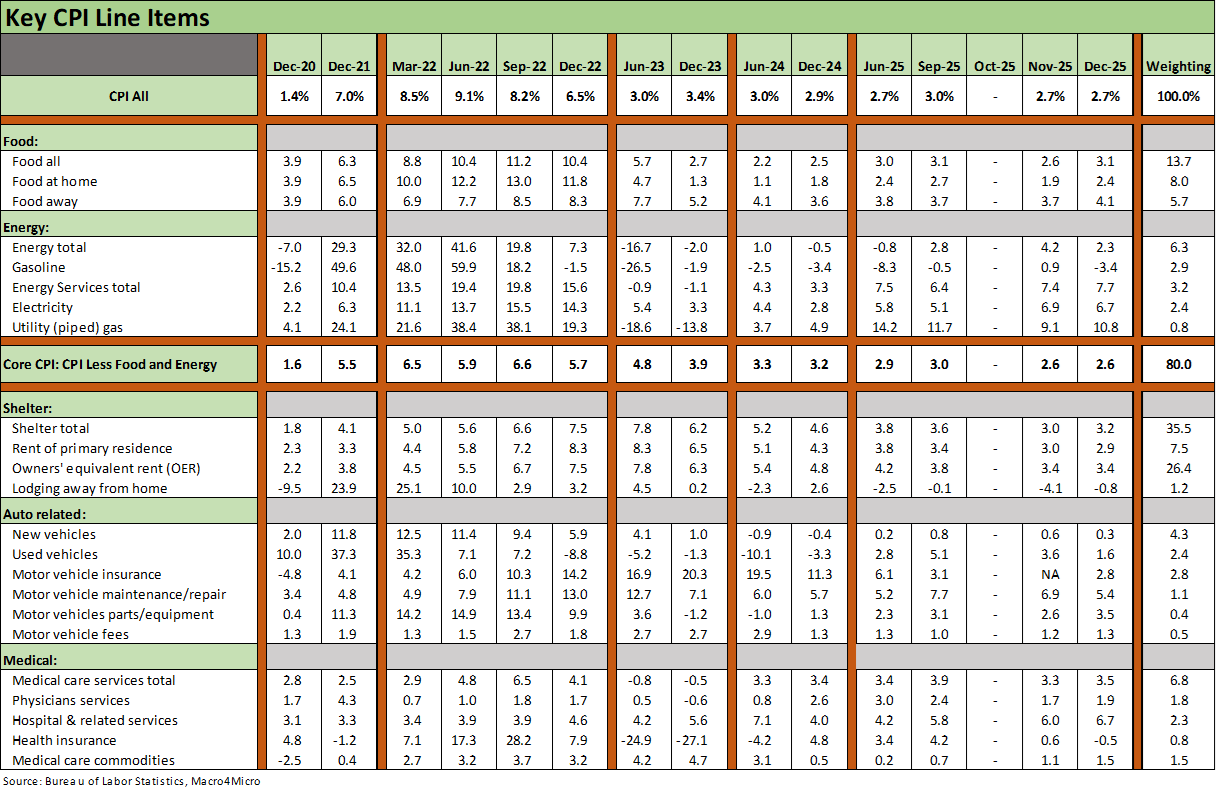
The above chart is the main event of the CPI release with the Big 5 buckets posting an index weighting at around ¾ of total CPI. The most interesting lines to watch over the next few months will be Health Insurance and Energy. The new health insurance premiums cycle will move the needle if the BLS is remotely accurate in their measurement.
Energy could go back into one of those modes where military actions create questions around a big move. Whenever Iran comes up, the headlines around OPEC supply logjams (Strait of Hormuz) always get airtime before it fades (unless it doesn’t). That could get tested again if the fanatical leadership of Iran gets painted into a corner. The threat to them now is higher than bombing with “regime change” chatter in the air. We have seen this movie before (in 2003).
We rolled up our own Automotive CPI mix above to remind people what a dominant role the cost of a vehicle plays in the life of so many US households in what is a “driving country.” The 11.5% mix of CPI in the chart excludes gasoline, which would move automotive index CPI share ahead of food (see Automotive Inflation: More than Meets the Eye 10-17-22). Shelter remains by far the leader in CPI index share.
The new vehicle CPI is down closer to zero at 0.3% as the OEMs have been very disciplined and eaten the costs to protect strong sales volumes and healthy retail networks. Those decisions will be revisited this year as the OEMs work with suppliers and watch consumer demand. The good news for tariff policy is that the OEMs are spending billions in capex to move more production capacity back to the US
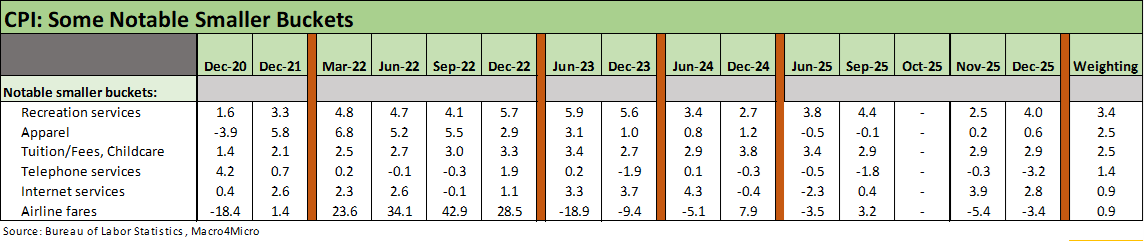
.The above chart details some popular line items in the life of US households. Recreation Services rose notably to 4.0% this month. That can be a “glass half full” inflation issue since it also says consumers are spending on such discretionary items.
A big question into 2026 is how Apparel will play out given the tariffs on ‘labor arb” trading partners in Asia. At 0.6%, Apparel CPI has not made a dent yet even after the holiday season. That will be a line to watch. Food, electric bills, heating the home, and filling up the gas tank can wag voter sentiment in an election year. That also applies to apparel. We do not see likelihood of material reshoring of Apparel to the US.
See also:
Payrolls Dec 2025 and FY 2025: Into the Weeds 1-10-26
JOLTS Nov 2025: Job Openings and Hires Down, Layoffs Lower 1-7-26
2025 Spread Walks and Multicycle Return Histories 1-5-26
Annual Return Differentials: HY vs. IG Across the Cycles 1-3-26
Total Return Quilt Across Asset Classes 2008-2025 1-2-26
Cyclical Histories: Will Facts Be in Vogue in 2026? 1-2-26
3Q25 GDP: Morning After Variables to Ponder 12-27-25
Durable Goods Oct25: Core Capex Still in Gear 12-23-25
Market Lookback: Last Call for Unusual Behavior 12-22-25
Existing Home Sales Nov 2025 12-21-25
November CPI: Tricky Navigation 12-18-25
Some CPI Histories:
Inflation: The Grocery Price Thing vs. Energy 12-16-24
Inflation Timelines: Cyclical Histories, Key CPI Buckets11-20-23
Fed Funds – Inflation Differentials: Strange History 7-1-23
Fed Funds, CPI, and the Stairway to Where? 10-20-22