
PCE Income & Outlays Nov 2025: Resilient Consumer, Higher Inflation
The PCE inflation report showed consumers outspending income growth but with an adverse move in inflation.


While the “soft” indicators such as sentiment/confidence have their value, the rubber meets the road in how households spend relative to their income levels. Sometimes the higher spending is by choice (recreation) and sometimes by necessity (health care). The income and outlays data for Nov still shows sequential MoM growth in personal consumption expenditures (PCE) running ahead of income growth.
Growth of +0.5% for total PCE, 0.7% for goods, and services at +0.4% outpaced disposable Income growth at +0.3%. The personal savings rate ticked lower to 3.5, down from 5.5% as recently as May.
PCE inflation ticked higher YoY to +2.8% in Nov from +2.7% in Oct for both headline PCE prices and Core PCE. That is going in the wrong direction, and fresh tariffs would not have helped with the USMCA also up for review by midyear and Trump threatening both nations already. Canada was threatened with 100% tariffs on Saturday. The headline PCE price index of +2.8% is up from 2.3% in April with Services stubborn at +3.4% and Energy Goods and Services moving notably higher to +4.1% in Nov from 2.2% in Oct and even deflation as recently as August.
We will find out in later releases how consumers felt about Trump losing his mind and threatening to invade a NATO ally. Trump stepped back from the brink for reasons that are more mired in disinformation than the reality of what he factually got in return. Someone (not just the equity markets) must have conveyed to Trump that his action gave the largest trading partner (EU) the domestic political cover to go toe-to-toe in a trade war where everyone loses.
A fresh trade war where the EU and perhaps later Canada and Mexico fight back could unsettle Trump’s FOMC ambitions if the Senate held up appointees while the market also could cast its vote on the long end of the yield curve. Disaster averted for now.
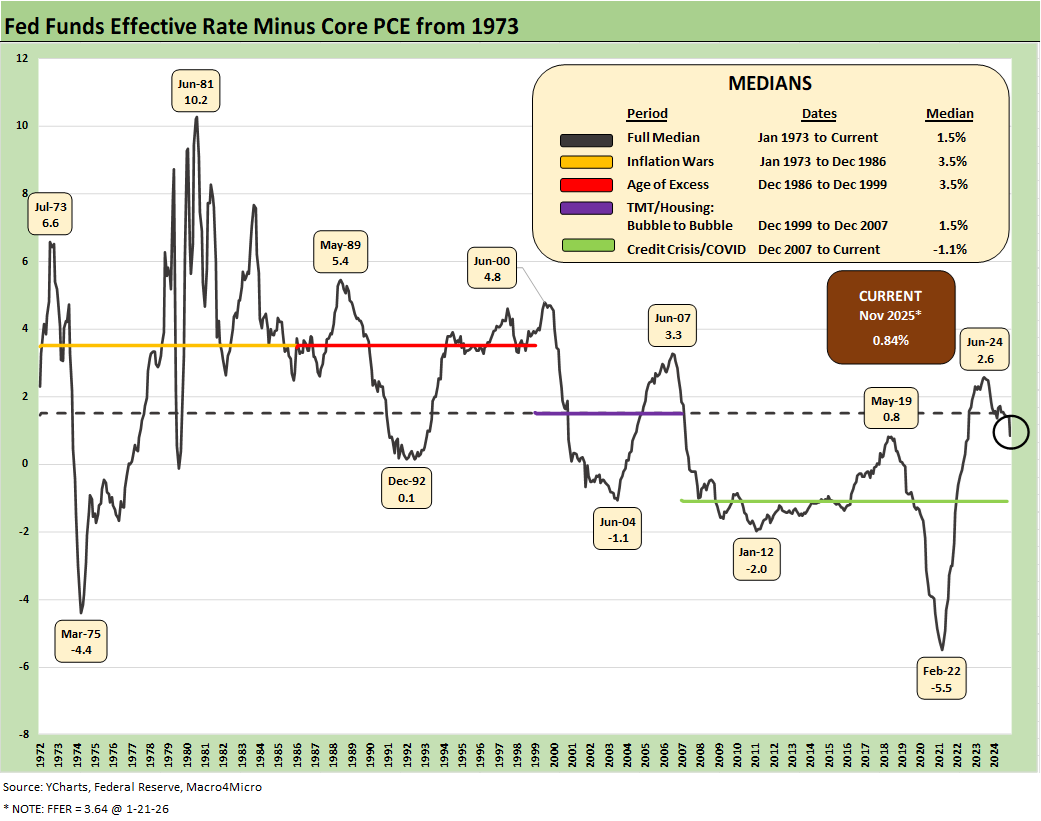
The above chart updates the time series for “fed funds minus core PCE.” The PCE inflation metric tends to be a focal point for the FOMC and economists, but the pressure on energy costs (notably electricity and utility piped gas) and food inflation are stimulating household attention spans in a midterm election year.
The long-term median on the FF vs. PCE differential is 1.5%, but recent easing has sent that metric down by almost a half point to 0.84. The Trump saber-rattling focuses on an immediate move to negative real fed funds rates by the Fed, but that is easier said than done with inflation well above target and the economy doing better.
The FOMC rhetoric will not get easier with Fed independence under siege and SCOTUS rulings pending. The macro story has been waiting for top line fixed investment numbers to kick into gear to back up all the talk on capex commitments. Gross Private Domestic Investment is not adding much at all to this point (see 3Q25 GDP: Updated Estimate 1-22-26).
Finding cyclical trigger points for recession or contraction…
As we have often highlighted in the past, historical cycles from the early 1990s through the 2-month COVID contraction show that it takes quite a bit of pain to cause an economic recession. Two of the longest expansions in history were brought down by crises.
The decisions on timing out of NBER on recession timelines tend to lag the economic “events” by substantial periods (see Business Cycles: The Recession Dating Game 10-10-22). It is hard to find a trigger point for a recession at this point. We just avoided one as Trump missed a self-inflicted crisis by threatening to invade a NATO ally and starting a trade war.
For the past trigger points, we saw an unfolding housing sector bubble in 2006 that led to a housing implosion and systemic banking crisis at the end of 2007. That brought the longest recession since the Great Depression. Before that, the TMT bubble implosion brought an end to what was at that time the longest expansion. That tech bubble recession (March 2001-Nov 2001) was mild and brief but brought the hyper-easing by Greenspan discussed in other commentaries (see Greenspan’s Last Hurrah: His Wild Finish Before the Crisis 10-20-22).
There are plenty of cyclical stories to tell whether it be around economic cycles, monetary cycles or “credit cycles” with the occasional tendency of originators and fee generators to go off the rails (see UST Moves: 1988-1989 Credit Cycle Swoon 10-20-23, UST Moves: The 1990-1991 Risk Factor Pig Pile 10-24-23).
The bull markets of the 1980s gave way to contraction by the summer of 1990 as the cumulative effects of an oil patch crisis, an S&L crisis, leveraged buyout excess with dubious lending standards in LBOs and real estate, and securities industry stress (Drexel Chapter11, First Boston bailout by Credit Suisse, Lehman bailout by Amex, GE bailout of Kidder). That all took a toll and was inflamed by Iraq invading Kuwait and causing a fresh consumer scare and a brief oil shock.
The most recent rise in recession odds was fall 2022, but the consumer kept spending and payrolls were impressive (see Unemployment, Recessions, and the Potter Stewart Rule10-7-22). Biden’s single term joined Clinton’s two terms as the only Presidential administrations with no recession months going back 60 years.
The above is a long way of saying that the largest, most diversified, and most service-intensive economy in history is hard to derail as hard as Washington and whatever idiots (from either party) might try. Going to war with NATO countries would have done it. All Trump had to say in the midst of all of that incoherent Davos blather was “we will not use force to take Greenland.” That took a big cyclical trigger for multiple trade wars off the table.
Extrapolation to speculative outcomes is very subjective, but starting a war with a NATO nation would make the top 3 moronic moves of all time in the 250-year history of the US. The EU will get a gut-check on cowardice as they seek to avoid stooping to the level of the Senate GOP.
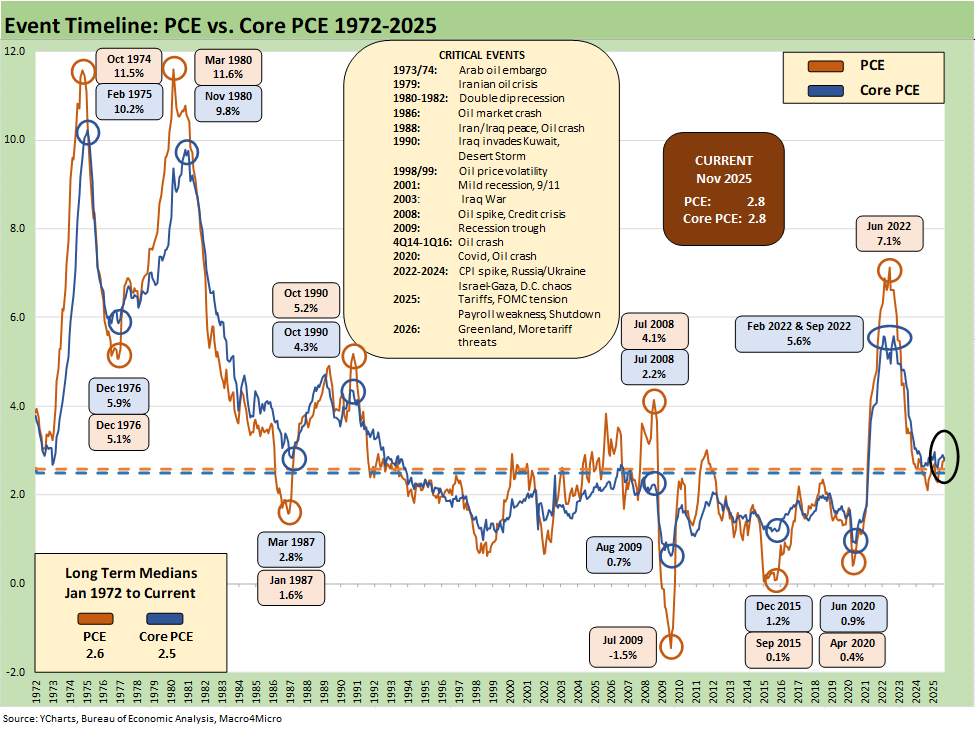
The above chart updates the long-term time series from 1972 for PCE vs. core PCE across the decades and cycles. We see the 2.6% headline PCE long-term median in the lower left (below the current 2.8%) and the 2.5% core PCE median (vs. current 2.8%). That is dramatically better than where we came from in 2022 but still well above the 2.0% target.
The Nov 2025 PCE numbers are at reasonable levels in long-term context, but they are in somewhat of a stall with numerous key lines going in the wrong direction. The 2.8% is well above the 2.3% posted in April, and the flowthrough effect of tariffs are hard to deny. Even if one seeks to embrace the “one-time event” theme, that higher price levels still can bring reduced purchasing power for select line items – subject to a household’s typical “basket” (coffee drinkers and beef eaters take note). The supplemental market-based PCE metric was +2.5% in Nov vs. 2.0% in April.
In the move from early spring to Nov 2025, we see Goods moving from -0.3% deflation to +1.4% inflation. We see Energy Goods and Services move from -4.2% deflation in April to +4.1% inflation in Nov 2025. Services remain sticky at +3.4% in Nov, down slightly from +3.5% in April. When you hear the refrain of “prices are way down” in the White House rambling routines, it is simply not true.
We have a few timeline charts that we like to include with our PCE updates as a reminder of how income and consumption framed up coming out of the COVID crisis with its many glaring structural imbalances in supply and demand (remember empty used car lots?).
While old school inflation economists will religiously chant “all inflation is monetary” just substitute “purchasing power” for inflation and you can leave the lecture hall and get back to the sea level reality of how much smaller your goods and service basket might be after prices climb. The semantics of inflation vs. affordability tends to get garbled in all the rhetoric – especially when financing costs get ignored.
The DPI waves in the stimulus and relief policies…
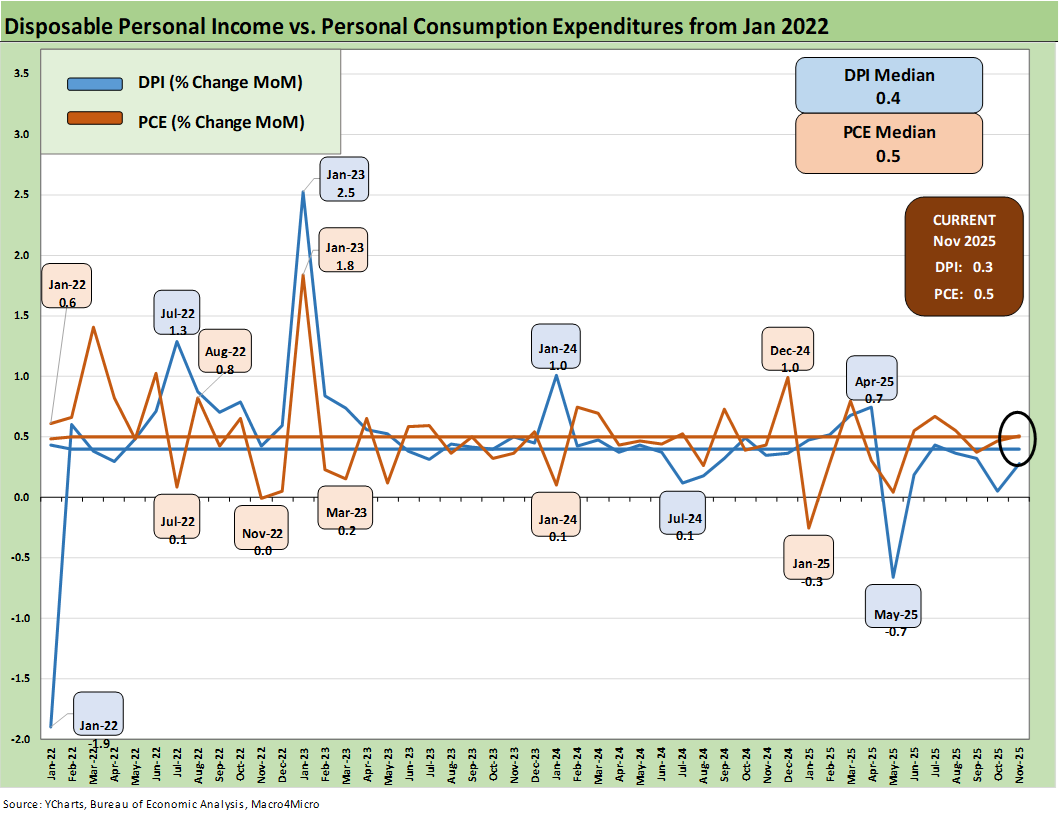
The above chart covers the time horizon for DPI vs. PCE from early 2022 as the tightening cycle kicked into gear after March 2022. Life in Jan 2022 was still relatively quiet for Disposable Personal Income relative to the hyperactive COVID stimulus actions and clean energy legislation.
We like to include this chart and the following longer timeline just given the heavy mix of disinformation and politically axed story lines we constantly hear from Trump on Biden being the cause of all the macro problems during 2025 (Putin oil and gas shock anyone?).
Accurate factual and conceptual frameworks of “the now” matter more than qualitative political spin looking backwards. That said, having a sense of what the numbers were then helps clear up the misinformation nonsense. After all, this is a very different world of tariffs and top-down government policy with very different tax structures and priorities. Tariffs are called permanent at the beginning and then they go through constant changes. That makes for a challenge in planning.
Excess stimulus was definitely a major factor in driving supply-demand imbalances coming out of COVID. That said, you would be hard pressed to find a sentence coming out of Trump’s mouth – or any of his rather vocal team – that speaks to the Russian invasion of Ukraine in Feb 2022 that roiled the energy markets with the spike in oil and gas prices. While that can be seen as the same old ugly politics, the eerily close relationship of Trump with Putin has only become more worrisome across time with Trump’s “friends and family” collection (e.g. Witkoff) thinking about the dollars to be made in Russia in the future.
The stimulus overload of 2021…
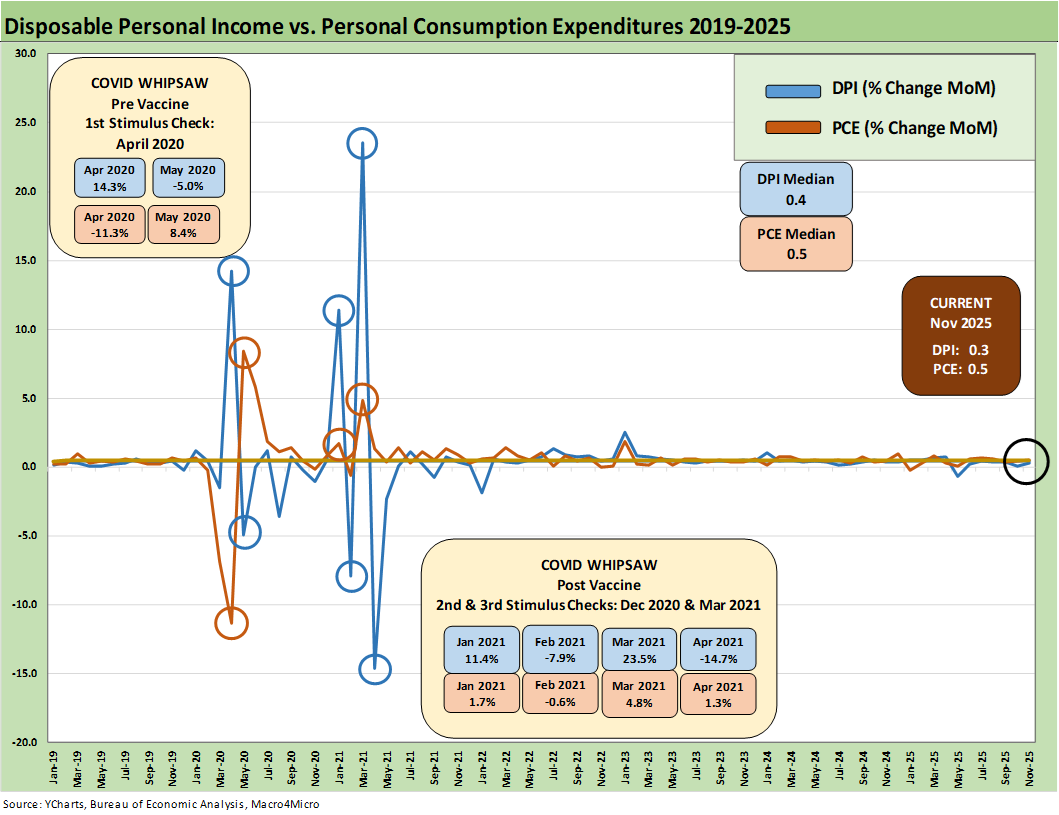
The above chart plots MoM Disposable Personal Income vs. PCE and offers a read on how wild things got during and right after the pandemic peak. This is a chart we use each month to revisit the DPI swings that came with the three COVID relief/stimulus packages. That included two under Trump and one under Biden.
Looking back from 2019, the COVID crash brought ZIRP and a fresh game clock after the vaccine. The 2021 period was a big macro rebound in GDP with pent-up demand off the charts. The strong macro backdrop in 2021 and heavy dose of fiscal accommodation did not mesh well with residual supply-side shortages in goods broadly as 2022 saw the end of ZIRP and a material inflation spike.
Oil was a problem after the Putin invasion of Ukraine in late Feb 2022, and inflation hit a high in June 2022 at +9.1% for CPI as a headline grabber (headline PCE at +7.1% in June 2022) before the steady inflation decline to current rates. Core PCE had dueling peaks at +5.6% for Feb 2022 and Sept 2022. Oil shocks brought back less-than-fond memories of 1974 (late 2023 Arab Oil embargo) and 1979 (Iranian oil crisis) that fed stagflation pain.
The COVID relief binge…
As a reminder, Trump signed the CARES Act in March 2020 (shows up in the DPI in April 2020) and Trump also signed the Dec 2020 legislation disbursed in Jan 2021 (Trump seldom mentioned that Dec 2020 check since it was easier to blame Biden and Powell). Biden signed the America Rescue Plan (disbursed in March 2021) that was a demand pile-on (we would argue over the-top-stimulus) in a supply-constrained environment (thus inflation). The DPI and PCE wave tied to each of those shows up in the chart above.
As a reminder, the vaccine was announced in early Nov 2020 just ahead of two stimulus actions. That was soon to be a factor in PCE patterns and lag effects. The quarterly GDP numbers in 2021 on the post-COVID bounce were numbers generally not seen since the Reagan and Clinton years (see Presidential GDP Dance Off: Clinton vs. Trump 7-27-24, Presidential GDP Dance Off: Reagan vs. Trump 7-27-24).
COVID was a distinct period for supply chains and supply-demand imbalances. With tariffs and potential trade war risk that just flared up again in recent days (EU vs. US), it will remain important to look for similar imbalances whether in narrow product categories or in broad commodities and materials areas.
So far, the major trade partners have not initiated much in retaliation with the exception of a brief China spat. That has mitigated the damage, but that de facto submission could come back to haunt some major trade partners if others run for office with a “get tough” election pitch.
We face a review of the USMCA dead ahead, and Trump’s relations with Canada and Mexico are worse than ever. He has threatened to take military action against Mexico around the cartels while Canada, which has been an annexation talking point using “economic coercion” has many of the attributes that Trump praised in Greenland around “arctic security.” Canada is also a critical supplier of natural resources as we have addressed in past trade commentaries (see US-Canada Trade: 35% Tariff Warning 7-11-25, Trade Exposure: US-Canada Import/Export Mix 2024 2-7-25).
With Carney standing up to Trump at Davos and looking to China and EU to broaden trade partner diversity, Trump is gunning for Canada. Trump has also been issuing cartel military threats against Mexico, so the sovereign rights topic could also go down a dark path there. Lurking in the “Donroe Doctrine” rhetorical noise are threats against Colombia and Panama.
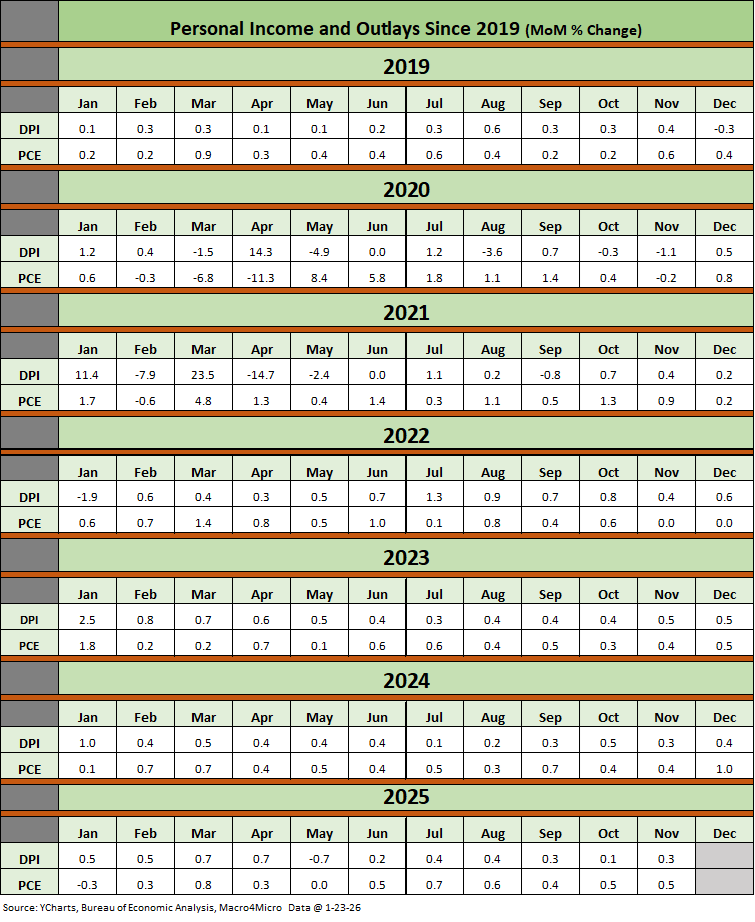
The above table plots the monthly Disposable Personal Income MoM change numbers vs. the Personal Consumption Expenditure MoM numbers across the years from 2019 through Nov 2025. It is an easy scan across key time periods for a look at turning points in DPI (e.g. stimulus payments) or PCE. Table 1 in the monthly PCE release shows total dollar amounts on each line.
The line items can sometimes show some volatility. We like to look for gaps between DPI and PCE and moves in Personal Savings. PCE growth has outpaced DPI since spring 2025. As of Nov 2025 we see PCE growth higher than DPI for 7 straight months. That came after 3 of the first 4 months of 2025 saw DPI ahead of PCE.
Any reader of Table 1 can simply tick off which lines might come under pressure in the coming months. Examples include expense lines such as Medicaid (post tax bill) or durable goods that face tariffs.
It is always worth remembering that a tariff is a regressive tax that hits lower income consumers harder and the same for small businesses. The same is true in Medicaid costs based on the income brackets of Medicaid users. A loss of health care benefits and higher pharma costs is a zero-sum game with other consumption lines. The current ACA premium spikes will also be a zero sum “game” for many budgets in 2026.
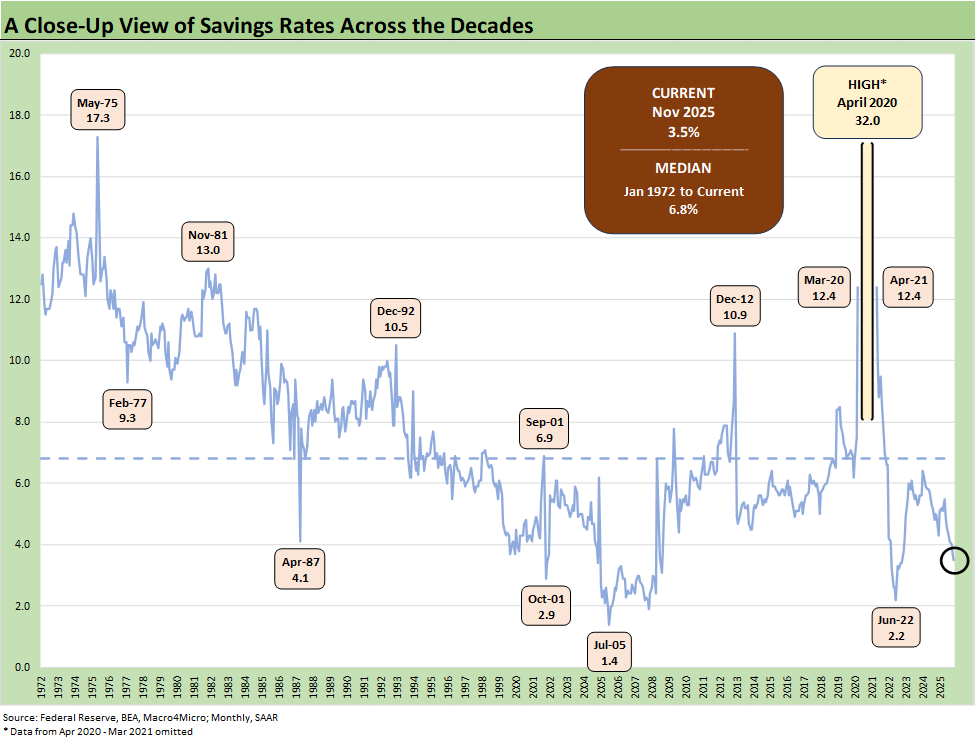
The above chart updates the savings rate time series across time. It is one of those data series that seems to be on the other side of serial revisions. The current 3.5% is dramatically below the long-term median of 6.8% as shown in the chart. The old adage of “never bet against the US consumer” is backed up by what we are seeing so far since COVID – regardless of who is in office.
We have looked at the savings rate dynamics in earlier commentaries (see Savings Rates: Context Across the Cycles 10-27-23). The savings rate peaks in times of worry (occasionally panic) as evident in the chart above. As of now, households are clearly spending even if some might come to regret it when credit card bills come due.
Among notable savings rate increases as households played defense, we see the period leading into May 1975 was no picnic after the massive stagflation bout. The same was true in Nov 1981. Dec 1992 had a raft of issues as the commercial real estate bubble was bursting (and hammering some banks), the leveraged finance boom was on the back end of the default cycle, the thrift crisis effects were still playing out across some major regional economies (notably TX and CA), and the regional oil patch pain that had come home to roost in 1987-1990 was lingering.
See also:
3Q25 GDP: Updated Estimate 1-22-26
Industrial Production Dec 2025: CapUte Resilience 1-17-26
Existing Home Sales Dec 2025: Getting up off the Mat? 1-16-26
Policy Mud on the Wall: Consumer Debt, Residential Mortgages 1-15-26
CPI Dec 2025: Sideways Calms Nerves – For Now 1-13-26
Payrolls Dec 2025 and FY 2025: Into the Weeds 1-10-26
JOLTS Nov 2025: Job Openings and Hires Down, Layoffs Lower 1-7-26
2025 Spread Walks and Multicycle Return Histories 1-5-26
Annual Return Differentials: HY vs. IG Across the Cycles 1-3-26
Cyclical Histories: Will Facts Be in Vogue in 2026? 1-2-26
Total Return Quilt Across Asset Classes 2008-2025 1-2-26
Cyclical Histories: Will Facts Be in Vogue in 2026? 1-2-26
3Q25 GDP: Morning After Variables to Ponder 12-27-25
Durable Goods Oct25: Core Capex Still in Gear 12-23-25