
3Q25 GDP: Updated Estimate
The main story in the updated 3Q25 numbers is the steady improvement in the PCE line.


It is all in how you look at it.
The 3Q25 GDP numbers of +4.4% is the highest since 4.7% in 3Q23 and 7.0% (revised) in 4Q21. PCE does the heavy lifting with both Goods and Services with 3% handles.
3Q25 highlights the rebound of the consumer as evident in PCE growth to +3.5% after a bad 1Q25 and soft 2Q25. Trump’s end zone dance is somewhat constrained by the fact that 3.5% PCE is below 3 of 4 quarters in 2024 including +4.0% in 3Q24. Goods PCE of +3.0% is also below 3 of 4 quarters in 2024.
GPDI remains constrained in Table 1 at +0.8% with a mixed picture across the line items. Structures at -5.0% and Residential at -7.1% are more than offset by Equipment at +5.2% and Intellectual Property Products at +5.6%.
We see another distortion effect from Net exports of Goods and Services which adds a +1.6% contribution to the headline from Table 2. Exports had a good quarter at +9.6% after two bad quarters and added a +1.0% contribution to GDP from Table 2 (see 3Q25 GDP: Morning After Variables to Ponder 12-27-25).
The solid consumer picture and PCE growth should beat down the recession scenarios but also raise questions around the FOMC game plan with PCE inflation ticking higher YoY. PCE inflation moved to 2.8% in Nov from 2.7% in Oct. The Fedwatch odds of no cut in March rose again to 84.1% as we go to print and rose to 71.9% for April.
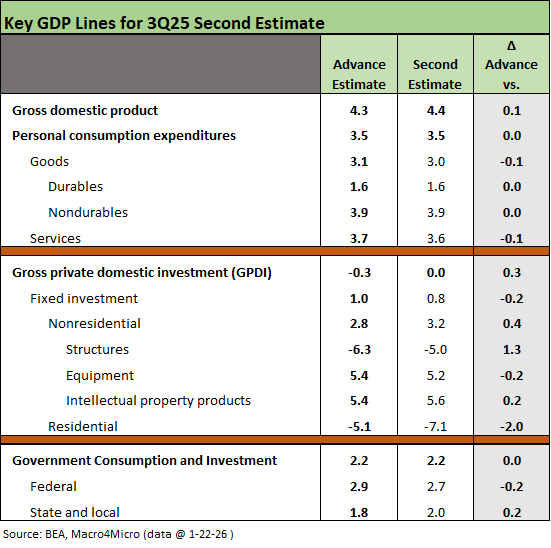
The above table updates the GDP line deltas from the first 3Q25 estimate. The changes in the headline and PCE numbers were minor while the more volatile GPDI lines show the Nonresidential line moving higher as Residential still struggles in the red. Government continues to stall with the Federal total revised lower and State and Local higher
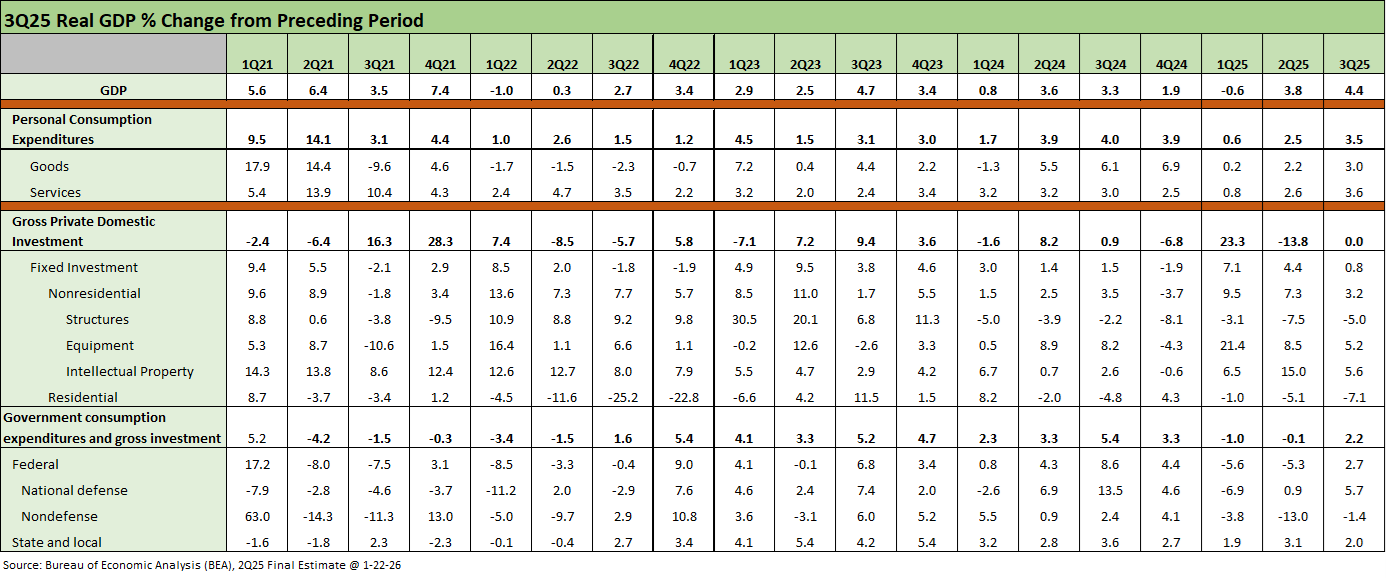
.The above table updates the running quarters from 1Q21 and the last full year of ZIRP. We updated the 1Q23 to 3Q25 details for the latest revisions but left the 1Q21 to 4Q22 data unrevised (in the interest of time). There is little mystery to the 2021 numbers at this point. In 2021, the post-vaccine transition highlights the scale of pent-up activity with outsized numbers in PCE and GPDI. Then 2022 slid into inflation and a tightening cycle.
The PCE line comprises 68% of GDP and you can simply run your fingers across the lines from 1Q21 to 3Q25. For PCE, we see 3 of 4 quarters in 2024 ahead of the 3.5% posted in 3Q25. After PCE, the next economic focal points for cyclical indicators are along the fixed investment lines. Those are mixed across the full 2025 period with Structures and Residential struggling but IP Products and Equipment rolling along in solid fashion.
We believe that the outlier trends in the Net Export contribution to GDP and the “change in private inventory line” have been major factors in the headline distortions during 2025. Those import/export whipsaws around tariff dates and extraordinarily rare working capital swings are worth thinking about from the headline level down unless you are marketing good news and bad news for political purposes (see Cyclical Histories: Will Facts Be in Vogue in 2026? 1-2-26, 3Q25 GDP: Morning After Variables to Ponder 12-27-25, 2Q25 GDP Final Estimate: Big Upward Revision 9-25-25).
No recession signals here…
The ugly year of 2022 was able to escape recession talk on the back of low unemployment and solid PCE numbers (see Unemployment, Recessions, and the Potter Stewart Rule 10-6-22). When the market shows steady PCE at 3% or higher and low unemployment in historical context, the economy can be mediocre but not a red flag trend.
We look at 4% handle unemployment as in a zone that would be considered full employment in past cycles. Meanwhile, a 3% handle PCE or GDP is cause for calm whether under Biden or Trump. More extreme partisans will of course make “stuff” up.
We look at the 4.4% headline GDP as distorted by the +1.6% add-on from trade deficits decline and how the GDP accounting works. Even adjusting for that unusual add-on in historical context, we see a good quarter. The personal consumption detailed today in the Personal Income & Outlays report is not signaling setbacks in 4Q25 so far.
Higher exports in 3Q25 GDP are a positive, but the loss of access to low cost imported supplies for producers or low-cost offshore goods for consumers comes with a very big asterisk (higher prices, lower profit margins downstream etc.).
We live in a world where the President will not even admit the “buyer writes the check” for tariffs and that a trade deficit is a “subsidy” for other nations rather than a free market economic decision to the advantage of the buyer. That might get you a bad grade in intro economics class, but these days it can get you a cabinet position. Welcome to the new world.
See also:
Cyclical Histories: Will Facts Be in Vogue in 2026? 1-2-26
3Q25 GDP: Morning After Variables to Ponder 12-27-25
2Q25 GDP Final Estimate: Big Upward Revision 9-25-25
1Q25 GDP: Final Estimate, Consumer Fade 6-26-25
1Q25 GDP Advance Estimate: Roll Your Own Distortions 4-30-25
Trump’s “Greatest Economy in History”: Not Even Close 3-5-25
Gut Checking Trump GDP Record 3-5-25