
Market Commentary: Asset Returns 2-8-26
A wild week of volatile price swings set up an array of debating points on who else in tech gets damaged by the rise of AI.


The week was an unusual one to say the least as AI brought a new round of damage anxiety that spread to software and semis. It unfolded in a week where payroll jitters (Challenger, ADP) got a fresh round of bad news and in turn turbocharged the discussions of potential negative multiplier effects of AI in 2026 and beyond.
Credit spread widening was mild in equity volatility context with HY at +7 bps on the week and +2 in IG. That still left credit spreads extraordinarily compressed with HY OAS within the June 2007 bubble range. Through the Thursday market swoon, the trailing 1-week HY OAS delta as of Thursday was +20 bps with +11 bps on Thursday before the Friday rally.
The benchmark UST maturities were relatively rangebound for 10Y UST while 30Y mortgages took a back seat to a major equity selloff through Thursday. That tumultuous Thursday came ahead of a solid stock rally on Friday. FedWatch shows the March odds of no action at +80.1% and the odds of no cut in April at 65.2% (down from over 70% the prior week). June now shows 51.1% odds for a -25 bps cut.
This coming week brings payroll numbers and CPI as the quarterly earnings season continues to post strong numbers. Per FactSet, the blended average for those in the S&P 500 who reported (~60%) and estimates for those yet to report frame earnings growth of +13% for 4Q25 YoY. That continues the strong YoY earnings run in 2025.
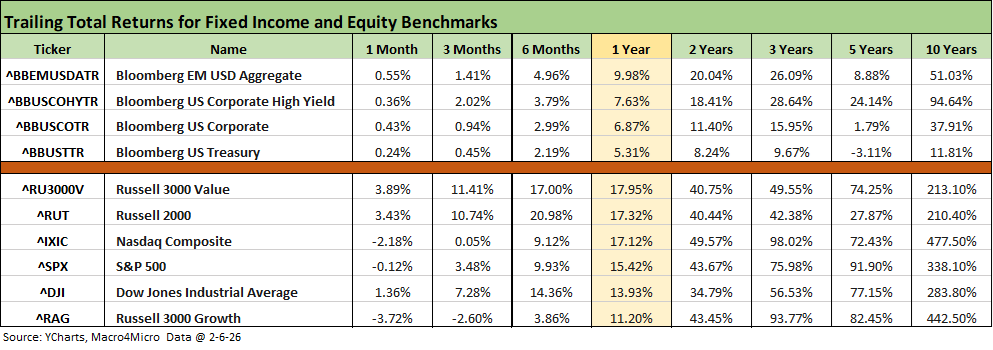
The table above tells a tough 1-month story for tech and growth equities. The small cap Russell 2000 and Value equities benchmarks performed well on sector rotation, earnings trends, and relative stabilization of economic indicators. The CPI story gets a big gut check this week. The same is true for payroll and how that could play into the “Warsh handicapping drill.” The curve could get to be the story again on the flattening vs. steepening debate, but the week and the month was quieter relative to the equity headlines.
The rolling return visual
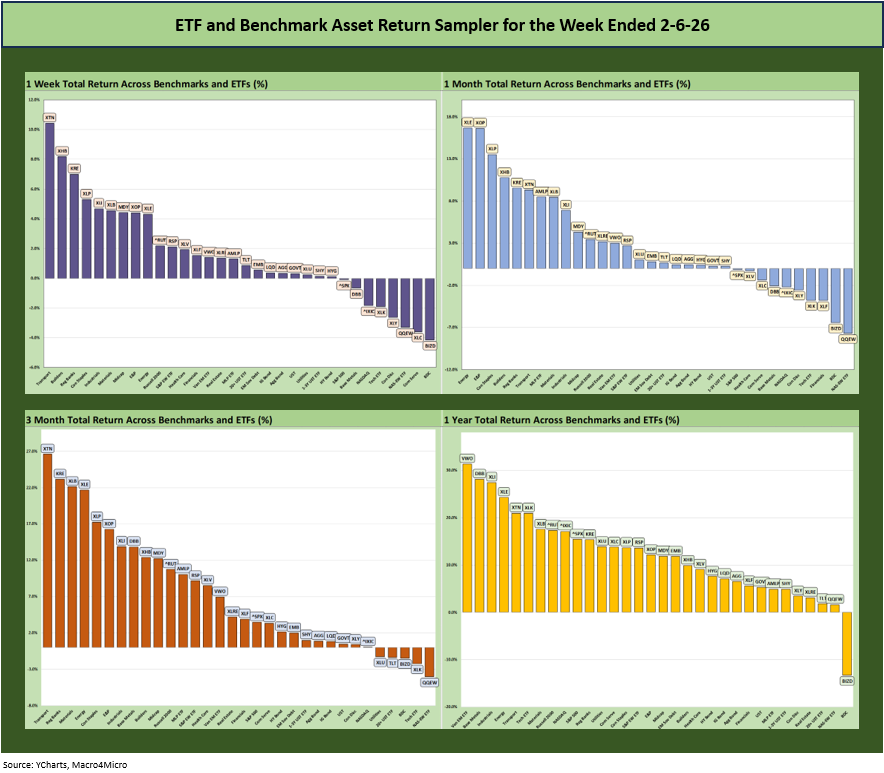
In the next section, we get into the details of the 32 ETFs and benchmarks for a mix of trailing periods. Below we offer a condensed 4-chart view for an easy visual on how the mix of positive vs. negative returns shape up. We see it as a useful exercise in looking for signals across industry groups and asset classes.
The overall symmetry of stock returns has been favorable despite the recent turbulence in tech. Small caps and midcaps have been strong while the large cap benchmarks get heavily wagged by tech and related services. We look at the moving parts in more detail below across the timelines.
The Magnificent 7 heavy ETFs…
Some of the benchmarks and industry ETFs we include have issuer concentration elements that leave them wagged by a few names. When looking across some of the bellwether industry and subsector ETFs in the rankings, it is good to keep in mind which narrow ETFs (vs. broad market benchmarks) get wagged more by the “Magnificent 7” including Consumer Discretionary (XLY) with Amazon and Tesla, Tech (XLK) with Microsoft, Apple, and NVIDIA, and Communications Services (XLC) with Alphabet and Meta.
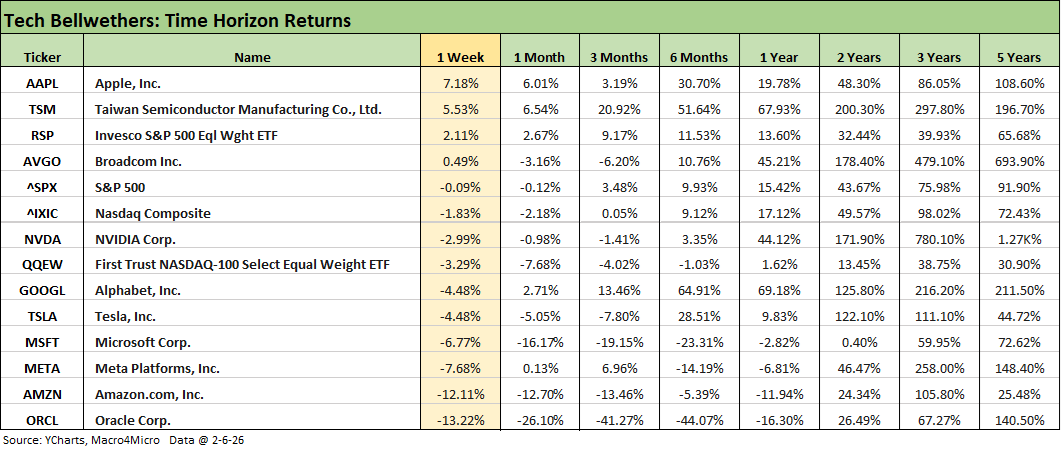
The tech bellwethers and benchmarks saw trends to the downside in recent periods with material divergence across the peer groups including within Mag 7. For the week, only Apple, Taiwan Semi, and Broadcom were positive in single names. We see 6 of the Mag 7 in the red below the S&P 500 and NASDAQ, who were also both in the red for the week.
Looking back 3 months tells a story of headwinds and notably for Oracle, Microsoft and Amazon with Meta mixed among this week’s bottom dwellers
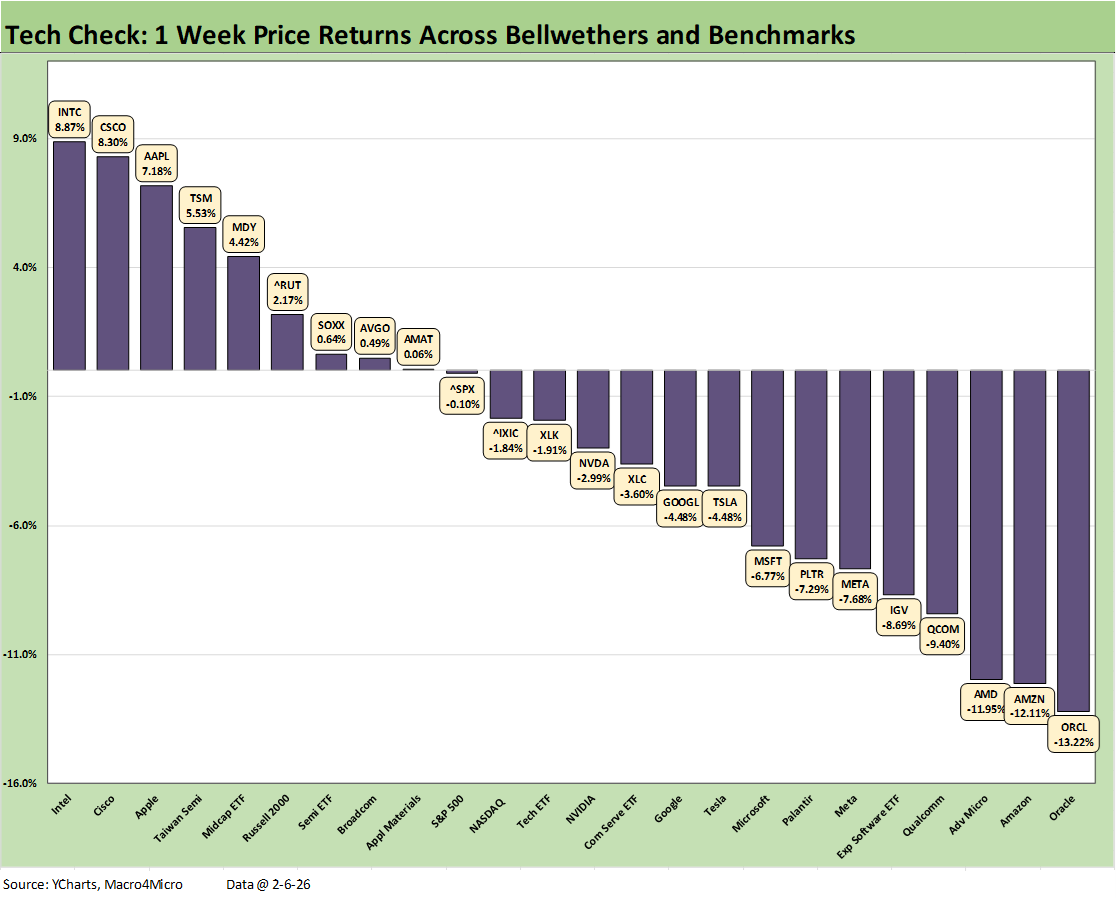
.We covered this chart in our new “Tech Check” collection of issuers we posted on LinkedIn on Friday morning before market open and on Saturday for a weekly recap. The mix of tech names was hit hard with 3 in double-digit negative return range on the week. The software ETF (IGV) and semiconductor ETF (SOXX) got a lot of airtime this week with IGV software names hit hard in the AI spillover.
We see 6 of the Mag 7 in the red with Amazon only beating Oracle this week. Intel and Cisco sitting on the top just ahead of Apple and Taiwan Semis brought back memories of dominance of earlier tech equity cycles.
Midcaps and Small Caps were comfortably in positive range with the S&P 500 and NASDAQ just across the line in the red and ahead of 6 of the Mag 7.
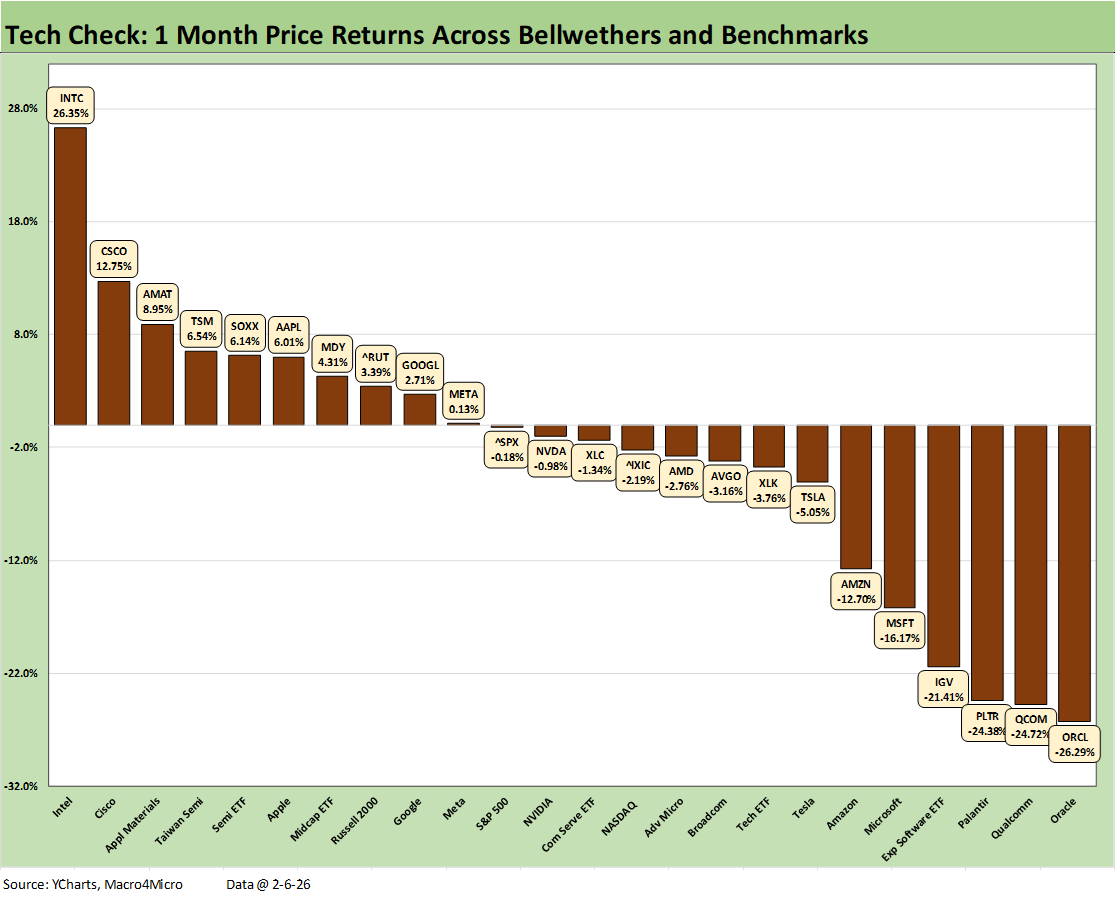
The above chart takes the “Tech Check” list and updates for the trailing 1-month period. We see 4 names down by -20% handles (ORCL, QCOM, PLTR, IGV) with MSFT and AMZN down by double digits also. Across the 24 asset lines, we see 10 positive and 14 negative
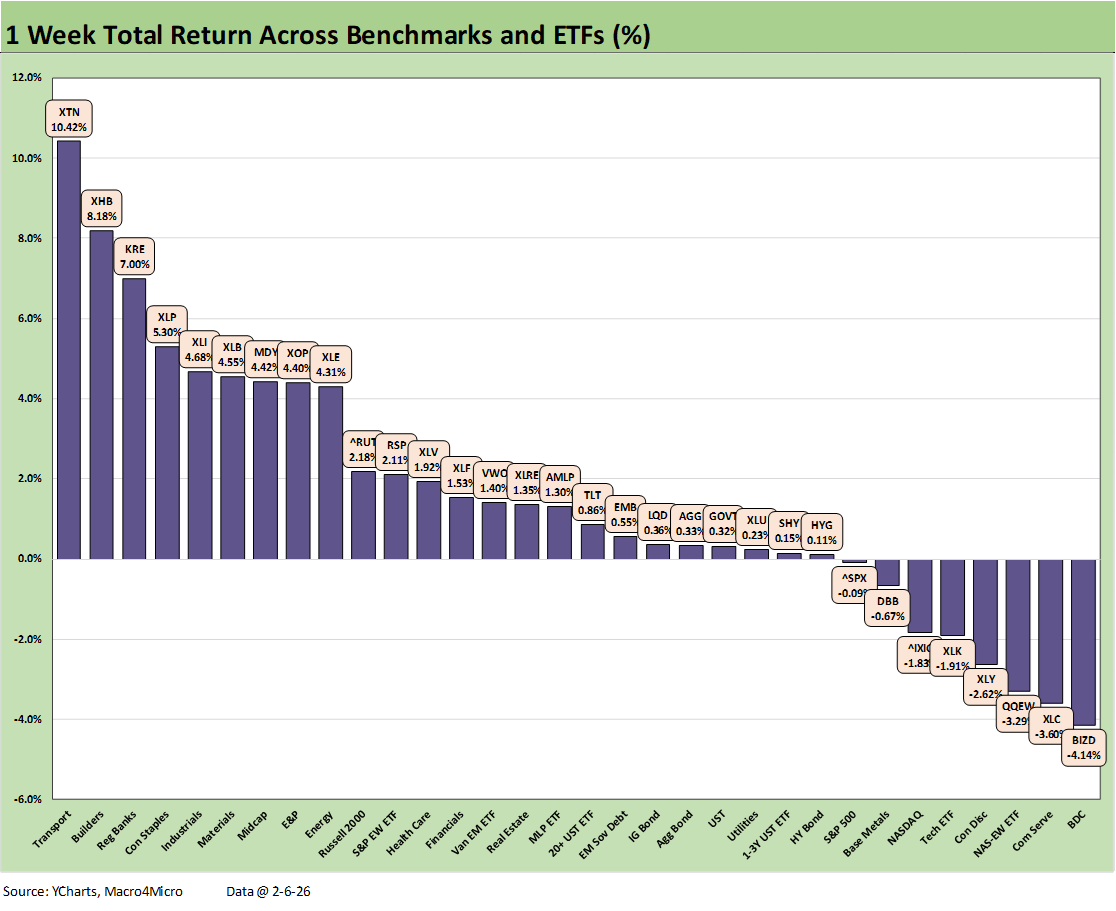
.We looked at the 1-week numbers across our 32 benchmarks and ETFs in a LinkedIn post yesterday. We see the better positive vs. negative symmetry as we roll in the broader mix of industry groups. The positive vs. negative score of 24-8 includes 7 bond ETFs slightly in positive range.
The bottom tier includes at least 7 (ex-DBB, the Base Metals ETF) that were heavily influenced by the tech pressure with the S&P 500 hit by info tech and communications services weightings. Even the BDC ETF (BIZD) was feeling the anxiety around leveraged software and tech services exposure that had been a major dietary item in the private equity sector on the high margins and (theoretically) recurring cash flows. The AI imagination and scenarios are running wild and unsettling some longer-term business models in a service intensive economy
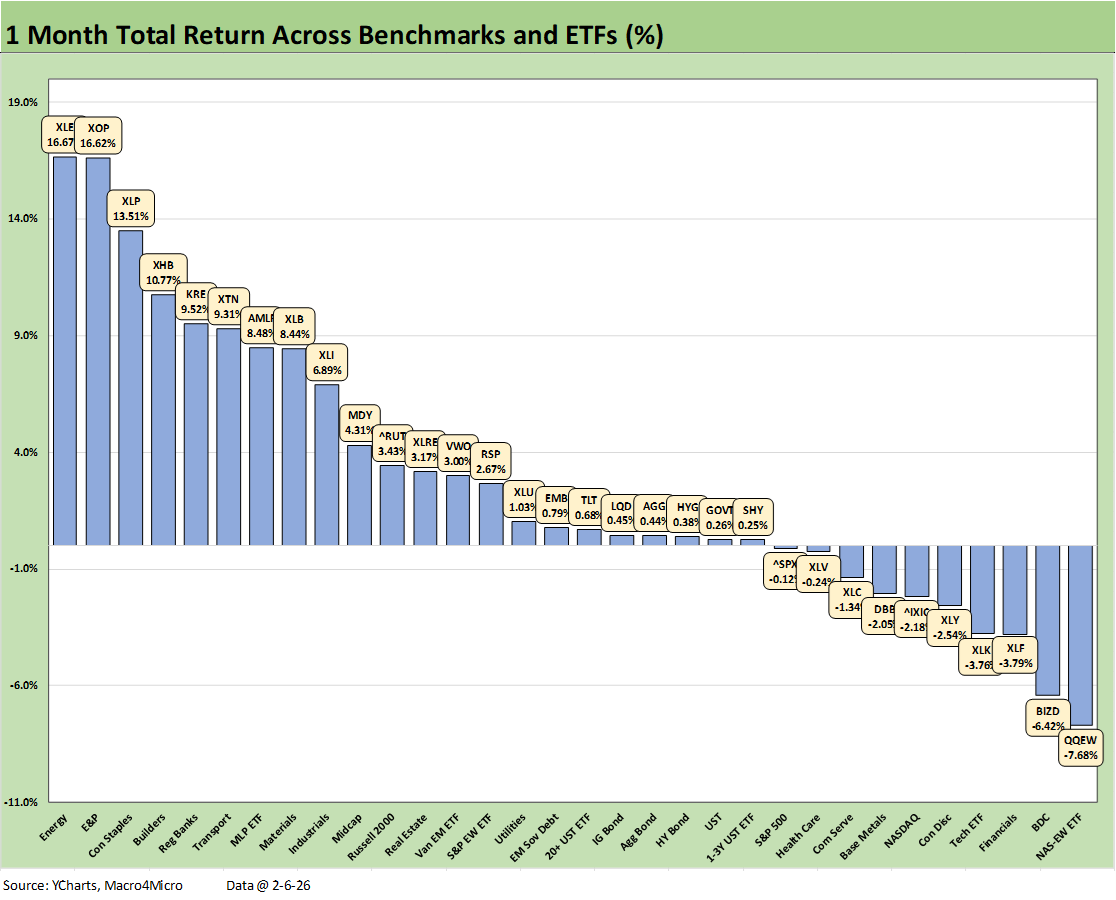
.The trailing 1-month weighs in at 22-10 for positive vs. negative returns. We see all 7 bond ETFs in positive range but comprising most of the 3rd quartile. The bottom quartile includes 5 of 8 under the heading of tech heavy with the Equal Weight NASDAQ 100 ETF (QQEW) in last place. Also in the bottom quartile is the Tech ETF (XLK), Communications Services (XLC), and Consumer Discretionary (XLY) with its heavy weighting of Amazon and Tesla, who were both materially negative on the month. NASDAQ rounds out the tech-centric line items.
The BDC ETF (BIZD) has had more than its share of problems with ugly private credit headlines, but the tech noise now adds another element given the heavy exposure to software and tech services exposure for many private equity players with the related questions of how much of that debt ended up in the private credit funds they manage.
We see Financials ETF (XLF) in the bottom quartile with the major banks and credit card players all in the red for the trailing month. The consumer cycle appears healthier as the year continues, but that does not necessarily transfer over to reserve quality and household debt service risk. The fact that Trump is pushing for 10% credit card caps is not helping the mood on projected interest margins.
The winner for the month includes energy names with Energy (XLE), E&P (XOP), and Midstream (AMLP). We see some of the rotation trade in the mix with Transports (XTN) and Materials (XLB).
The potential for some UST curve optimism to turn into reality has injected new life into Homebuilders (XHB) and dividend heavy Consumer Staples (XLP). Lower short rates would help Regional Banks (KRE), but the regionals have also been occasionally haunted by private credit “guilt by association” with regionals also a major factor in small and mid-sized business lending
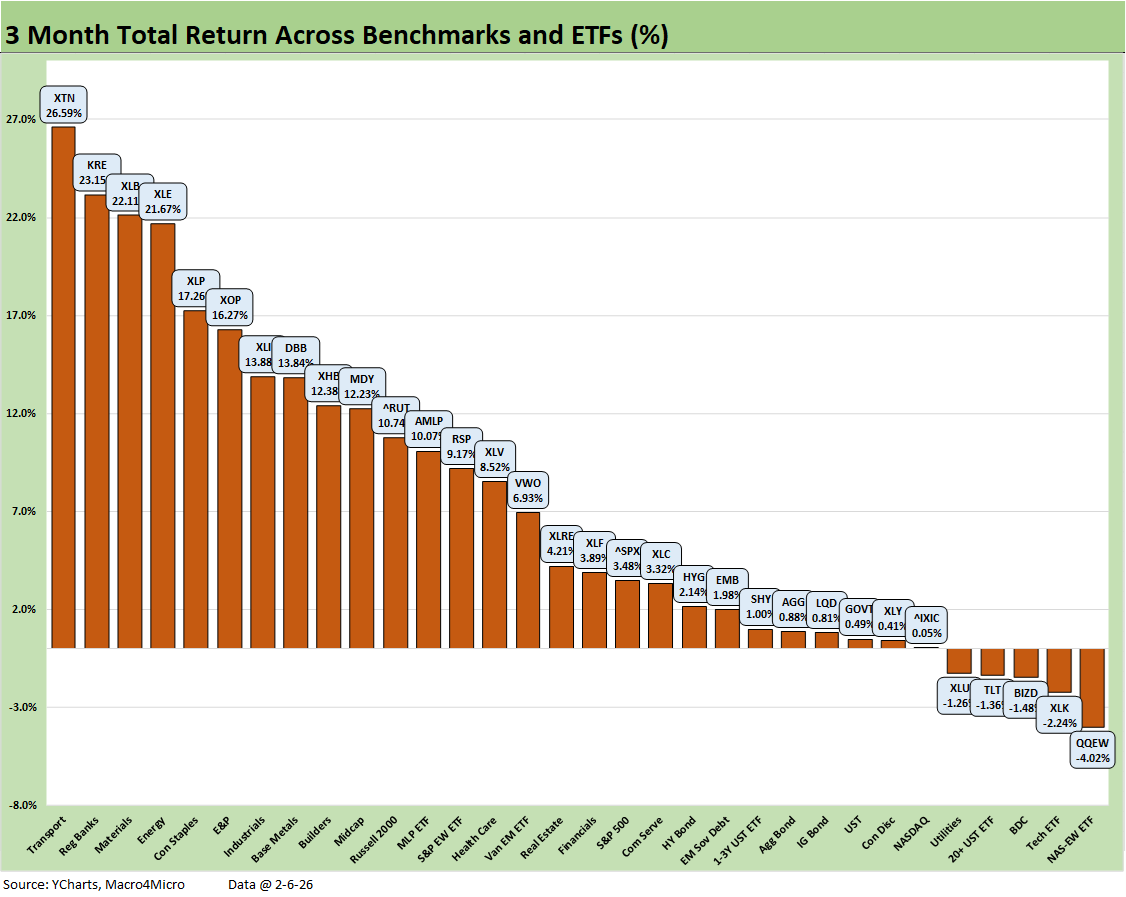
.The 3-month score of 27-5 tells a favorable story but with the notable absence of any of the tech-heavy benchmarks or ETFs in the top tier. The top tier includes Transports (XTN), Materials (XLB), and Industrials (XLI) in a vote of cyclical confidence (and less confidence in tech). Energy (XLE) and E&P (XOP) are in the top quartile on both oil and gas prices. Iran risk and very cold weather offered an assist.
Bond ETFs posted modestly positive returns for 6 out of 7, but we see the stubborn long end and steepening worries in the long duration UST ETF (TLT). Sitting on the bottom is the Equal Weight NASDAQ 100 ETF (QQEW) which was joined in the bottom tier by the Tech ETF (XLK) at second to last with NASDAQ also in the bottom quartile. Consumer Discretionary (XLY) was feeling the serious performance struggles of Tesla and Amazon
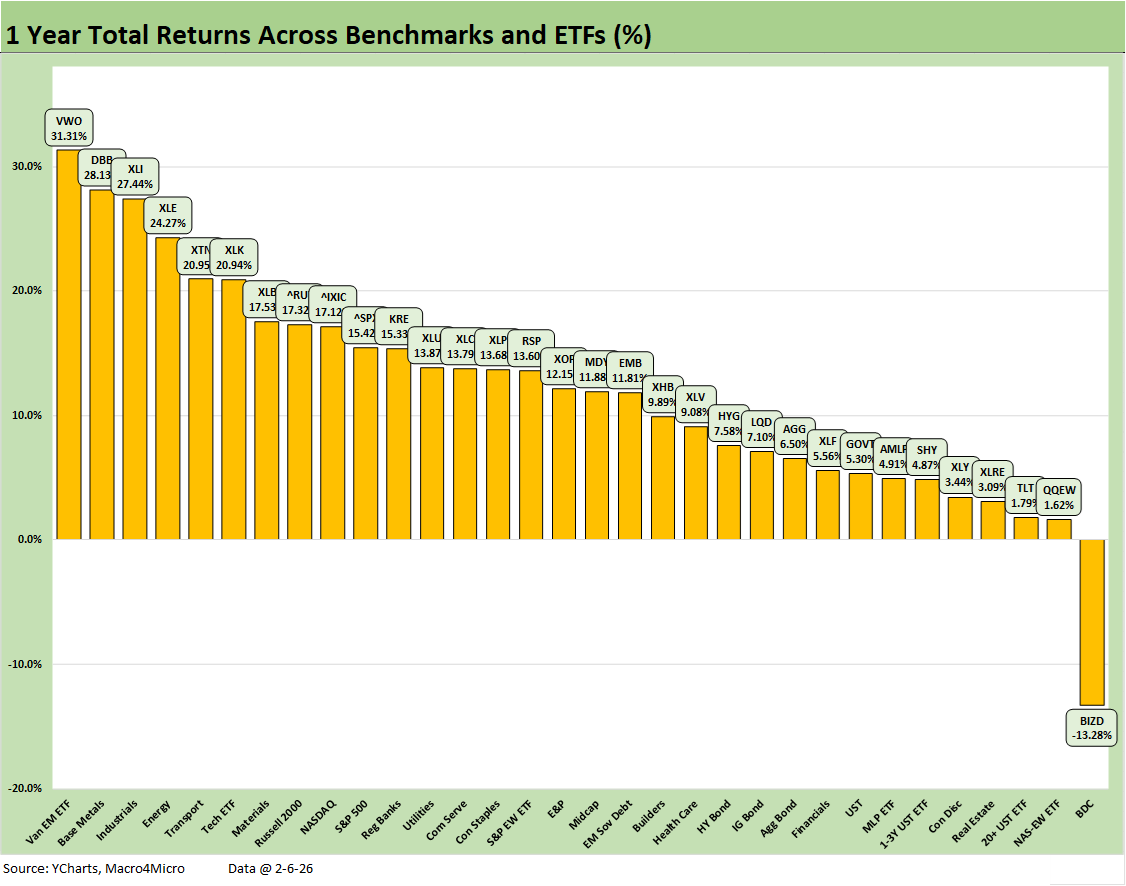
.It is hard not to tip your hat to the LTM numbers with a score of 31-1 with BIZD the main beatdown at a -13.3% return on private credit headlines across 2H25 and into the new year.
We see all the bond ETFs in positive range from 1.8% on the low end (TLT) to +11.8% on the high end (EMB). Credit markets were the winners in bond ETFs.
The 1-year return pattern has more of the big moves in tech in the mix with XLK making the top tier but with NASDAQ and XLC in the second quartile. The top quartile shows some reassuring diversity with EM Equities (VWO), Base Metals (DBB), Industrials (XLI), Energy (XLE), and Transports (XTN) in the top 5 (in that order).
See also:
Switzerland-US Trade: A Deficit that Glitters 2-3-26
US-Taiwan Trade: Risks Behind the Curtain 2-1-26
Market Commentary: Asset Returns 2-1-26
Trade Deficits: Math Challenge 1-30-26
China Trade: Shrinkage Report 1-28-26
Mexico Trade: Gearing up for More Trade Trouble? 1-27-26
Canada-US Trade: Trump Attack N+1 1-25-26
PCE Income & Outlays Nov 2025: Resilient Consumer, Higher Inflation 1-24-26
3Q25 GDP: Updated Estimate 1-22-26
Industrial Production Dec 2025: CapUte Resilience 1-17-26
Existing Home Sales Dec 2025: Getting up off the Mat? 1-16-26
Policy Mud on the Wall: Consumer Debt, Residential Mortgages 1-15-26
CPI Dec 2025: Sideways Calms Nerves – For Now 1-13-26
Payrolls Dec 2025 and FY 2025: Into the Weeds 1-10-26
JOLTS Nov 2025: Job Openings and Hires Down, Layoffs Lower 1-7-26
2025 Spread Walks and Multicycle Return Histories 1-5-26
Annual Return Differentials: HY vs. IG Across the Cycles 1-3-26
Total Return Quilt Across Asset Classes 2008-2025 1-2-26
Cyclical Histories: Will Facts Be in Vogue in 2026? 1-2-26
3Q25 GDP: Morning After Variables to Ponder 12-27-25
Durable Goods Oct25: Core Capex Still in Gear 12-23-25