
Market Commentary: Asset Returns 10-19-25
Solid equities, tighter HY spreads and favorable duration made for a good rebound week after the prior week’s beatdown.


Look at the numbers…devalue Washington inputs.
The week posted solid asset returns with equities and the UST curve both positive. With a weak starting point from last Friday’s ugly close, this week brought a strong set of numbers. The weakest of the time horizons we track below (trailing 1-month) is still only 20-12 favoring positive in our group of 32 benchmarks and ETFs. The “good equity, good debt” story remained intact with October (99.0%) and December (94.0%) FOMC cuts still posting overwhelming odds by FedWatch for -25 bps at each meeting.
When we say “trust your eyes,” we mean the actual sequential trend lines across products in the CPI report coming this week. That will at least offer something. We will still be starved for econ data and are unlikely to get the 3Q25 GDP data this month the way things are going in Washington. Meanwhile, the mail will be arriving in coming weeks on new premiums for the ACA. That could wag some households.
We also recommend going to trade groups such as the Chamber of Commerce and small business commentary for more sea level color. The same for National Association of Manufacturers. Bessent et al. speak with forked tongue and use more than a few sleights of hand with the headline data, so the numbers in the belly of the economic releases are the main event. Now we just need more releases.
The past week saw a very reassuring set of numbers from the biggest banks and from major consumer lenders such as Synchrony, who reported improved asset quality and favorable color on the steady consumer sector. This coming week Cap One is a key card and consumer player and should provide valuable input. While the cyclical turn could be signaled from weaker consumer tiers, the bulk of consumer spending, payment, delinquency, and charge-off data are steady and even improved to the point of allowing for some reserve releases.
The “credit challenge” from recent private credit headlines (First Brands, Tricolor) are seeing extrapolation running wild with cockroach theories on Regional Banks seeing some pain in equities. The private credit headlines tend to land since private credit lacks transparency. We will see waves of BDC earnings reports ahead with the bulk in the first week of November. Meanwhile, 3Q25 earnings guidance will be a relief from the likely protracted lack of economic data with GM and Ford teed up this week along with defense and aero, rails/freight, telecom, more regional banks, and a few of the index bellwethers such as Netflix and Tesla among others.
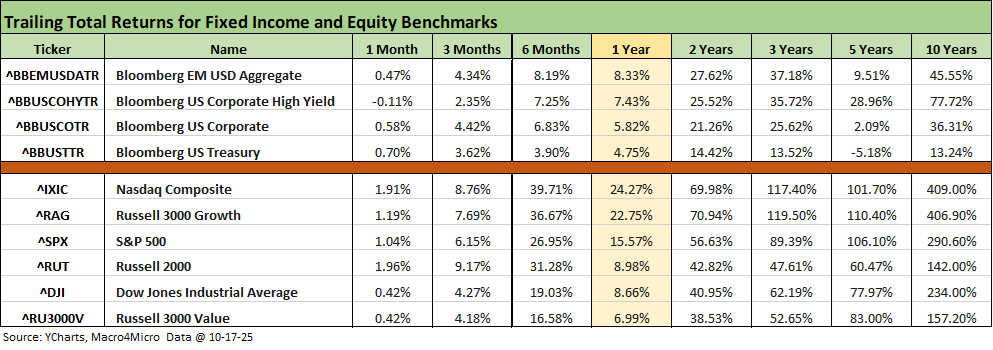
The above table updates the high-level debt and equity benchmarks across a range of time horizons. HY bonds fell slightly into negative range for the past 1-month after last week’s spread widening, but the negative returns are minimal in this table with the trailing 5-year UST benchmark in the red at -5.2%. Last week, the Russell 3000 value index had dipped slightly into the negative zone for the trailing month but crossed back into positive range this week.
The rolling return visual
In the next section, we get into the details of the 32 ETFs and benchmarks for a mix of trailing periods. Below we offer a condensed 4-chart view for an easy visual on how the mix of positive vs. negative returns shape up. This is a useful exercise we do each week looking for signals across industry groups and asset classes.
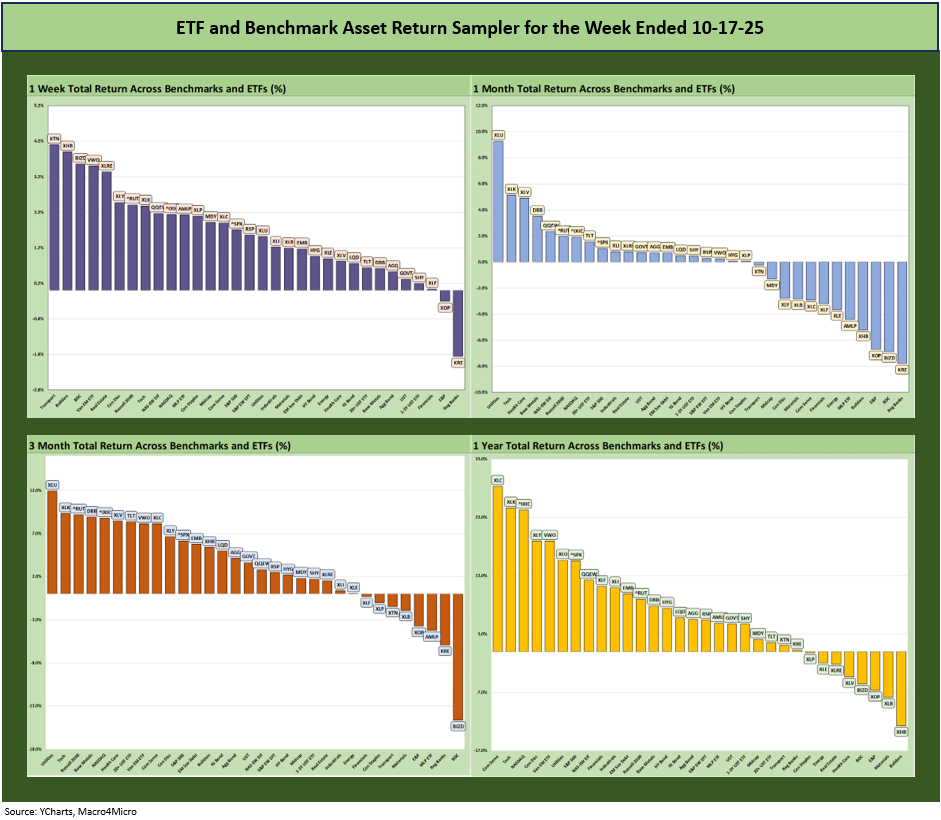
The chart above hammers home the favorable symmetry across the time horizons above with the 1-month more balanced but still heavily in positive range at 20-12 as detailed below. The YTD returns (not shown above) are still at 28-4 as covered in the charts below.
The Magnificent 7 heavy ETFs…
Some of the benchmarks and industry ETFs we include have issuer concentration elements that leave them wagged by a few names. When looking across some of the bellwether industry and subsector ETFs in the rankings, it is good to keep in mind which narrow ETFs (vs. broad market benchmarks) get wagged more by the “Magnificent 7” including Consumer Discretionary (XLY) with Amazon and Tesla, Tech (XLK) with Microsoft, Apple, and NVIDIA, and Communications Services (XLC) with Alphabet and Meta.
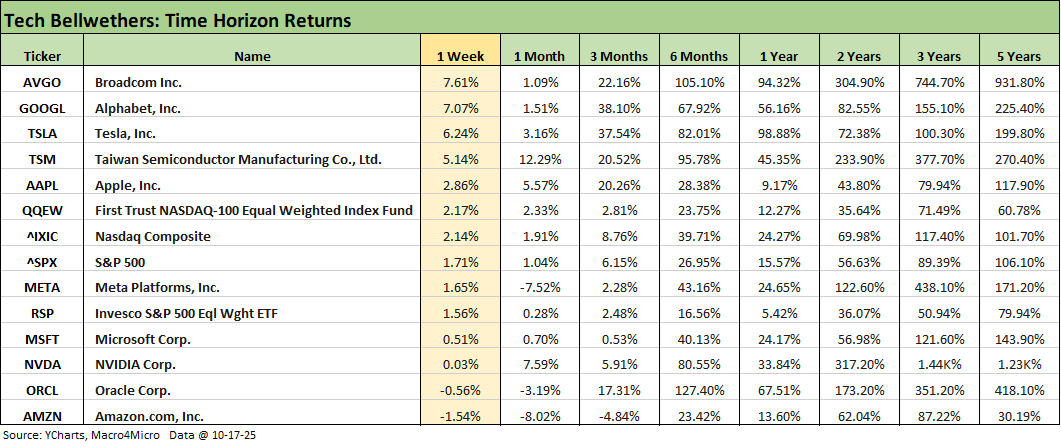
We already looked at the 1-week returns for the tech bellwethers in our Mini Market Lookback: Healthy Banks, Mixed Economy, Poor Governance (10-18-25). As covered in commentaries along the way, the dispersion across the “Mag 7+3” ( the 7 + Broadcom, Taiwan Semi, and Oracle) has been a recurring feature that we see across the trailing 3-months. Even with some names faltering into late 2025, the trailing 1 year and 2-year periods continue to drive home the tech boom vs. the broad market with the chip players in the lead. The recent weeks have been choppy, and the tech names do not need increased tension with China as the recent reaction to the trade spat drove home.
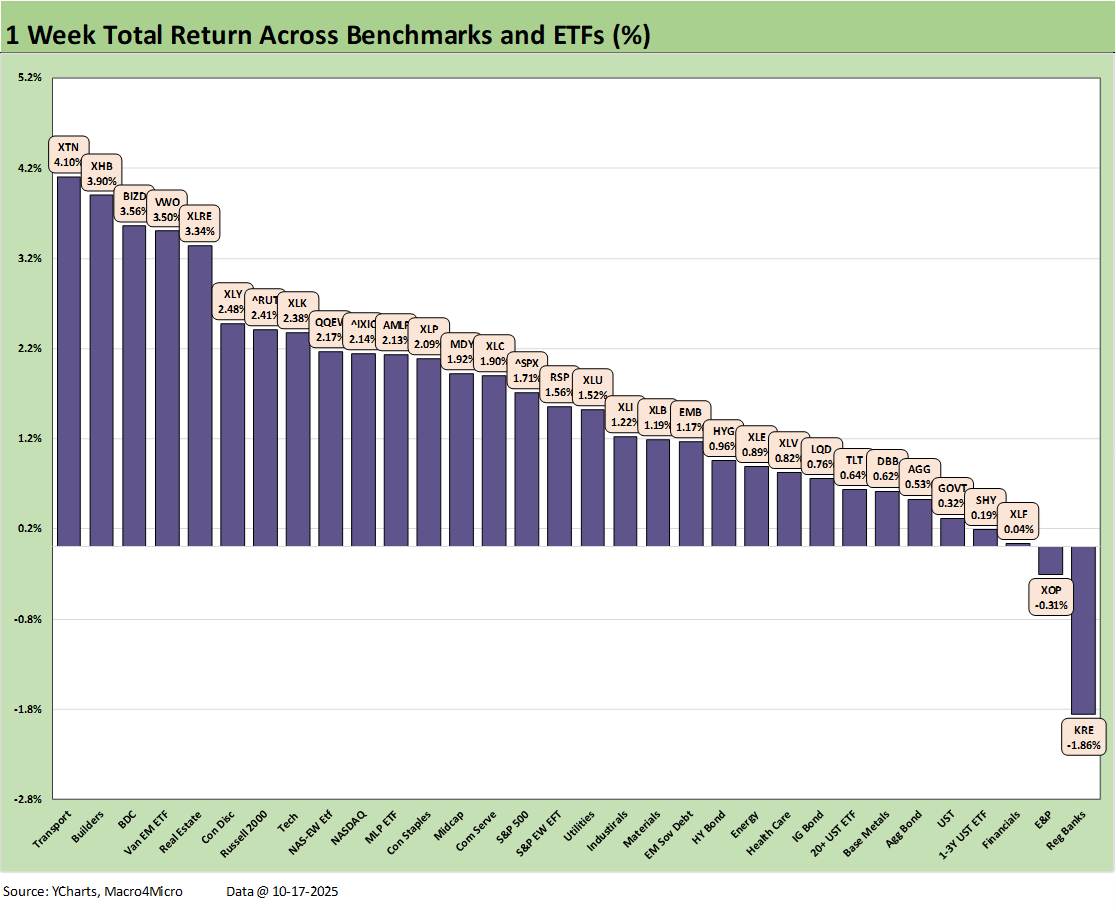
We already looked at the 30-2 score for the 1-week returns in our Mini Market Lookback: Healthy Banks, Mixed Economy, Poor Governance (10-18-25). We see 5 of the ETFs above the 3% return line for the week with a few of the more beaten down ETFs of the past 1-month period such as Homebuilders (XHB) and BDCs (BIZD) getting a “worst shall be first” bounce this week. Earnings season could reassure on the fear of the unknown and especially for BDCs.
Regional Banks (KRE) were the story of the week given the sudden bout of fear around private credit quality, some commercial real estate problem headlines, and perhaps defensiveness for regionals given the memories back to the shocking confidence contagion in March 2023 (see Regional Banks: Mornings After, Market Reactions, and Consumer Finance 4-23-23, Silicon Valley Bank: Loans and Haircuts 3-27-23). The banks will need to do a good job in reassuring on credit quality and provisioning to help keep the bear extrapolation in check.
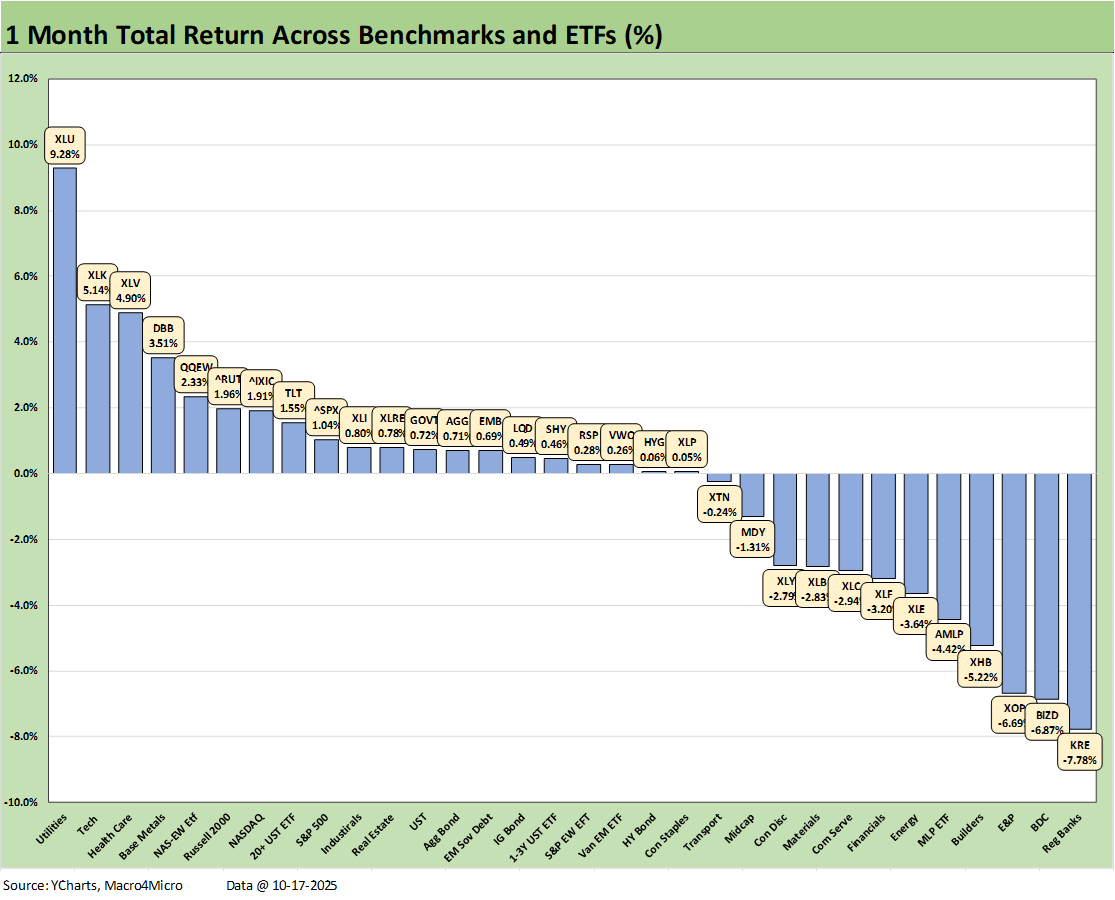
The 1-month returns carried the most negative returns of the mix at a score of 20-12. We see regional banks on the bottom at -7.8% with the BDC ETF (BIZD) close behind at -6.9%. The bottom quartile includes 3 energy ETFs (XLE, AMLP, XOP) with Homebuilders (XHB) in the bottom 5.
Utilities (XLU) was the big winner in the group at #1 with Tech (XLK) a distant #2, Health Care (XLV) at #3 with some big pharma rallies, Base Metals (DBB) at #4, and the Equal Weight NASDAQ 100 (QQEW) rounding out the Top 5 with the Russell 2000 small caps at #6 head of NASDAQ and the S&P 500.
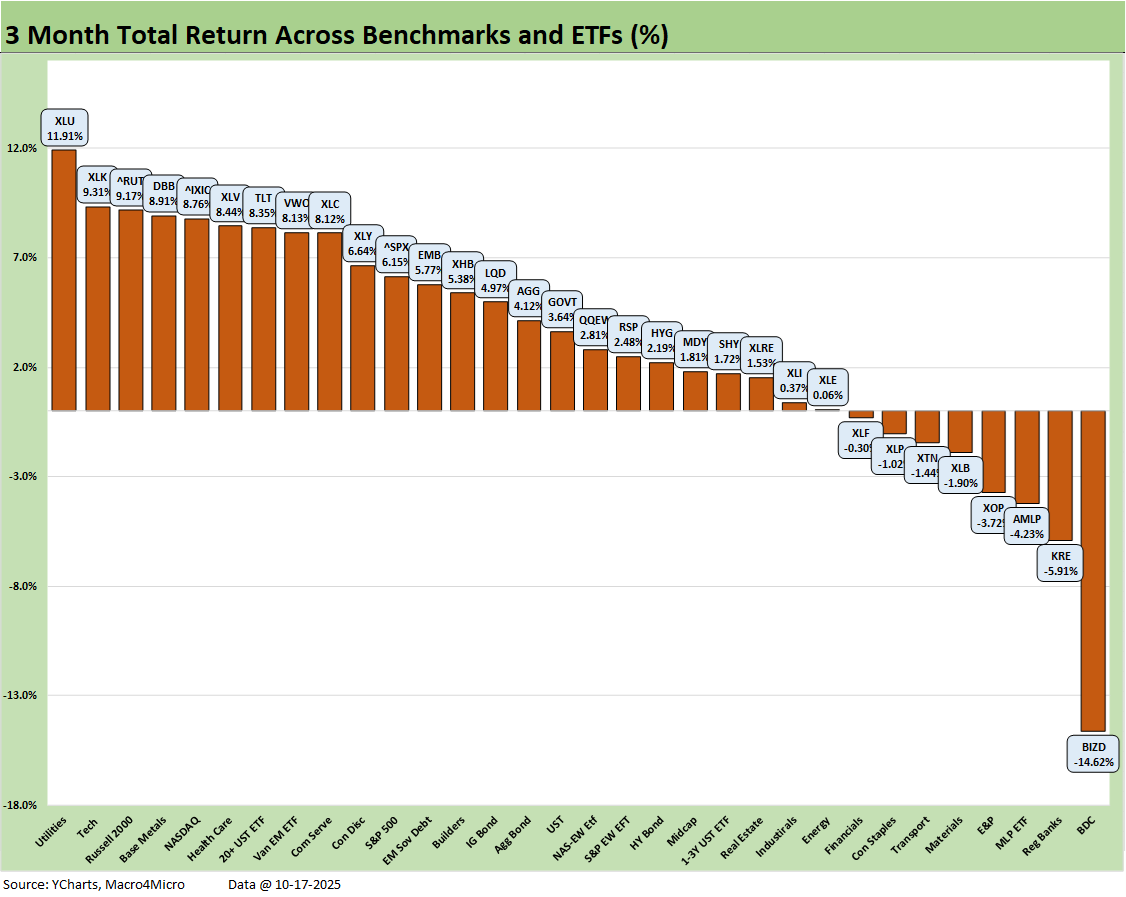
The rolling 3-months weighed in at 24-8 with some of the expected ETFs struggling in the bottom quartile in negative range. The most beaten up is the BDC ETF (BIZD) at an atrocious -14.6% in last place. First Brands and Tricolor headlines have sent the market reeling. There is no shortage of BDCs that will be reporting Sept quarter earnings into early November, and investors will be applying the Jamie Dimon cockroach theory looking for valuation question marks and soft spots.
The BDCs will be reporting mostly in early November with some big names such as Ares in late October, and the market will be looking for some extra effort in disclosure and Q&A. The color in BDCs earnings reports and presentations is typically very granular. The recent headlines have clearly spooked the private credit image even though so far there are only a few bad headlines and extrapolation is running off the rails.
For the winners over 3 months, we see Utilities(XLU) at #1 again with Tech (XLK) at #2, Russell 2000 posting an impressive #3, Base Metals (DBB) at #4 and NASDAQ at #5. All the bond ETFs are positive, and the long duration UST (TLT) even made it into the top quartile with 4 more bond ETFs in the second quartile (EMB, LQD, AGG, GOVT). HY ended up in the third quartile along with the short UST ETF (SHY).
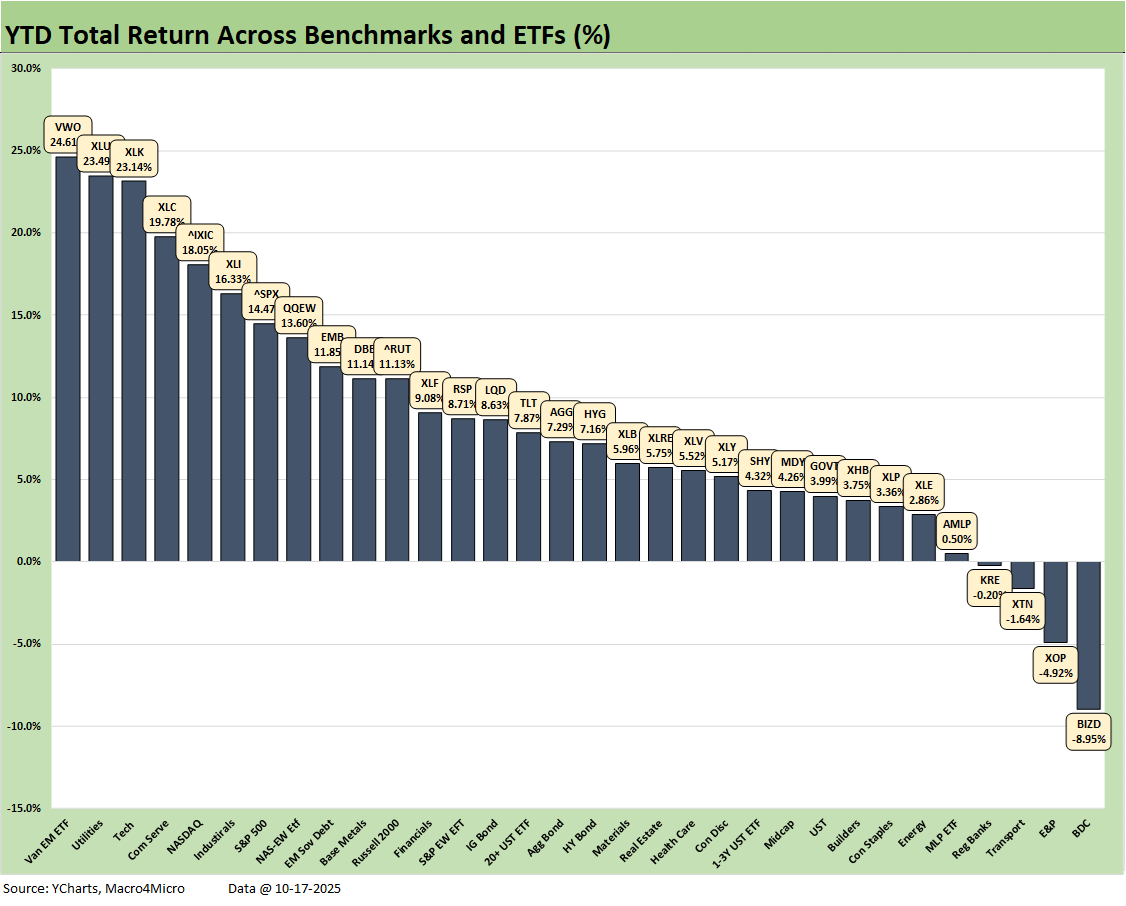
The YTD return rang up a 28-4 score with BDCs (BIZD) on the bottom again and E&P (XOP) a more distant second to last. We also see Transports (XTN) and the recent pressure on Regional Banks (KRE) rounding out the YTD negative returns. The winners include EM Equities (VWO) at #1, Utilities (XLU) again strong at #2, Tech (XLK) at #3, Communications Services (XLC) #4 and NASDAQ at #5.
The S&P 500 is in the top quartile with a YTD return of 14.5%. That means the S&P 500 needs to put slightly more than 10 points on the board through year end to match the 2024 return numbers and fall just short of the 2023 numbers.
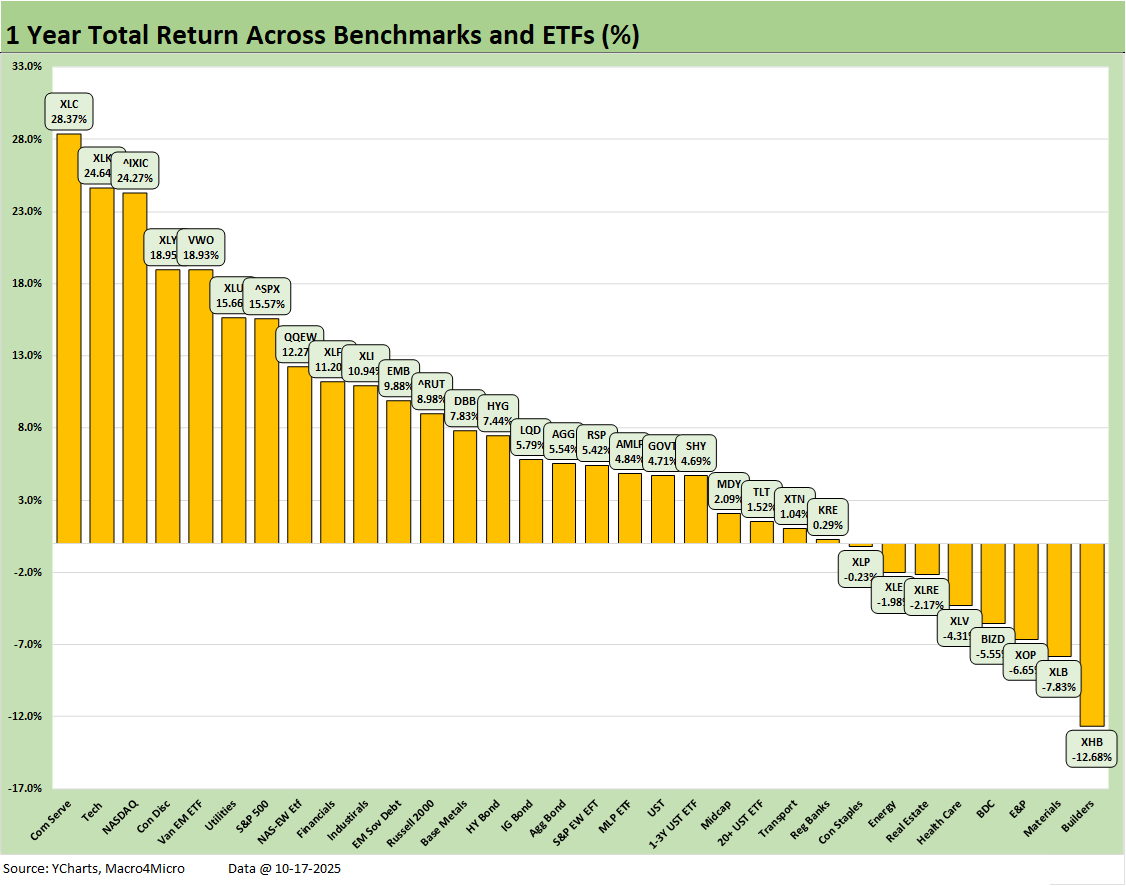
The 1-year returns stood at 24-8 again this week. Homebuilders (XHB) sit in last place at -12.7% given more than a year since the start of the sell-off in 4Q24. We see Materials (XLB) in second to last at -7.8%. The E&P ETF (XOP) is 3 off the bottom at -6.7% while the broad Energy ETF (XLE) is also in the red. As discussed earlier, the BDC ETF (BIZD) headline defaults are setting off a lot of guilt-by-association nerves to go along with worries around the quality of due diligence and portfolio monitoring. BIZD is down -5.6% for the LTM period.
On the leaderboard, Communications Services (XLC) holds down #1 at over 28%, the Tech ETF (XLK) at #2 at 24.6%, NASDAQ #3 at 24.3%, Consumer Discretionary (XLY) at #4 with +18.95%, and EM Equities (VWO) at 18.93% rounding out the top 5. Utilities (XLU), the S&P 500, and the Equal Weight NASDAQ 100 (QQEW) round out the top quartile. In other words, 4 of the top 5 have Mag 7 members.
As covered in the prior YTD chart, the S&P 500 will need to finish 2025 in impressive fashion to match the 2024 and 2023 S&P 500 returns. It is doable, but it needs good news. The year 2024 was Part Two of the best 2-year run in the S&P 500 since the late 1990s, so that sets a high bar for the Trump stock market (see Footnotes & Flashbacks: Asset Returns for 2024 1-2-25).
The S&P 500 return of +25% for 2024 (26% 2023) will be very hard to match in 2025-2026. Trump says the US was a “dead country” over just over 9 months ago, so that raises the stakes on hitting those marks while selling that story line. The “trust your eyes” rule should cause you to look at the PCE lines and fixed asset investment lines of GDP looking back across the quarters. Unfortunately, some of the data services are offline for the shutdown. Meanwhile, stock return math provides objective numbers for a discussion starting point.
The current economy is lagging on some key GDP lines and is well behind 2024 along the PCE line of GDP, which is 68% of GDP. The investment numbers in the GDP lines also do not match up with the “trillions in investment story line.” Those investment “promises” still need to show up in the numbers. GPDI has been mixed (negative in the 2Q25 final) with Equipment doing well in 2025 (tax bill helps) but Structures are weak. Intellectual Property has been doing well on the tech boom while Residential struggles.
See also:
Mini Market Lookback: Healthy Banks, Mixed Economy, Poor Governance 10-18-25
Credit Markets: Toxic Brew? New or Old Recipe? 10-13-25
The Curve: Macho Man Meets Patient Man 10-12-25
Market Commentary: Asset Returns 10-11-25
Mini Market Lookback: Event Risk Revisited 10-11-25
Credit Profile: General Motors and GM Financial 10-9-25
Credit Markets: The Void Begins 10-6-25
The Curve: Blind Man’s Bluff 10-5-25
Mini Market Lookback: Chess? Checkers? Set the game table on fire? 10-4-25
JOLTS Aug 2025: Tough math when “total unemployed > job openings” 9-30-25
Credit Markets: Cone of Silence Ahead? 9-29-25
The Curve: Easing Anxiety at Bat, Tariffs on Deck 9-28-25
Mini Market Lookback: Market Compartmentalization, Political Chaos 9-27-25
PCE August 2025: Very Slow Fuse 9-26-25
Durable Goods Aug 2025: Core Demand Stays Steady 9-25-25
2Q25 GDP Final Estimate: Big Upward Revision 9-25-25
New Homes Sales Aug 2025: Surprise Bounce, Revisions Ahead? 9-25-25
Credit Markets: IG Spreads Back in the Clinton Zone 9-22-25
Mini Market Lookback: Easy Street 9-20-25
FOMC: Curve Scenarios Take Wing, Steepen for Now 9-17-25
Home Starts August 2025: Bad News for Starts 9-17-25
Industrial Production Aug 2025: Capacity Utilization 9-16-25
Retail Sales Aug 2025: Resilience with Fraying Edges 9-16-25
Credit Markets: Quality Spread Compression Continues 9-14-25
Mini Market Lookback: Ugly Week in America, Mild in Markets 9-13-25
CPI August 2025: Slow Burn or Fleeting Adjustment? 9-11-25
PPI Aug 2025: For my next trick… 9-10-25
Mini Market Lookback: Job Trends Worst Since COVID 9-6-25
Thank you.
Here are my Sep CPI estimates:
https://arkominaresearch.substack.com/p/sep-2025-cpi-estimate?r=1r1n6n
Perfect timing for this, super insightful as always. Just curious, could you elaborate a bit on the 'Bessent et al. forked tounge' part?