
Market Commentary: Asset Returns 10-11-25
We update asset returns after a Friday beatdown in equities with the return of China trade anxiety.

Another round of heavy tariffs and potential trade war escalation with China has set off fresh alarms in the market at a time when a shutdown is unfolding that could break Trump’s own record (34 days). The impacts of tariffs in place now and steadily rolling into working capital cycles and capex planning will keep taking a toll on employers and consumers at a time when payrolls are already under pressure.
The immediate reaction sent the 1-week returns in our group of 32 benchmarks and ETFs to a weekly score of 6-26 with 9 of the 10 Mag 7+3 (Broadcom, Taiwan Semi, Oracle) into negative returns for the week. The 11 S&P sectors posted 2 positive and 9 negative on the week with the UST rallying. Credit spreads widened with HY out by +38 bps on the week and finally above the June 2007 range.
The lack of steady data releases from the BLS and BEA is at least going to see the BLS call back workers for the Sept 2025 CPI release needed to support the COLA inputs for Social Security.
The job market remains weak and the employment side of the dual mandate needs more hard data, but the market sees enough ammo to keep the CME FedWatch odds of 2 more cuts high (-25 bps in Oct at 98.3%, -25 bps in Dec at 91.7%). A big question is whether a fresh tariff war with China will set off alarms at the FOMC on inflation risk (it should).
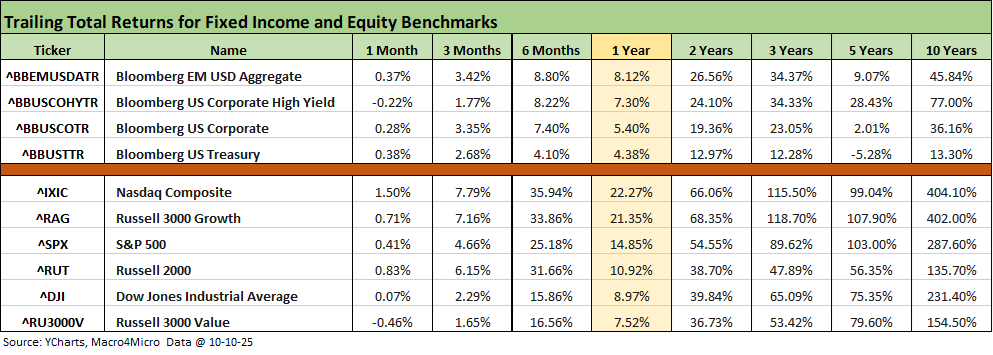
The above table updates the high-level asset returns for debt and equity. We see more negative numbers this week after the past few weeks where only the 5-year UST returns were in the red. This week we see some red ink in the trailing 1-month with HY negative for 1-month in debt and the rest of the debt lines under 0.4% for the 1-month period.
In equities, the 1-month returns mix is showing signs of trouble with this last week putting a dent in the positive returns. For the 1-month return, only NASDAQ held in above 1% at +1.5% with the S&P 500 only at +0.41%. We see Russell 3000 Value index in the red. Given the lofty valuations that have been prevailing, the combination of factors are on a well-traveled path (shutdown, tariff brinkmanship) but this time all are unfolding at the same time. The China clash goes to the top of the risk list since that is closest to the FOMC worries and stagflation threat.
The stock market is used to dysfunction and generally stupid, spineless people in Washington. This shutdown adds a major budget demand (ACA premium relief) and also includes mass layoffs at the Federal level that make the whole shutdown situation even harder to resolve. The last protracted shutdown comp was the 34-day shutdown in Dec 2018/Jan 2019 over the Mexico wall funding. The GOP had the White House, Senate, and House by the time the deal was struck.
The rolling return visual
In the next section, we get into the details of the 32 ETFs and benchmarks for a mix of trailing periods. Below we offer a condensed 4-chart view for an easy visual on how the mix of positive vs. negative returns shape up. This is a useful exercise we do each week looking for signals across industry groups and asset classes.
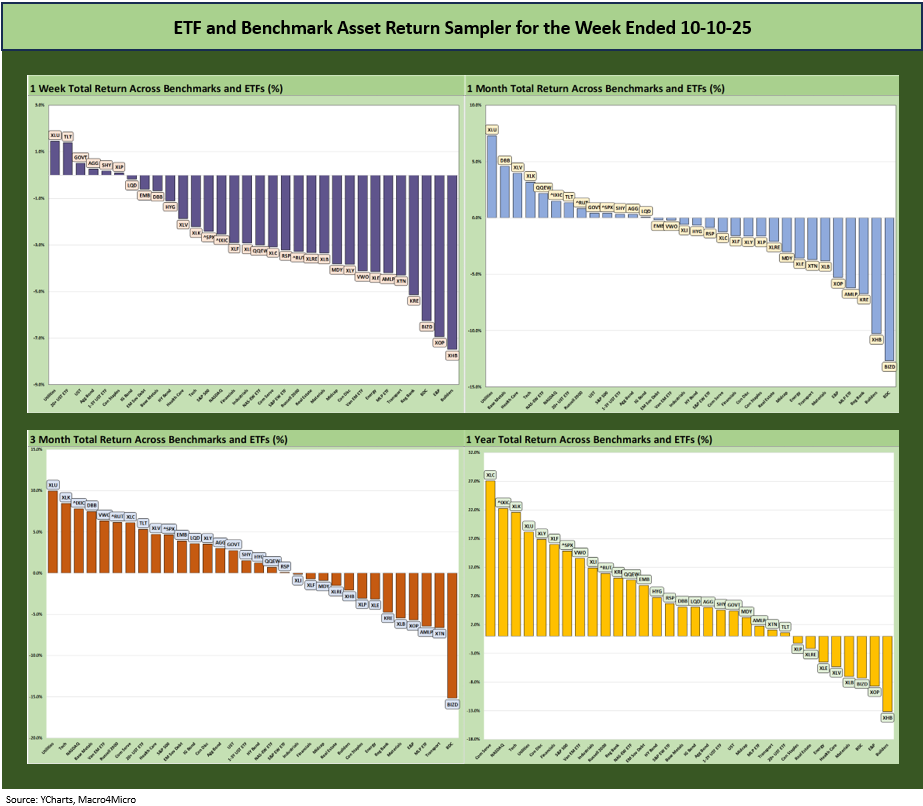
The above chart is showing a recent adverse shift for 1-week, 1-month, and 3-months moving in a more negative direction. We also have a YTD chart further below that posted a score of 27-5 that is still impressive even if slightly weaker than recent weeks.
The Magnificent 7 heavy ETFs…
Some of the benchmarks and industry ETFs we include have issuer concentration elements that leave them wagged by a few names. When looking across some of the bellwether industry and subsector ETFs in the rankings, it is good to keep in mind which narrow ETFs (vs. broad market benchmarks) get wagged more by the “Magnificent 7” including Consumer Discretionary (XLY) with Amazon and Tesla, Tech (XLK) with Microsoft, Apple, and NVIDIA, and Communications Services (XLC) with Alphabet and Meta.
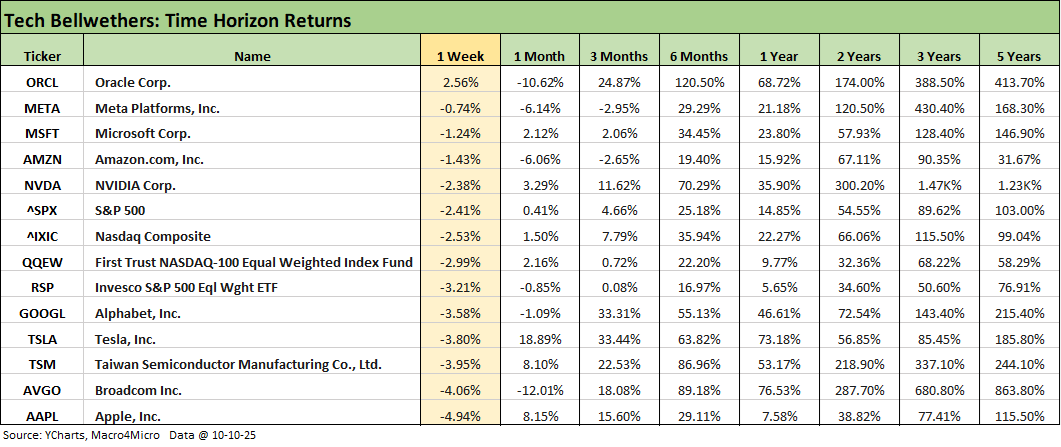
We already looked at the tech bellwethers in our Mini Market Lookback: Event Risk Revisited (10-11-25), and we only see a single positive line for the week in Oracle. The China X-factor is going to weigh heavily on tech when one considers the supplier chain needs and fallout for production volumes as more tariffs lie ahead and bring more opportunities for conflict with multiple trade partners. Meanwhile, the IEEPA is arguably more important to the evolution of trade with a November rendezvous with SCOTUS.
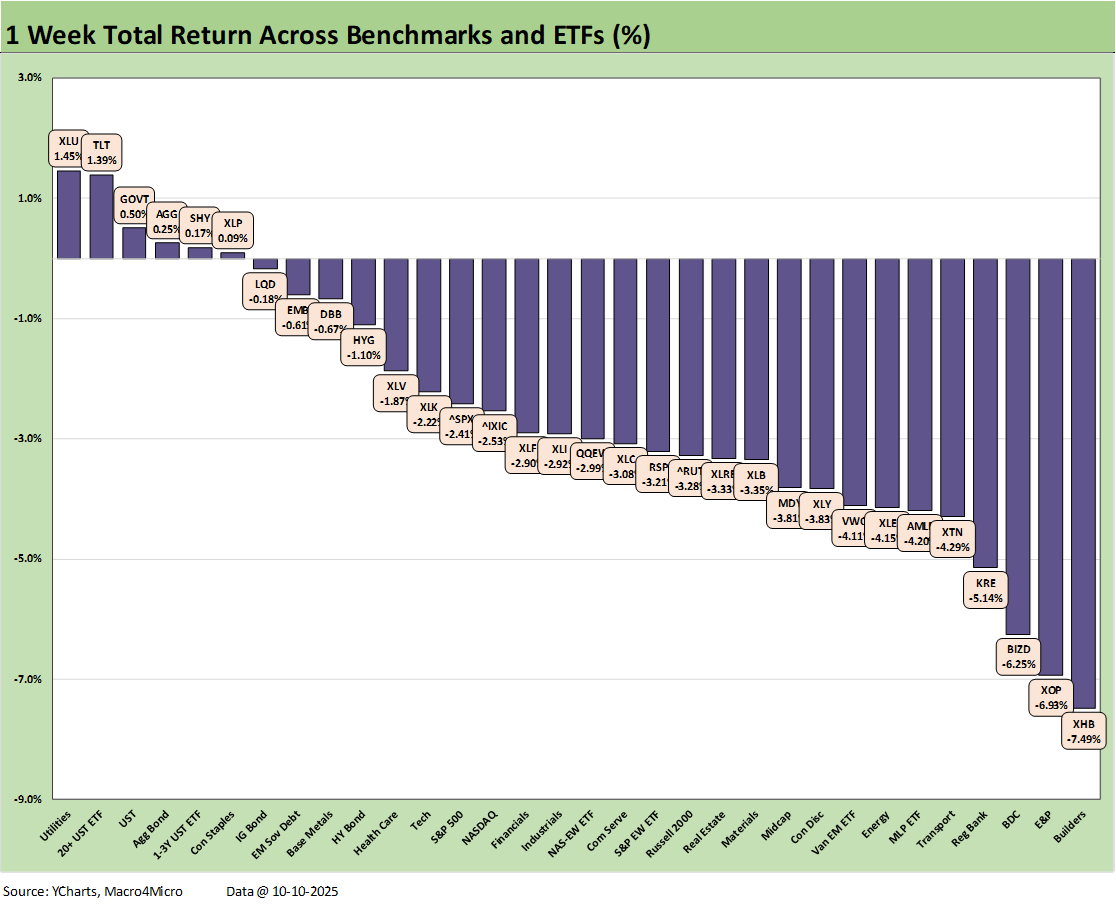
We already addressed the grim 1-week numbers of 6-26 in our Mini Market Lookback: Event Risk Revisited (10-11-25). Most of the damage took place on Friday. There is plenty of room for the China situation to get worse or better. Trump has been very active in demanding that other trade partners place very high tariffs on China, and that is an area where we would expect some demands to be made by China.
Trump likes giving demands, so this one is tricky. The cycle of aggression in trade sees the US up against the one partner it cannot dominate. The best the market can hope for is “Pause N+1” with a scheduled meeting somewhere at some time where they can get yet another extension. The market could rally off that. Otherwise, the trade war could be back on. The gloomiest scenario is that China negotiations breaks down and in turn Mexico and Canada find their nerve.
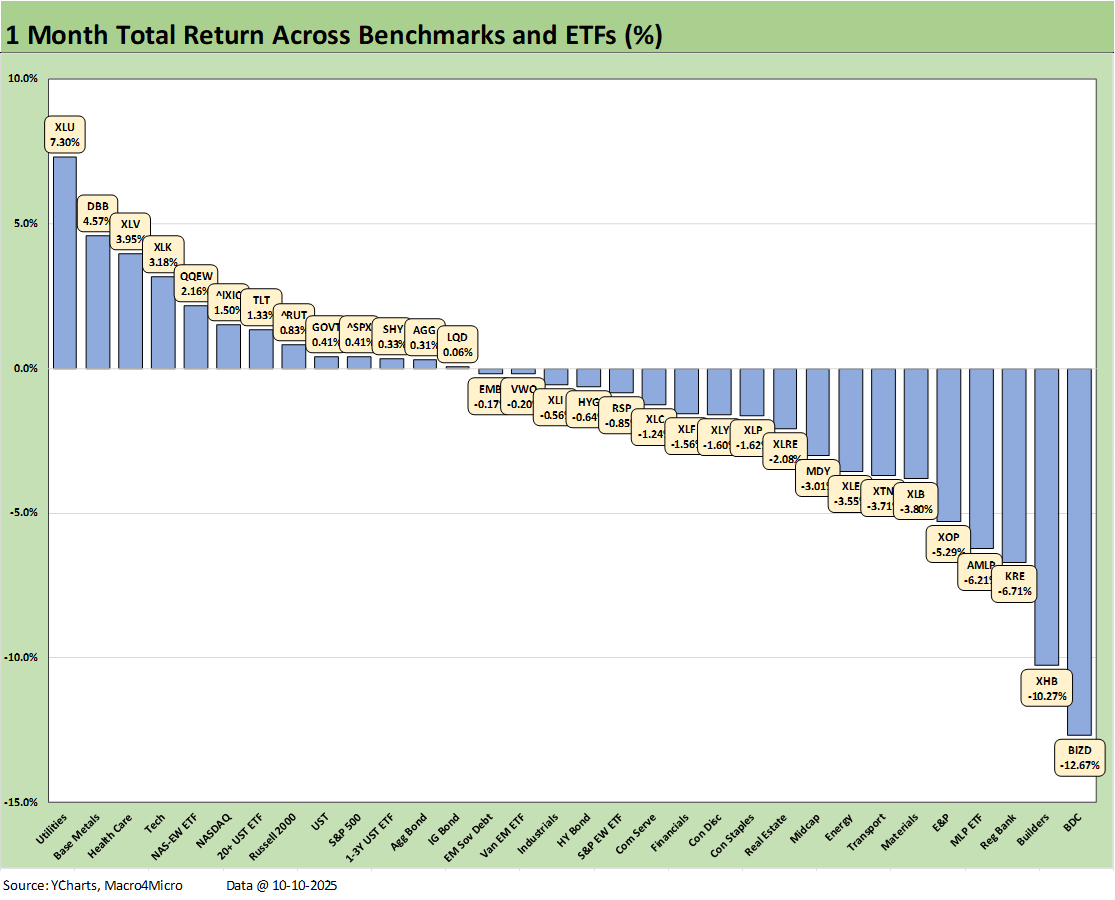
The 1-month score of 13-19 shows a material sell-off in BDCs (BIZD), who sit on the bottom with -12.7% and Homebuilders (XHB) at -10.3% in second to last. Regional Banks (KRE) income-heavy Midstream Energy (AMLP), and E&P (XOP) round out the bottom 5.
The BDC private credit headlines around such a massive emerging asset class will test the demand for BDCs and perhaps the rate of flows into the broader private credit space. BIZD has also now fallen to the bottom of the YTD return rankings as well and is 3 off the bottom for the trailing 1-year.
The winners show Utilities (XLU) on top with Base Metals (DBB), Health Care (XLV), Tech (XLK) and the Equal Weight NASDAQ 100 ETF (QQEW) in the top 5. We see NASDAQ, the long duration UST ETF (TLT), and the Russell 2000 small caps rounding out the top quartile.
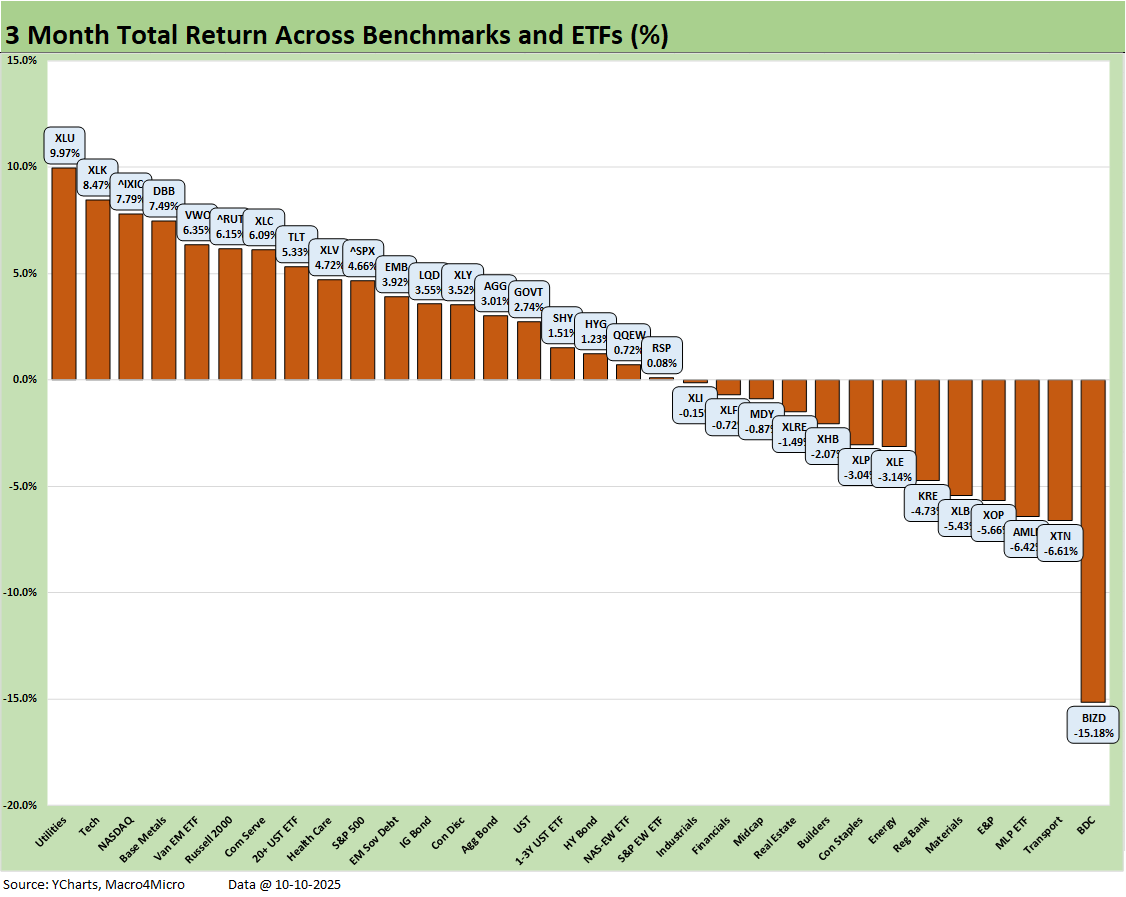
The 3-month return timeline score stands at 19-13 and is showing the effects of the recent volatility after running a positive vs. negative balance of 28-4 last week. Once again, we see where the First Brands and Tricolor disasters in private credit have sent BDC investors scrambling to the exits. Tricolor is easier in concept (subprime auto lending), but First Brands is looking more like “bad controls, bad due diligence, bad quality monitoring and a whole lotta bad intent.”
The high cash dividends and high yields in the private space are enticing, but the desire for good risk management doesn’t always work out as one would expect. The natural reaction tends to be “extrapolation run amok.” The -15.2% over 3 months with dividend yields over 12% tend to attract the income-focused with higher credit risk appetites. This will be an interesting one to watch in earnings season for the extra effort in reassurance from a wide range of top shelf management teams that will need to make their case. Back in 2002, some bellwethers saw hard-to-explain meltdowns in TMT (even beyond WorldCom) that sent BBB bonds plunging before they rebounded.
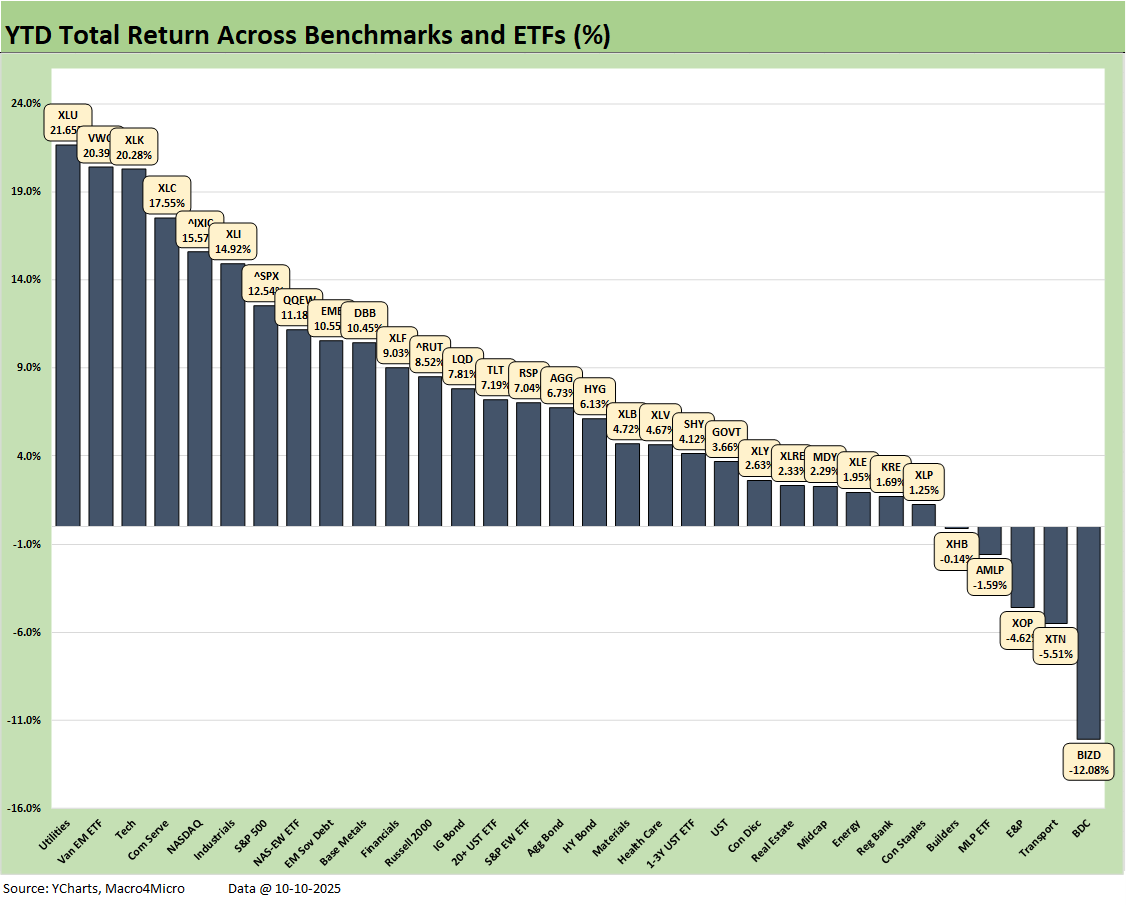
The YTD returns are still framing up well at 27-5. We see all bond ETFs positive with EM Sovereign the best of the pack with 4 bond ETFs in the second quartile and 3 bond ETFs in the third quartile. BIZD sits on the bottom in this timeline also with tariff-sensitive Transports (XTN), E&P (XOP), Midstream Energy (AMLP), and Homebuilders (XHB) comprising the 5 ETFs in the red.
The winners YTD include Utilities (XLU) at #1, EM Equities (VWO) at #2, Tech (XLK) at #3 with the top 3 posting returns over 20%. Most of the top quartile below #2 had a heavy tech-centric feel with Communications Services (XLC), NASDAQ, the tech-heavy S&P 500 with its major market share weightings across the tech bellwethers, and the Equal Weight NASDAQ 100 ETF (QQEW). At least Industrials (XLI) found its way into the top quartile for some optimism on diversification. The Financials ETF (XLF) was down in the second quartile.
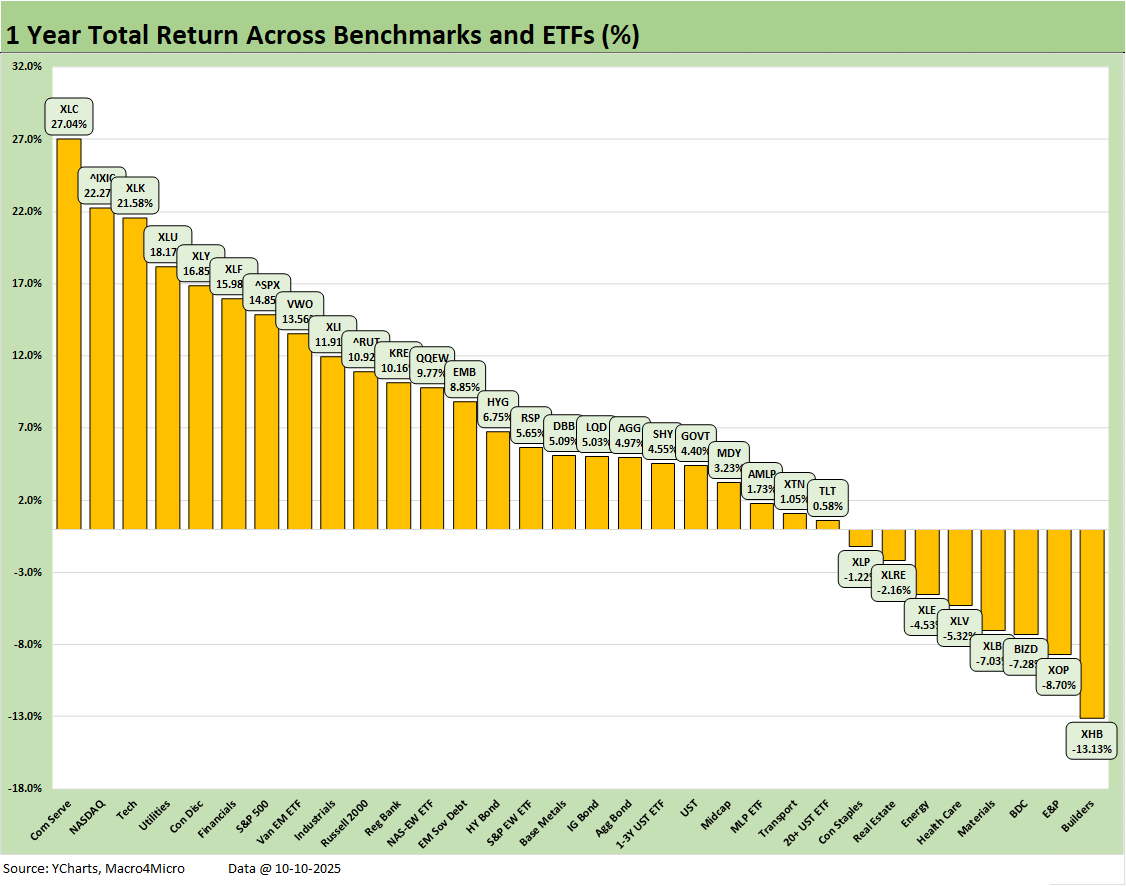
The 1-year returns stood at 24-8 this week. Homebuilders (XHB) sit in last place at -13.1% given more than a year since the start of the sharp sell-off that began in 4Q24. We see E&P (XOP) in second to last at -8.7% as oil was battered again this week. The broad Energy ETF (XLE) is also in the red. The BDC ETF (BIZD) headline defaults are setting off a lot of guilt-by-association nerves to go along with worries around the quality of due diligence and portfolio monitoring. BIZD is down to -7.3% for the LTM period.
The cyclical Materials ETF (XLB) is four off the bottom at -7.0%, which for its part is a bad sign for cyclical confidence. Health Care (XLV) climbed off the bottom where it stood two weeks ago after some very strong pharma rallies recently. Consumer Staples ETF (XLP) and Real Estate ETF (XLRE) round out the ETFs in the red zone.
On the leaderboard, Communications Services (XLC) holds down #1 at +27%, NASDAQ #2 at 22.3%, and the Tech ETF (XLK) at #3 at 21.6%. Utilities (XLU) and Consumer Discretionary (XLY) round out the top 5. Financials (XLF), the tech-heavy S&P 500 and EM Equities (VWO) wrap the top quartile. Industrials (XLI) just missed the top quartile at the top of the second quartile.
The S&P 500 LTM stands at 14.9% over 1-year (12.5% YTD 2025), so the S&P 500 will need to finish 2025 in impressive fashion to match the 2024 and 2023 S&P 500 returns. It is doable, but it needs good news. This past week has been heavy on bad news with a lot of uncertainty in coming weeks across the China trade battle, the shutdown, and the IEEPA SCOTUS decision to go along with a fresh round of 3Q25 earnings and guidance.
The year 2024 was Part Two of the best 2-year run in the S&P 500 since the late 1990s, so that sets a high bar for the Trump stock market (see Footnotes & Flashbacks: Asset Returns for 2024 1-2-25). The S&P 500 return of +25% for 2024 (26% 2023) will be very hard to match in 2025-2026. Trump says the US was a dead country just over 9 months ago, so that raises the stakes on hitting those marks while selling that story line.
The S&P 500 will need a very strong finish in 4Q25 to match those “dead” years of 2024 and 2023. The current economy is lagging on some key GDP lines and is well behind 2024 along the PCE line of GDP. As a reminder, PCE is 68% of GDP. The investment numbers in the GDP lines also do not match up with the “trillions in new investment story line.” Those investment “promises” still need to show up in the numbers. GPDI has been mixed (negative in 2Q25 final) with Equipment doing well in 2025 (tax bill helps) but Structures are weak. Intellectual Property has been doing well on the tech and data center boom while Residential struggles.
The most important GDP lines that move the needle are posting lower growth (PCE for Goods and Services) but often get clouded by the quarterly impact of lower imports that materially distort the headline GDP lines higher. We are unlikely to get the advance 3Q25 GDP numbers later this month as scheduled (see 2Q25 GDP Final Estimate: Big Upward Revision 9-25-25 ).
See also:
Mini Market Lookback: Event Risk Revisited 10-11-25
Credit Profile: General Motors and GM Financial 10-9-25
Credit Markets: The Void Begins 10-6-25
The Curve: Blind Man’s Bluff 10-5-25
Mini Market Lookback: Chess? Checkers? Set the game table on fire? 10-4-25
JOLTS Aug 2025: Tough math when “total unemployed > job openings” 9-30-25
Credit Markets: Cone of Silence Ahead? 9-29-25
The Curve: Easing Anxiety at Bat, Tariffs on Deck 9-28-25
Mini Market Lookback: Market Compartmentalization, Political Chaos 9-27-25
PCE August 2025: Very Slow Fuse 9-26-25
Durable Goods Aug 2025: Core Demand Stays Steady 9-25-25
2Q25 GDP Final Estimate: Big Upward Revision 9-25-25
New Homes Sales Aug 2025: Surprise Bounce, Revisions Ahead? 9-25-25
Credit Markets: IG Spreads Back in the Clinton Zone 9-22-25
Mini Market Lookback: Easy Street 9-20-25
FOMC: Curve Scenarios Take Wing, Steepen for Now 9-17-25
Home Starts August 2025: Bad News for Starts 9-17-25
Industrial Production Aug 2025: Capacity Utilization 9-16-25
Retail Sales Aug 2025: Resilience with Fraying Edges 9-16-25
Credit Markets: Quality Spread Compression Continues 9-14-25
Mini Market Lookback: Ugly Week in America, Mild in Markets 9-13-25
CPI August 2025: Slow Burn or Fleeting Adjustment? 9-11-25
PPI Aug 2025: For my next trick… 9-10-25
Mini Market Lookback: Job Trends Worst Since COVID 9-6-25