
Credit Markets: The Void Begins 10-6-25
Another week of escalating chaos in US politics and a shutdown, but all is quiet on the credit spread front.


The black hole of data makes facts disappear – a house specialty.
The minor compression in IG and HY for the past month is very close to the YTD spread tightening. IG is -6 bps tighter for 1 month and -7 bps YTD. HY is -8 bps for 1 month and -12 bps YTD. There were clearly some wild moments along the way with Liberation Day, but record index levels in equities and June 2007-type spreads for HY, with Oct 1997 area pricing for IG, signal some serious complacency.
The market behavior signals low expectation for macro shocks even if a correlation event in equities is always on the table. “Pricing to perfection” is an old cliche, but this time we can simply say “despite massive untested policy imperfection.”
The start of earnings season for 3Q25 at least will bring some tangible color to the macro level and “macro micro” level for industries in a market with such widespread lack of transparency from the shutdown and absence of data from the BLS and BEA.
We can all guess who is secretly happy about the lack of economic releases. The question is whether this will trigger Vought’s opportunity to bring the Project 2025 hammer down on BLS and BEA staffing, structure, and de facto ideological control. That could mean that facts are a function of need and the needs are set by “the leader” and not what is best for the markets.
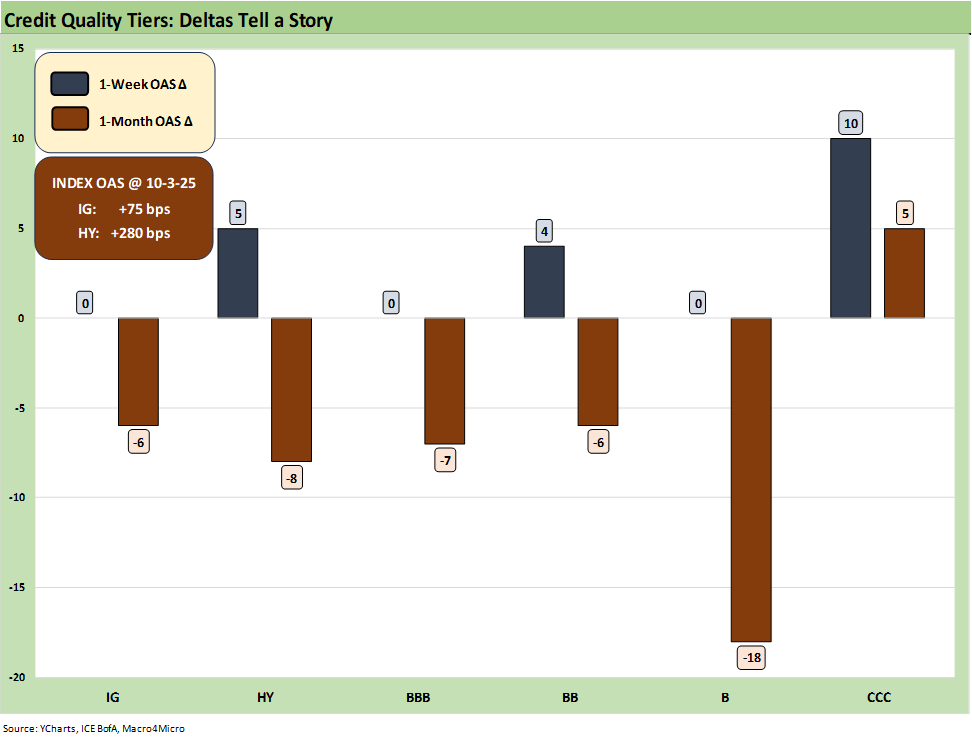
The above chart updates the 1-week and trailing 1-month spread deltas for IG and HY and from the BBB to CCC tiers. The risk pricing action on the week was negligible in the context of the critical juncture for Fed policy and accurate macro metrics. IG spreads were flat on the week while US HY saw slight widening of +5 bps. The 1-month spreads show a modest tightening for IG and HY. There has been little discernible spillover into HY from the private credit headlines that have sent BDC equities into a sell-off.
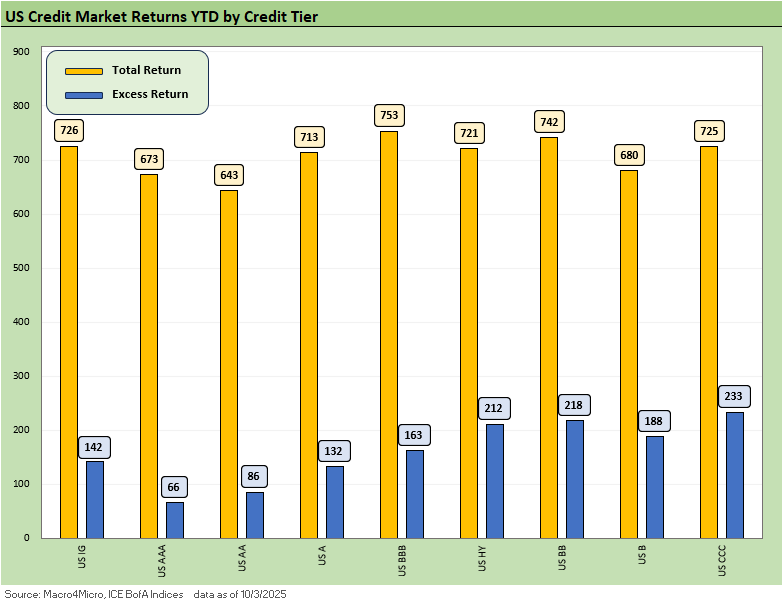
The above chart updates the YTD 2025 excess returns and total returns across IG and HY and the credit tiers. The support of the UST curve and spread compression is clearly reflected in the returns with the BB tier still the best positioned of the lot in the balance of credit risk and duration risk. The YTD excess returns were higher sequentially from last week for IG and essentially flat for HY.
The BB tier lost its lead this week for YTD excess returns to the CCC tier followed by the B tier. Credit has been delivering positive trends, but one can make an easy case that the risk compensation has played out more favorably in BBs for the risks being taken.
The CCC tier with its mix of coupons, spreads, and shorter duration has framed up well in the bar chart, but that begs the question of how much better the excess returns in the CCC and weak B range should be given the magnitude of the risks relative to the BBB and BB tiers. The risk-adjusted debate tends to get obscured by the discussion of what is the right metric to make that assessment. The BB tier is still the winner YTD vs. the B and CCC. Within IG, the BBB tier has been solid in both excess returns and total returns.
Note: The most recent data and related comments are in “Recent Trends.” We break out “Historical Context” sections in the Credit Markets and Yield Curve weeklies to roll forward the history and cyclical framework. We do that so new readers do not have to go fishing through links.
Recent Trends:
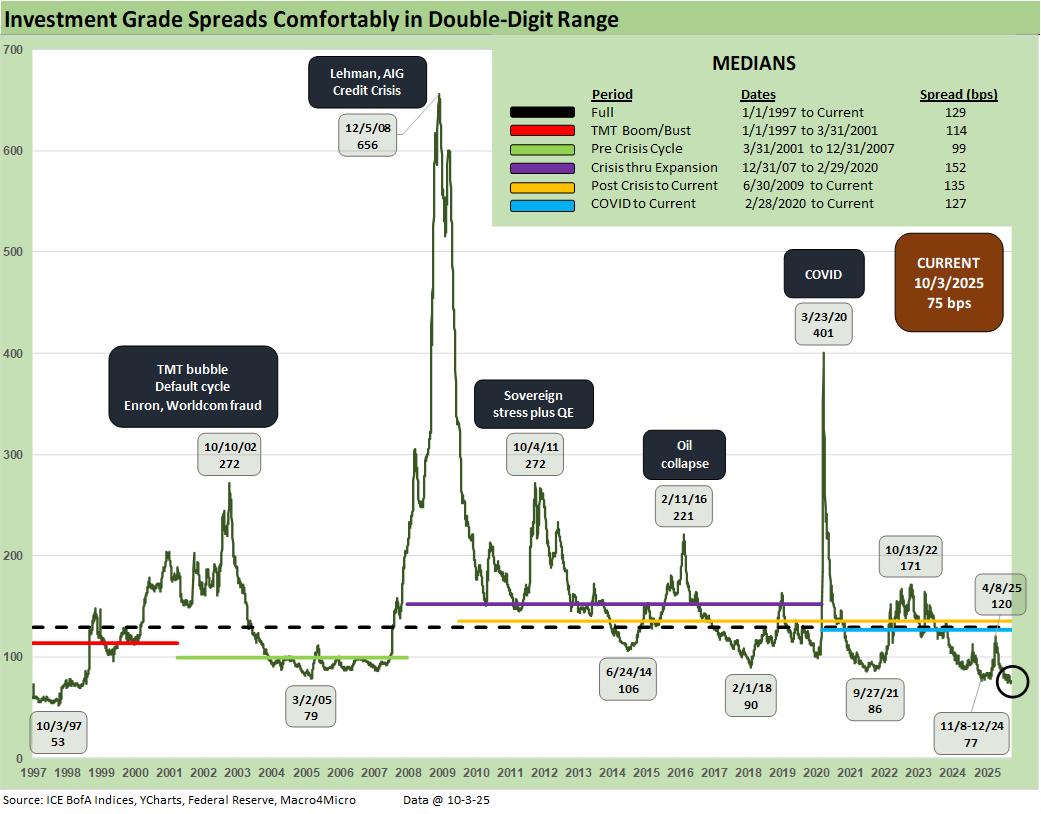
The IG market saw spreads flat on the week at +75 bps with BBBs flat and the AAA, AA and A tier composite only -1 bps. That was a very dull week. The total face value of the IG index is now almost $9.45 trillion with the most recent data showing the A tier edging ahead of the BBB tier in face value over the summer. The BBB tier is larger than France and the UK GDP but still a few hundred billion short of Germany.
Historical context:
The above updates the multi-cycle spread history for IG as we see the wild swings across time when the banks were in harm’s way in 2008 and the heavy exposure to energy names whipsawed BBB energy in 2015 and early 2016.
The current +75 bps remains below the tights of late 2024. IG spreads are below the March 2005 levels just before the auto OEMs started taking a lot of heat with a GM warning in mid-March 2005. There is no getting around the reality that IG spreads rarely get this low, but there is plenty of history where they were lower in the late 1990s.
The record lows since 1997 were seen in early Oct 1997 when that year saw a protracted stretch of 60-handle spreads. The market spent time in 1998 in the mid-70s range including the early summer. Life got ugly starting in Aug 1998.
That 1997 low of +53 bps came just before the Asian Yankee bond market started to implode, and the broader regional Asian crisis unfolded. Spreads in 1998 kicked into a correlated beatdown after the Russia default in Aug 1998 and did damage to other markets as a contagion effect hitting EM credit and US HY valuations. That was the summer and fall of LTCM after the Russian default of Aug 1998. Lehman also saw a mini-panic and funding crunch in the fall of 1998 that they got past quickly. CDS exposure and counterparty risk saw fleeting focus at the time.
Banks and financial services still an anchor today…
Critical drivers of IG spreads are always the banks and financials broadly at over ¼ of face value, and the major banks are very sound at this point compared to past recession periods such as Dec 2007 to June 2009, which was an epic meltdown for the banks and brokers. The securities firms ended up merging (BofA+ML, JPM+Bear) or essentially getting sold off in pieces (Lehman) or converting to Bank Holding Companies (Goldman, Morgan Stanley). The days of commercial paper funding of securities firms have given way to deposits, so there is also much less funding risk in the system.
The TMT bubble years of 2000-2002 is the stuff of legend. Earlier, the infamous 1980s LBO reckoning and the commercial real estate stress of 1990-1993 came not long after the thrift crisis and oil patch collapse slammed many banks and S&Ls.
The COVID crisis was a very different beast, but the market benefited from a well-positioned Fed with a crisis-period toolbox to pull out. How the Fed will be governed or legislated under the shadow Project 2025 priorities (see Chapter 21 and 24) will be a critical variable into 2026 when the new team is in place. What Trump wants to do with his loyalists at the helm is unclear except for the 300 bps (now 275?) in fed funds cuts he demanded and which he most definitely will not receive without a massive crisis in the markets (which would not bode well for his “clout”).
Recent Trends:
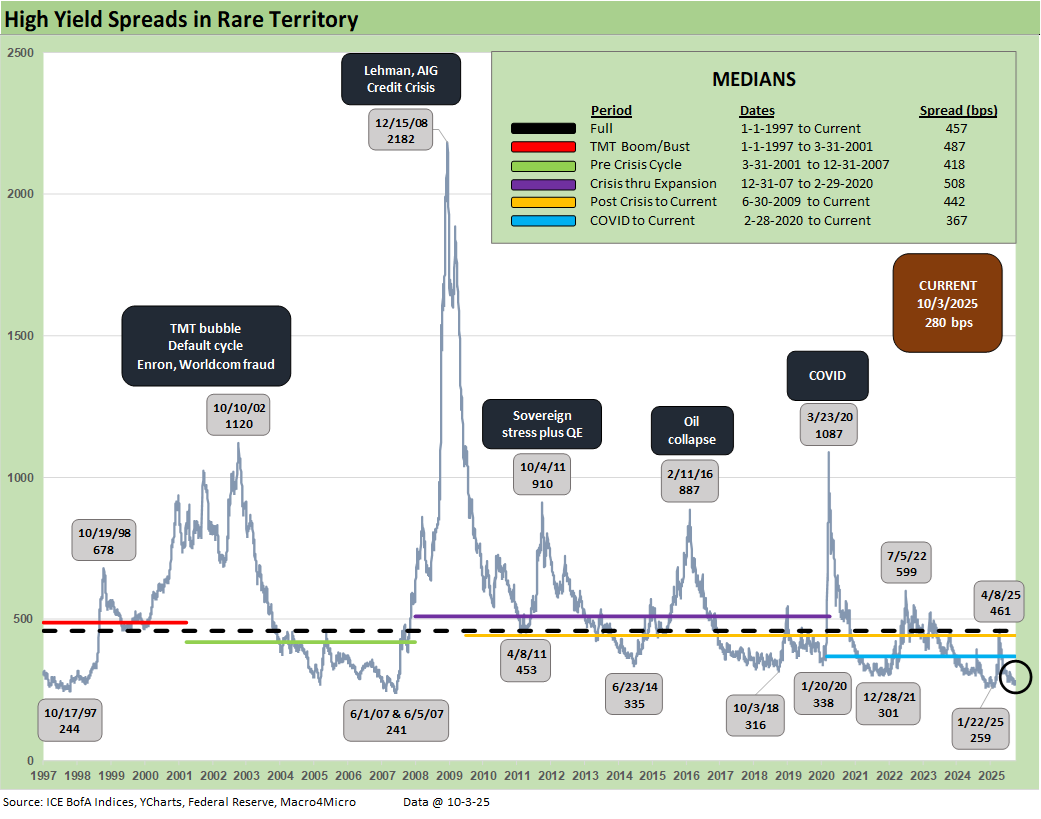
HY OAS saw a slight move wider by +5 bps which brings the YTD tightening to only -12 bps. The 1-month period has seen a tightening of -8 bps. We cover the credit tiers in more detail further below.
Historical Context:
The sub-300 bps HY OAS returned after the Liberation Day panic eased. The +280 bps is inside the month-end spreads of June 2007 even if wide to the HY OAS tights seen at the start of June 2007 (+241 bps). We also saw +244 bps in Oct 1997 for another Clinton memory lane moment to go along with the IG spreads hitting +53 bps in Oct 1997.
Today’s HY market presents a much healthier credit mix than in June 2007 when LBOs had gone off the charts and were partly funded with HY bonds. In the current market, those highly leveraged transactions have migrated over to private credit. That still means the +241 bps of early June 2007 is like a brass ring to HY funds today.
The HY bond index default cycle is very much in check. The distress and debt exchange actions will be weighed more heavily (and for the most part quietly) over in private credit as the year plays out. That said, we have two very noisy private credit situations (Tricolor, First Brands) playing out in the headlines in recent days with the potentially massive fraud chatter around Tricolor.
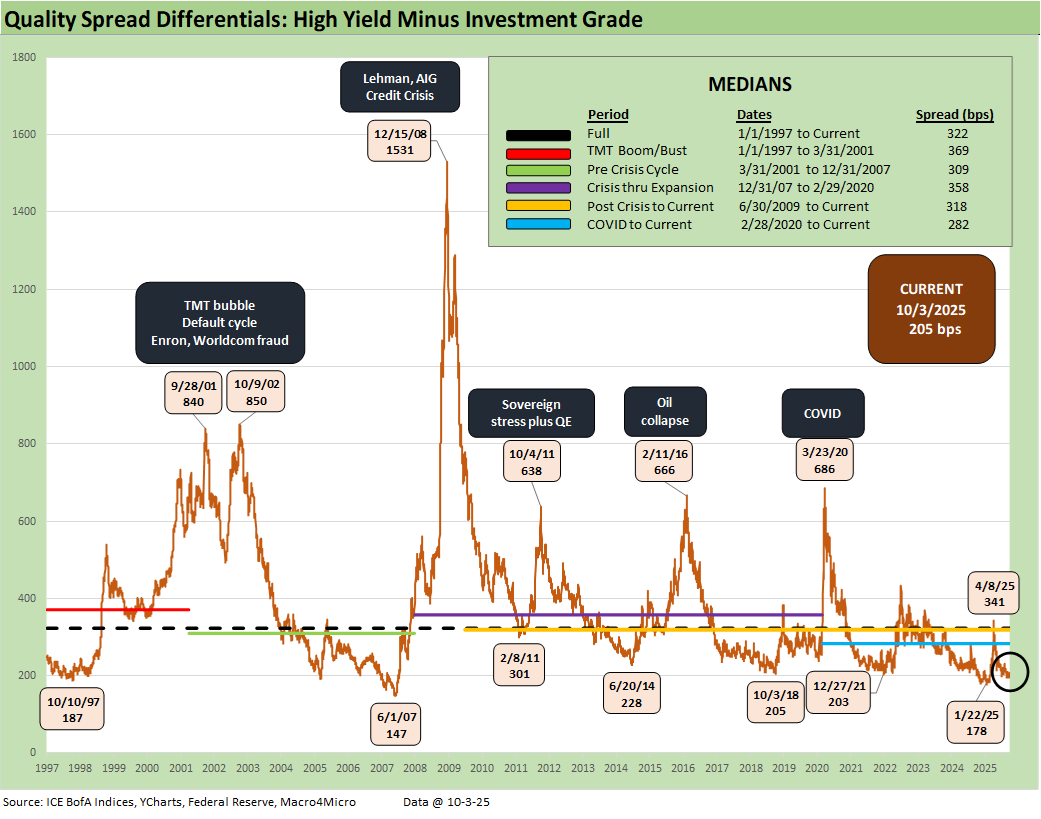
The “HY OAS minus IG OAS” quality spread differential of +205 bps is above the tights of +178 bps seen in Jan 2025 and materially higher than the +147 bps in June 2007. The +205 is more in line with credit cycle mini-peaks such as June 2014, Oct 2018, and Dec 2021.
We see the peak of +341 bps after Liberation Day vs. a long-term median of +322 bps. Most of the cyclical timeline medians noted in the box had 300-handles, so this trend overall highlights that quality spreads are offering low compensation for moving down the credit tiers.
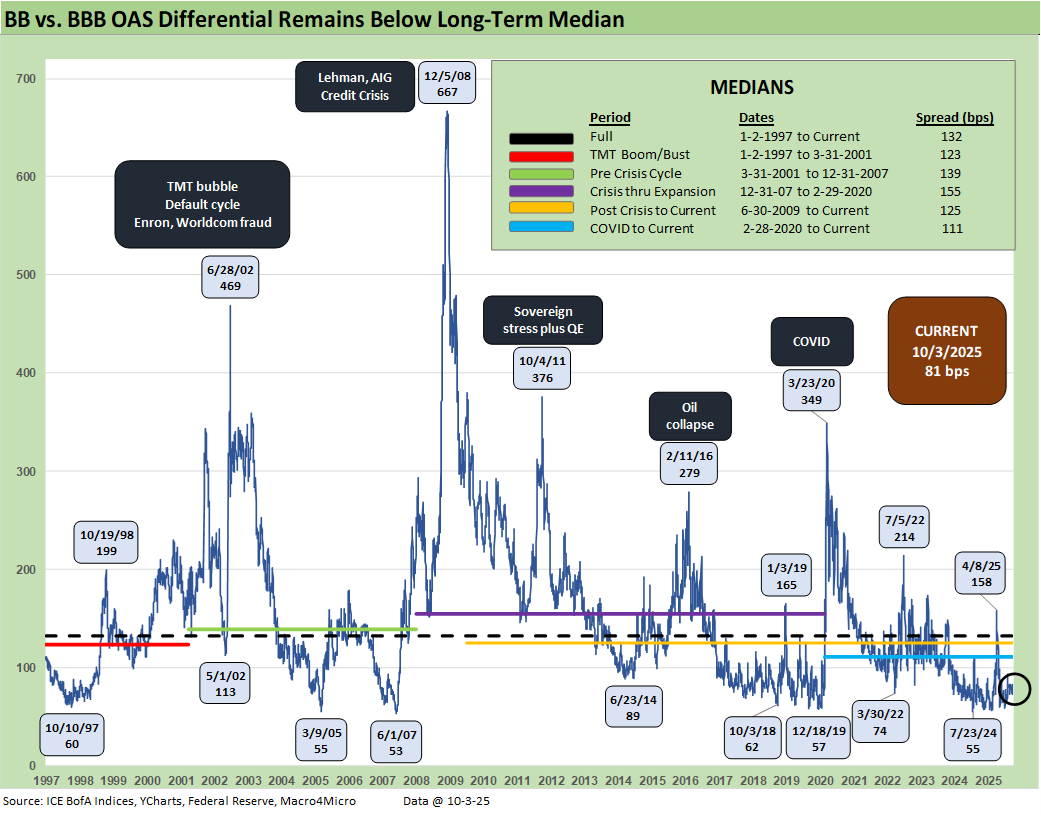
The “BB OAS minus BBB OAS” quality spread differential is back in double digits at +81 bps after spiking to +158 bps after Liberation Day. The long-term median of +132 bps is consistent with the median across the credit cycles detailed in the box.
The current cycle has routinely hit “lower lows” than the current +81 bps with 50-handles seen at numerous points. The record low tick was in June 2007 at +53 bps. The market has come close on numerous occasions from 2019 to 2024.
Recent Trends:
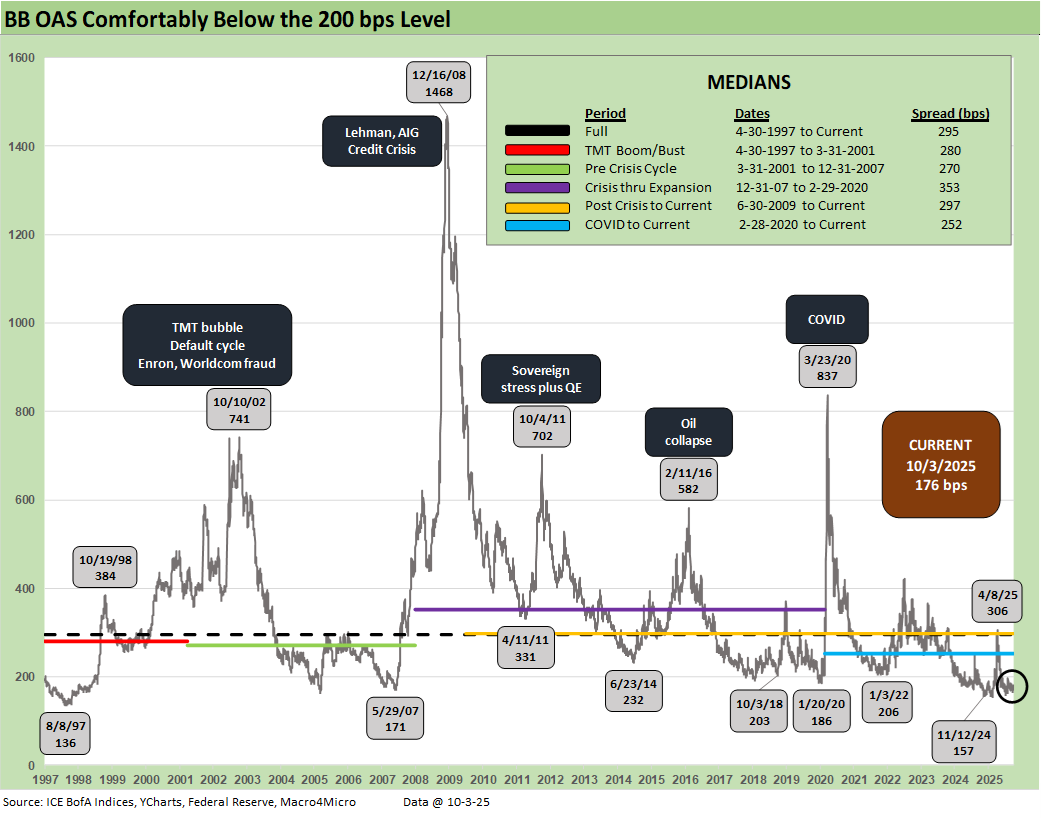
The above plots the time series for the BB tier across the cycles. The current sub-200 bps level of +176 bps is impressively tight and started chasing the Nov 2024 lows of +157 bps. The long-term median of +295 bps is in a different zip code.
Historical Context:
The demand for BB tier bonds has seen BBB buyers, HY lite strategies, and defensive HY funds all looking to this tier that ranks as by far the largest in HY. The strategy has worked as we covered earlier in excess and total returns across the tiers. The BB tier has been a good way to take credit risk while managing duration exposure and still carrying a respectable coupon.
Recent Trends:
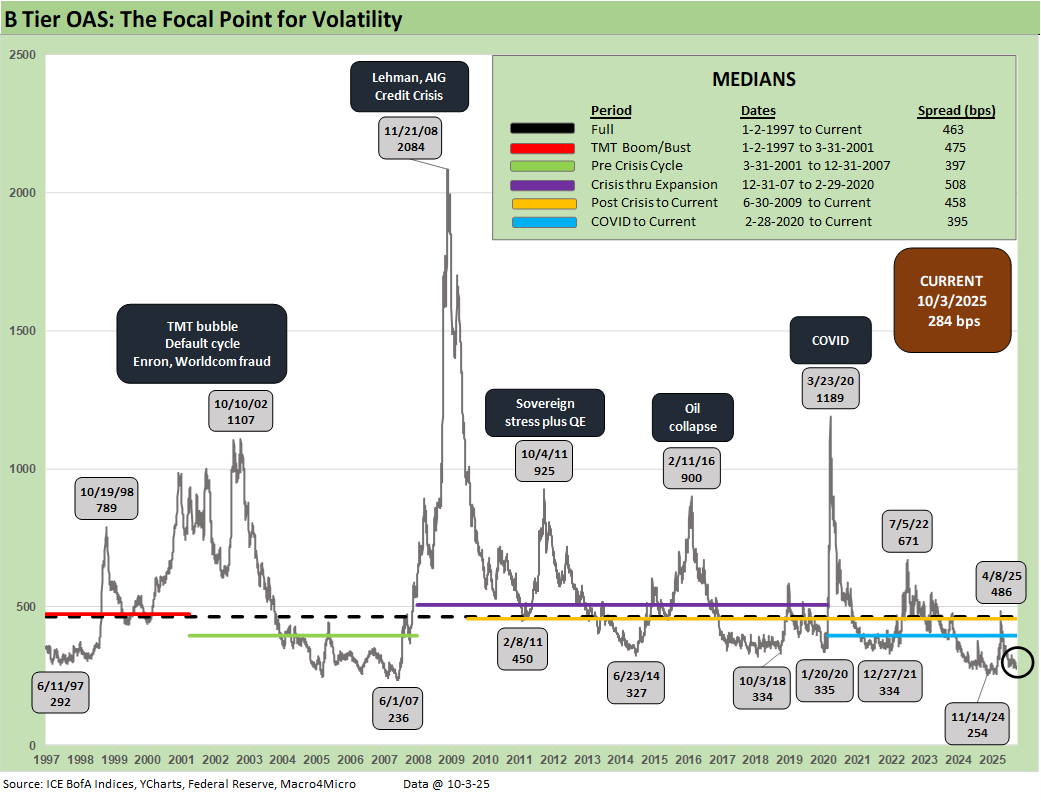
We see the current level at +284 bps back inside the +300 bps line. B tier OAS had reached a post-2007 low of +254 bps in Nov 2024 before the Liberation Day fallout in April 2025 drove the B tier OAS to +486 bps. The long-term median stands at +463 bps.
Historical Context:
The B tier is the sweet spot and home of the “HY Classic” investor. This current cycle’s median at +395 bps is the lowest of the mini-cycle medians presented in the chart. It is well below the mid to high 400 handles seen in most with the exception of the post-crisis (Dec 2007 to Feb 2020) median which crossed above the 500 range to +508 bps. The March 2001 to Dec 2007 (start of recession) median was just under +400 bps at +397 bps when the compression period from 1H04 to 1H07 pushed that timeline median lower.
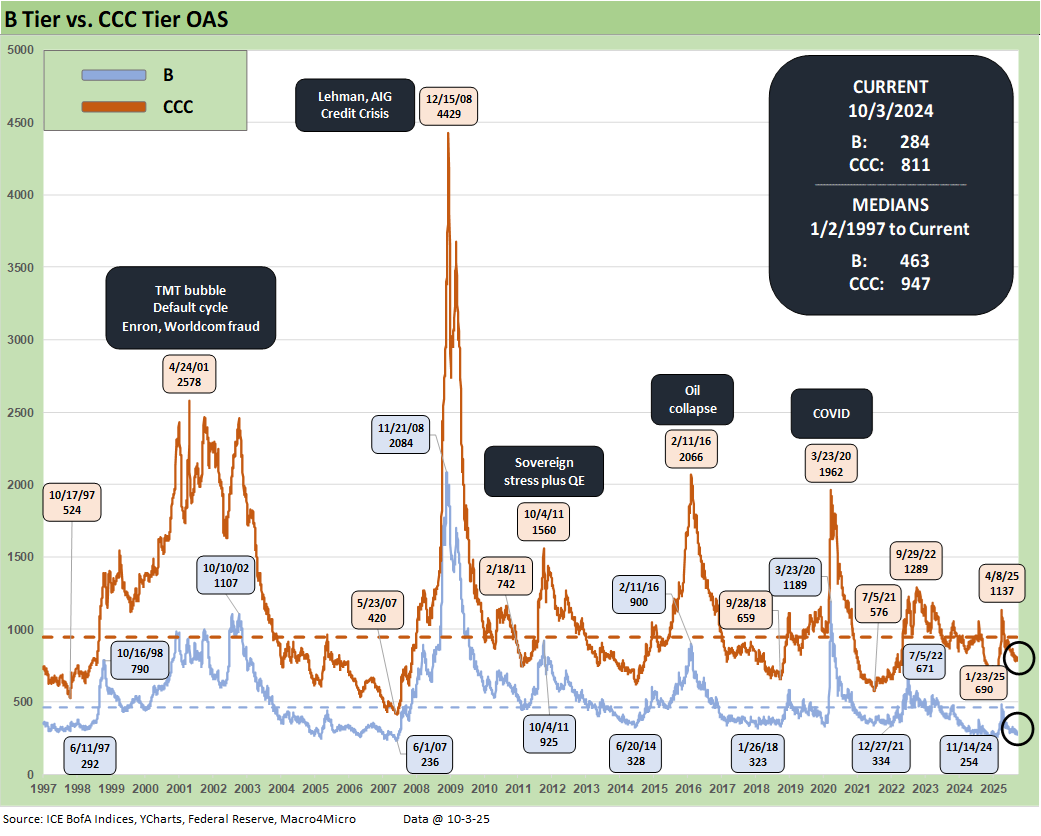
Recent Trends:
The above time series plots the wildest ride across the cycles seen in the B and CCC OAS levels. Both credit tiers are dramatically below their long-term medians. The B tier at +284 bps is well inside the median of +463 bps while the CCC tier at +811 bps is well below the median of +947 bps
Historical Context:
The post-crisis spread spike in Dec 2008 is ranked in a world of its own given the bundle of risks including a collapse of some market makers (and near collapse of others without Fed-engineered mergers) as well as evaporating secondary liquidity in the OTC HY bond market.
The TMT cycle default wave and secondary liquidity implosion saw multiple spread peaks in 2001 and 2002 that were especially ugly. Enron came in the fall of 2001 and WorldCom in the summer of 2002. IG spreads and BBB tier names also saw selective panic in the summer of 2002.
The sovereign panic of fall 2011 is in evidence as was the overexposure and E&P excess of 2015 to early 2016 on the collapse of oil and gas as the cash flow burn and valuation crisis dominated the upstream sector.
COVID saw a wave of supportive monetary policy and fiscal actions, so the energy sector HY crisis peak OAS in early 2016 was wider in spreads than those seen at the 3-23-20 COVID highs. In the case of the energy crisis, a major cross-section of the HY universe was driven by the same small group of risk factors in oil and gas prices and the recurring story of a collapsing borrowing base with the banks.
During COVID, the return to ZIRP and the “great reopening” of the economy and markets bolstered risk appetites and generated record refinancing and extension volume. In turn, that materially reduced refinancing risk (thus default risk) and lowered coupon costs from IG to HY. Household cash flow was also boosted on mortgage refinancing to record lows.
The ZIRP backdrop also eased ABS costs and bank line costs. Under some of the Fed legislation and control moves being discussed in the current market, that support seen in earlier credit panics would not have happened. If the Fed loses such tools, that would mean the White House would pick winners and losers (i.e. friends vs. enemies). Control of the Fed would offer the White House vastly more financial power than it has now to “influence” (intimidate? control?) borrowers and lenders alike.
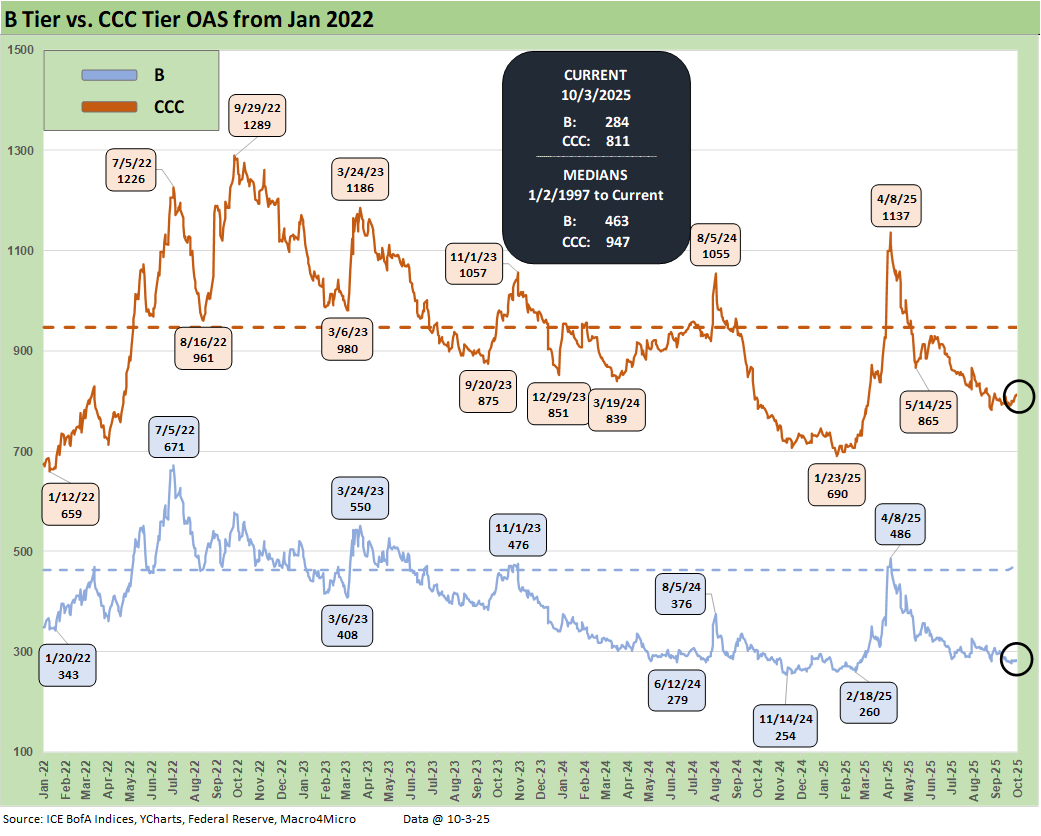
The above offers a more granular visual of the B vs. CCC OAS since the start of 2022 to get a read on how credit pricing moved across the tightening cycle on the way to easing mode.
The Russian invasion of Ukraine and resulting dislocation in energy markets was a major contributor to inflation that seldom gets mentioned in the political arena or by more partisan economists. Oil and gas prices were also major factors in the mix of 1973-1975 and 1979-1981 inflationary/stagflationary periods.
In the end, there was no recession in 2022 and no ugly default wave. Inflation and rates came down quickly from the June 2022 peak. CCC spreads peaked in Sept 2022 and B tier spreads in early July 2022. The inflation pain of 2022 too often gets sited without proper context around what is being “repaired” in 2025. Many of the talking heads have selective memories and seem to forget that headline CPI was 2.9% in Dec 2024. Trump has not driven inflation down since taking office. What he has done is create a new contingent concern around inflation from tariffs as well as disturbing supply and demand imbalances in key goods.
Progress in 2025 through August on CPI has been essentially nonexistent to this point. The noisemakers should ask themselves how inflation went so high by June 2022 and then came down so quickly. That is a natural extension of pondering where it goes from here – and why.
The supply-demand imbalances of 2021 should have been on the Fed’s radar screen and a bigger priority at that time. That said, the absence of discussion of Russia and oil/gas smacks of selective performance attribution and is both misleading and intellectually dishonest. We are seeing plenty of intellectual dishonesty out of the White House econ team today.
Recent Trends:
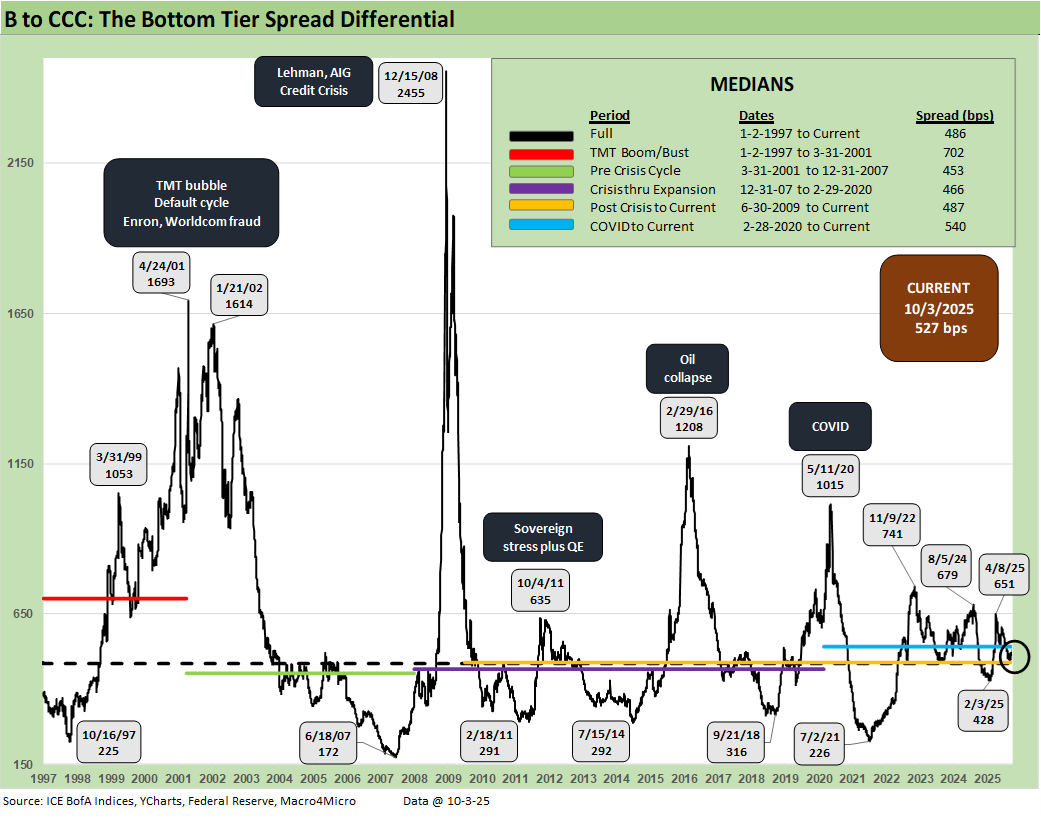
The quality spread differential between the B and CCC tier widened modestly on the week by +10 bps to +527 bps with CCCs moving wider by +10 bps and the B tier flat.
Historical Context:
The above quality spread differential for B vs. CCC tells a simple story. In times of macro stress, HY secondary liquidity panics (fear of fund redemption waves, etc.) and quality shocks where the HY index has industry concentrations (e.g. TMT, Energy), the CCC tier quickly sees credit risk turn into the equivalent of equity risk and even high-risk equities. That means bond pricing is expected to offer returns commensurate with that status. That is when the action is about dollar prices and not spreads.
Trying to gauge the credit risk, the default risk, the loss-given-default pricing component, the secondary liquidity penalty, the structural risks of the governing documents, and the recovery value and time horizon risks (30 days on CDS, post workout value upon emergence, etc.) is where the distressed debt commandos and seasoned vets come in.
The quantitative modeling of defaults can sometimes take on the nature of “weird science” or “fake science” while the classic distressed investor typically has the experience and legal inputs to navigate such markets. Assumptions can always be wrong, but there are histories and templates that those players tap into.
Recent Trends:
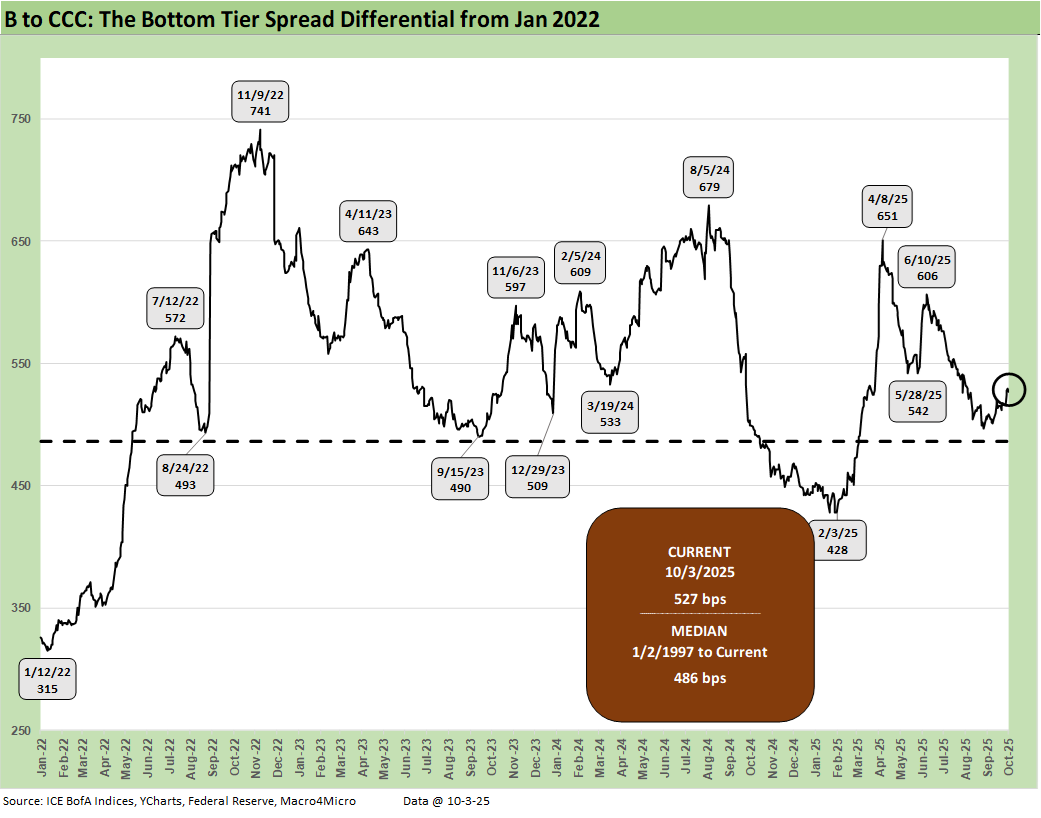
The above chart just shortens up the time horizon for the B vs. CCC quality spread differential history for the period from Jan 2022 through current times to capture the tightening cycle, the start of easing, and the new world of tariffs.
We see peak quality spread differentials at +741 bps in Nov 2022, up from +315 bps at Jan 2022. We are currently at +527 bps, above the long-term median of +486 bps. As a reminder, many market watchers were screaming recession in the fall of 2022. We did not see it that way (see Unemployment, Recessions, and the Potter Stewart Rule 10-7-22).
Historical Context:
Cyclical turning points? 2022 vs. today…
In the current market and the recession debate, we see a mixed picture. The fall of 2022 lacked serious payroll pressures, and we are seeing those now. We will see if that data flow gets choked off in the shutdown or radically reduced by The proposed new (and unqualified) BLS head was withdrawn as a candidate, and the shutdown brings new speculation that Vought (OMB head) and the Project 2025 playbook will use the shutdown to overhaul all of the data resources. That will impair economic viability and the ability to frame risks r Fed policy.
There was plenty to worry about back in 2022 and Russia-Ukraine was not helping on the front of cyclical optimism with an energy price spike. However, consumer spending was still solid, and employment was strong. The yield curve was of course a mess. That said, it takes a lot to cause a recession.
PCE and consumer spending was rolling along impressively in the fall of 2022. That has been under pressure in 2025 with PCE lines in the GDP account weak in 1Q25 and 2Q25 even after the sharp upward revision in the final estimate for 2Q25 (see 2Q25 GDP Final Estimate: Big Upward Revision 9-25-25). We are seeing some decent retail sales numbers along the way, and the latest PCE release on income and outlays was more constructive on consumer outlays (see PCE August 2025: Very Slow Fuse 9-26-25).
PCE inflation numbers remain well above target while CPI posted some warm numbers for August, but PPI offered some offsets (see CPI August 2025: Slow Burn or Fleeting Adjustment? 9-11-25, PPI Aug 2025: For my next trick… 9-10-25). We will not get updates for September at this point.
After the tariff legal decision on IEEPA in November, we believe economic risks will be lower if that Appeals Court decision can hold up against the SCOTUS “friends of Trump” (see Macro Menu: There is More Than “Recession” to Consider 8-5-25).
Last but not least, we saw solid earnings trends coming out of 2Q25 with constructive guidance. That could change in 3Q25 as the mix of factors and advancing stage of tariff effects get more weight. We also just saw a fresh wave of tariffs the past few weeks. We will soon be in 3Q25 earnings season with fresh color on tariffs and tariff cost mitigation strategies.
The questions around capex planning for 2026 will be interesting to the extent they even get answered this early. That might be a 4Q25 earnings guidance discussion. For those most exposed to tariffs and global sourcing, the IEEPA decision is critical. That will not be available except for (maybe) the late earnings reports. That decision will be available for the later retailer reporting season.
For now, the recession risk handicapping is a pitched battle. The mix of variables are worse in the fall of 2025 than 2022 with the exception of inflation (lower now). Short interest rates are lower now and heading lower. Jobs and consumer spending and corporate sector reinvestment and hiring are the main events, and labor will remain a weak part of the cyclical story. Consumer spending in the PCE lines of GDP is weaker now than in 2022 (and 2024) as is the employment picture. The small business sector is also weaker now on tariffs.
All in, risk premiums in credit are low, multiples are very high in equities, and the market is relying on Washington to not blow it all up. So far, we have avoided fully unhinged trade wars except a very brief one with China. Presumably, the shutdown will not do too much damage, or the market will need to react. If the shutdown brings a mass overhaul of economic data releases (BLS and BEA), then the market will know that there is serious trouble ahead for Fed independence.
See also:
The Curve: Blind Man’s Bluff 10-5-25
Market Commentary: Asset Returns 10-4-25
Mini Market Lookback: Chess? Checkers? Set the game table on fire? 10-4-25
JOLTS Aug 2025: Tough math when “total unemployed > job openings” 9-30-25
Credit Markets: Cone of Silence Ahead? 9-29-25
The Curve: Easing Anxiety at Bat, Tariffs on Deck 9-28-25
Mini Market Lookback: Market Compartmentalization, Political Chaos 9-27-25
PCE August 2025: Very Slow Fuse 9-26-25
Durable Goods Aug 2025: Core Demand Stays Steady 9-25-25
2Q25 GDP Final Estimate: Big Upward Revision 9-25-25
New Homes Sales Aug 2025: Surprise Bounce, Revisions Ahead? 9-25-25
Credit Markets: IG Spreads Back in the Clinton Zone 9-22-25
Mini Market Lookback: Easy Street 9-20-25
FOMC: Curve Scenarios Take Wing, Steepen for Now 9-17-25
Home Starts August 2025: Bad News for Starts 9-17-25
Industrial Production Aug 2025: Capacity Utilization 9-16-25
Retail Sales Aug 2025: Resilience with Fraying Edges 9-16-25
Credit Markets: Quality Spread Compression Continues 9-14-25
Mini Market Lookback: Ugly Week in America, Mild in Markets 9-13-25
CPI August 2025: Slow Burn or Fleeting Adjustment? 9-11-25
PPI Aug 2025: For my next trick… 9-10-25
Mini Market Lookback: Job Trends Worst Since COVID 9-6-25
Payrolls Aug 2025: Into the Weeds 9-5-25
 |
|