
JOLTS Nov 2025: Job Openings and Hires Down, Layoffs Lower
A major decline in job openings YoY and sequentially came alongside lower MoM hires but lower layoffs/discharges.


Job openings take some air out of optimism.
It is an easy call that November JOLTS constitute bad news with sharply lower job openings YoY (-885K) and MoM (-303K) with Hires also down MoM from Oct by -253K.
At least Nov layoffs were lower by -163K sequentially after an ugly Oct (see JOLTS: Goldilocks’ Ugly Twin 12-5-25) with most of the damage done in Oct and notably in Leisure and Hospitality. The biggest declines in layoffs were in the Northeast and Midwest regions.
ADP issued its Dec 2025 payroll report this morning as well but brought much better news than its abysmal Nov report. For ADP, private sector employment ticked up +4.4% YoY at +41K with the Mid-Atlantic and South solid but the West notably weak. Dec ADP saw a material improvement for small establishments (<50 employees) moving back into positive range at +9K after -120K in Nov.
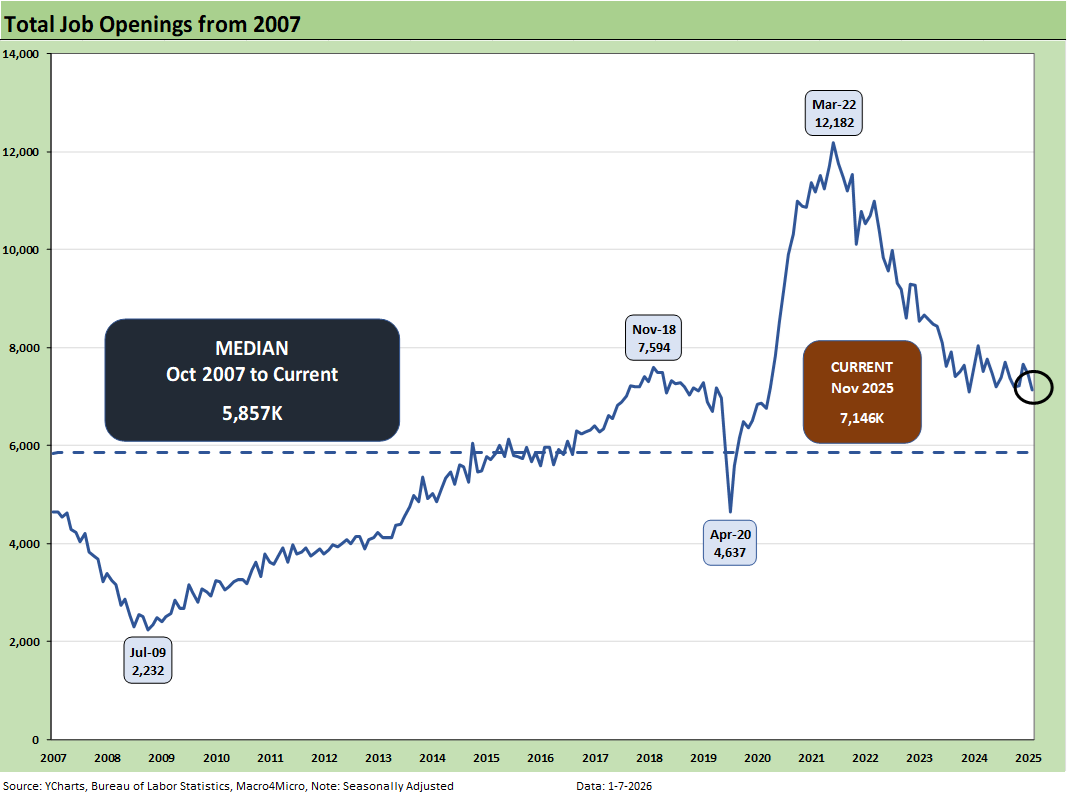
The 4.1% move lower in job openings to 7.146 million from 7.45 million amounts to a sharp -11.0% decline from Nov 2024, so that clearly is an unfavorable trend. The private sector was down by -214K with Government down by -89K or by -11.4% MoM.
Looking across the big MoM declines in job openings in the private sector, we see Leisure and Hospitality at -160K and Transportation, Warehousing and Utilities at -108K. State and Local was the big loser at -13.9% as both Education and non-Education openings were down by double-digit %.
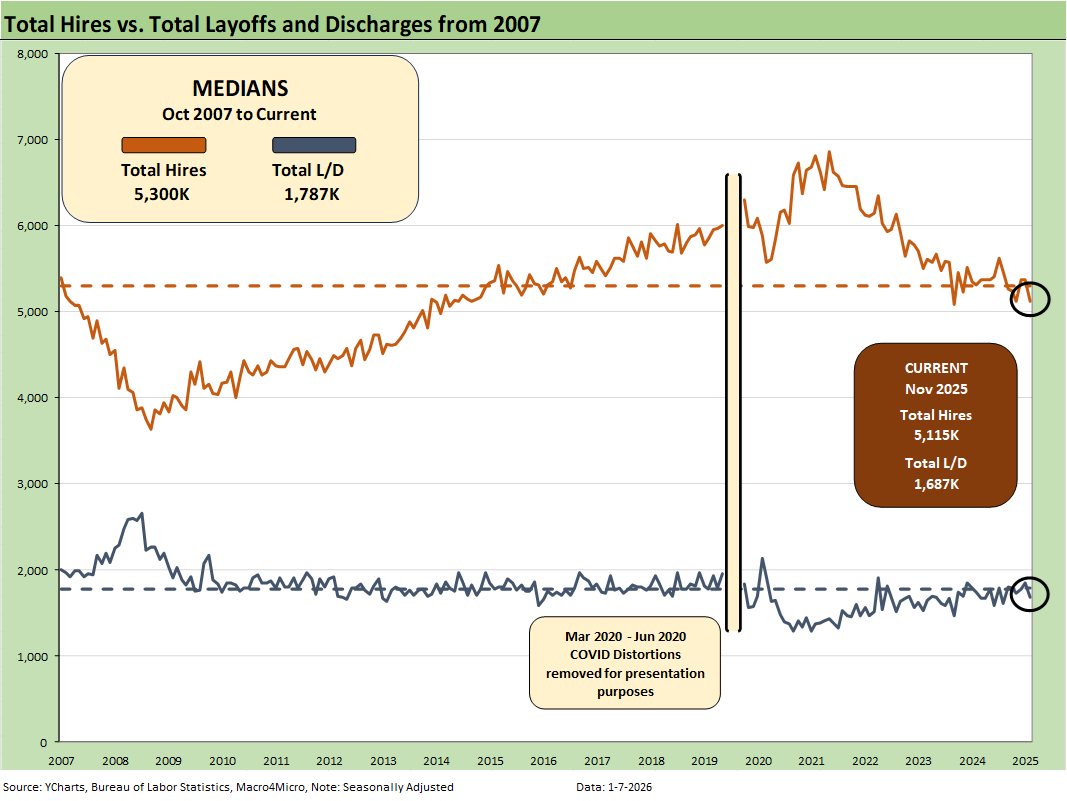
The above chart plots Hires vs. Layoff/Discharges on a SAAR basis. Note: we remove the COVID numbers from several charts to support the visual value for “normal” periods.
Hires declined by -253K sequentially from October while layoffs/discharges declined by -163K after rising in Oct. The hires YoY declined by -192K. The net numbers signal negative payroll trends.
The biggest declines in Hires occurred in Health Care and Social Assistance (-76K). The biggest decline in layoffs was Leisure and Hospitality at -91K. Professional and Business Services saw the biggest increase in layoffs at +57K.
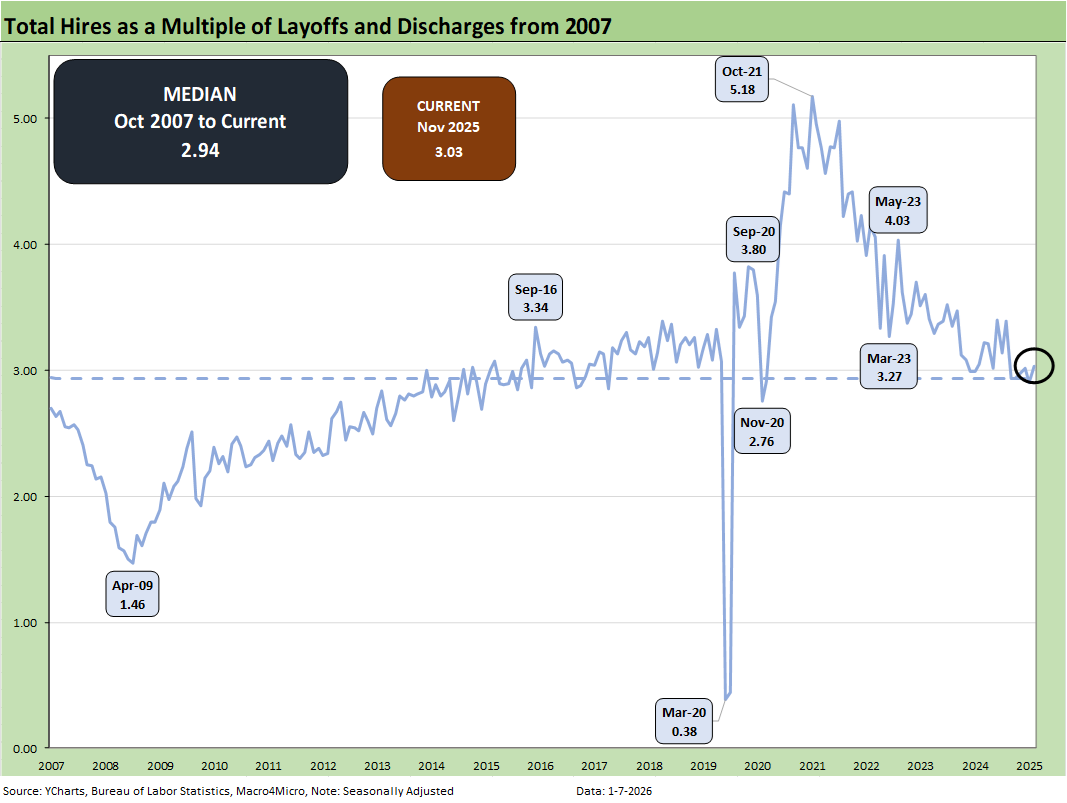
The above chart updates the ratio of Hires to Layoffs/Discharges. The relationship moved higher this month to 3.03 from 2.97, or just above the long-term median of 2.94 from 2007. The post-2007 period includes the longest recession since the Great Depression (Dec 2007 – June 2009) followed by the longest expansion from June 2009 to COVID (Feb 2020).
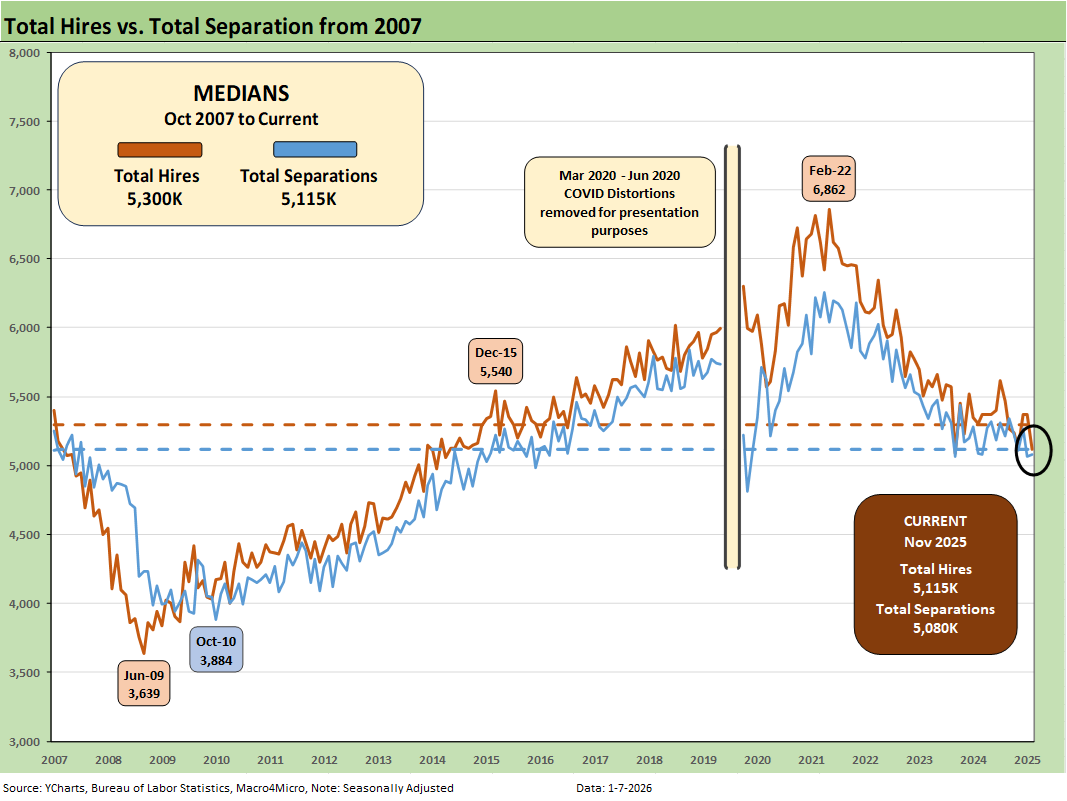
The above chart plots Hires vs. Total Separations on a SAAR basis. Separations include Quits, Layoffs/Discharges, and “Other Separations.” Total Separations edged higher by +11K in Nov from Oct and were near flat at +7K YoY. We typically do not find “Total Separations” particularly interesting as a multi-line net number.
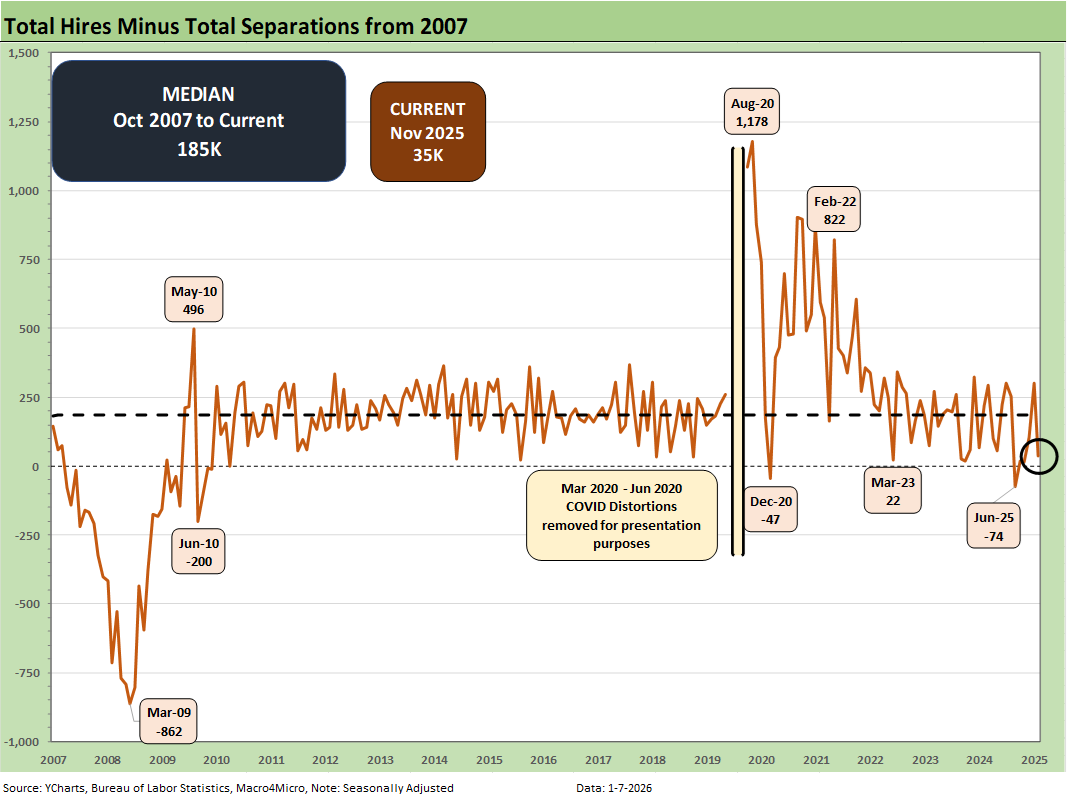
The Hires minus Total Separations differential is plotted above. We recently had some major revisions. Layoffs/Discharges for June had been revised upward by 192K, so that offers another negative data point in payroll. The net number above has moved notably lower in recent months before the bounce back to 99K in Oct before dipping to 35 in Nov. The differential is well below the long-term median of +185K. The current differential is a weak number.
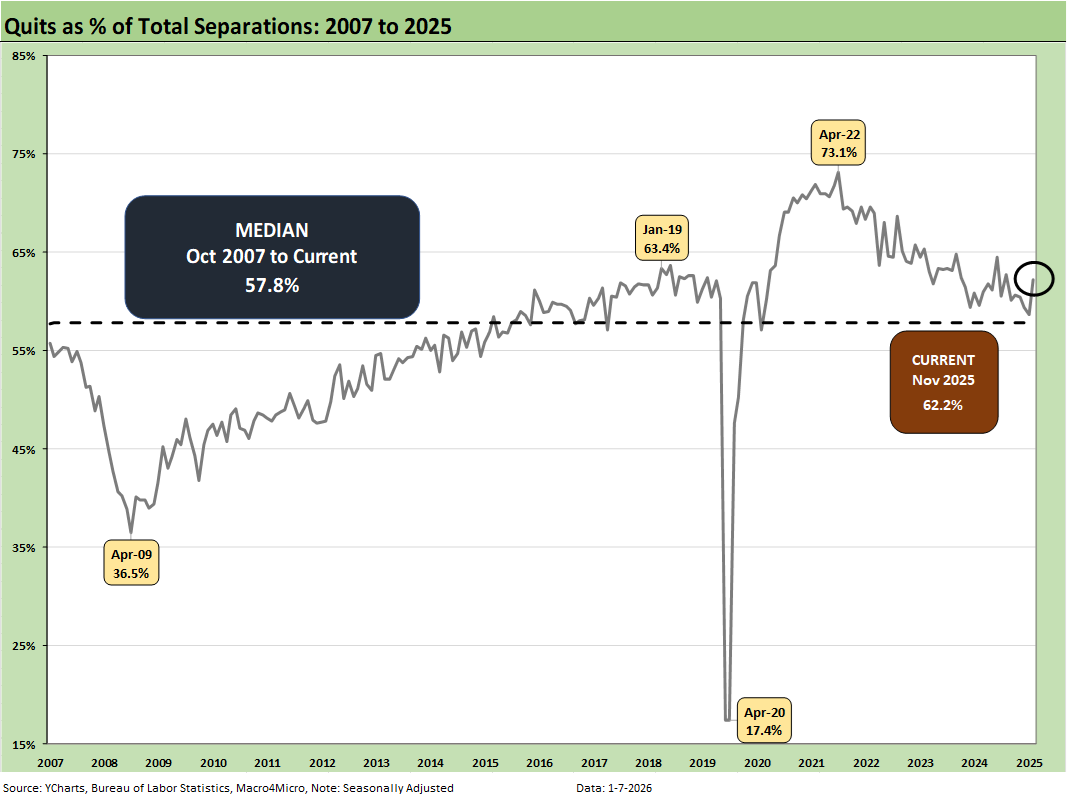
The time series for Total Quits as a % of Separations (SAAR basis) moved higher to 62.2% from 58.2% and is above the long-term median of 57.8%. The classic “Quits Rate” is measured by Total Quits as a % Total Employment, and that metric moved higher on the month to +2.0%, up from 1.9%. The Quits rate is up slightly YoY from 1.9% to 2.0%.
The bottom line on JOLTS is that it continues the steady stream of signals that point to softening payroll. That is likely to arm the FOMC with more easing ammo but only if they get more comfort around tariffs and the price impact on goods.
So far, CPI and PCE have not been overly cooperative (see November CPI: Tricky Navigation 12-28-25, PCE, Income & Outlays: Calendar Gap Closing 12-5-25). Today, FedWatch was at just under 89% probability of “no change” for the upcoming Jan Feb meeting and over 55% probability of “no change” for the March meeting.
NOTE ON COVID DISTORTIONS
The Hires vs. Separations time series make for interesting numbers but tough charts to plot visually given how much the spike in Separations/Hiring during COVID distorted the numbers from March 2020 to June 2020. The swings literally were off the charts. For presentation purposes, we adjust the charts above to exclude the raw data for those months to get a better vantage point on somewhat more normal times. Compared to COVID, the credit crisis seems “normal” in terms of the job count moves.
For disclosure purposes, Separations across March 2020 (16.3 million), April 2020 (11.6 million), May (4.7 million), and June (5.2 million) were running against Hires in March (5.2 million), April (4.0 million), May (8.1 mi/lion), and June (7.4 ml/lion). We remove those from the charts to get better scale visuals on the periods that precede and follow as the market saw 50-year lows in unemployment in 2022. Wild swings were had by all as industries saw shutdowns and layoffs in the COVID recession. The long-term medians from 2007 to 2022 for Hires and Separations were very close.
Almost 28 million Separations combined in March-April 2020 was a brutal reminder of that period.
See also:
Payrolls Nov 25: Into the Weeds 12-16-25
Employment Nov 2025: Bad News is Bad News 12-16-25
JOLTS: Goldilocks’ Ugly Twin 12-5-25