
Payrolls Dec 2025 and FY 2025: Into the Weeds
The December nonfarm payroll continues the theme of cyclical weakening in the labor market with very unfavorable breadth.


The world is still darker in manufacturing in weak 2025 payrolls.
December marks a cleaner read into the labor market as the shutdown distortions fade. Headline payrolls rose +50K, which leaves the trailing three-month average of new job growth at -22K given the October decline. After stripping out the Government activity, we see private sector growth at a dismal +29K trailing three-month average. The headline reaction was “weakest year since 2020.”
Goods-producing categories were soft, and the headline total of +50K is still carried by a narrow set of services that offer lower economic multiplier effects. Manufacturing was down again at -8K for the month and down by -94K YoY. Construction was down on the month by -11K but up +84K YoY. In Dec, construction of buildings was down but nonresidential specialty trade contractors was down the most within the group. That combination of numbers does not signal a reshoring or onshoring wave – yet.
Within the private sector, leisure and hospitality (+47K) and healthcare & social assistance (+39K) were major gainers and retail trade (-25K) and construction (-11K) were the major drags. December saw continued weakness in cyclicals and this indicator of labor market health still points to a late-cycle dynamic.
Ending the year on a soft note leaves 2025 at +584K payroll adds on the year, with the healthcare & social assistance industry contributing +713K. Of the 18 major categories we track, 2025 saw 6 positive, 10 negative, and 2 flat. The breadth of the job market increasingly points to a very narrow concentration of growth. That remains a key challenge for 2026.
Stepping back, the overall context of the employment print gives cover for both sides given the slight improvement to unemployment metrics. As far as Fed calculus goes, we do not see the report changing much with a pause looking likely in January and markets awaiting clarity on the next Fed Chair. As of Friday, FedWatch cited market odds of 95.6% for no change this month. Meanwhile, the chance of no change in March soared to 71.3% from under 50% a week ago.
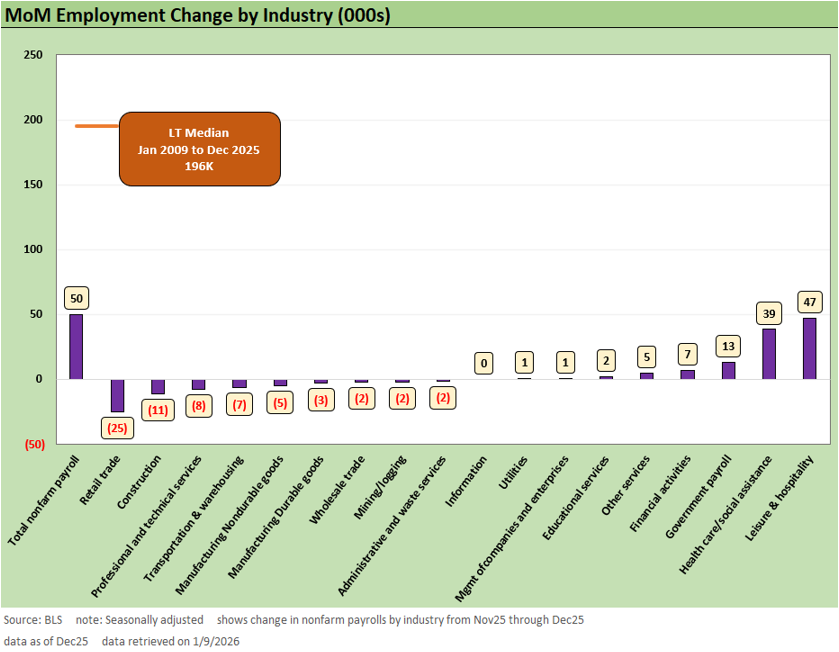
The above shows the December MoM employment change with another soft month characterized by very few drivers of growth. December is pretty much a two-sector story with healthcare & social assistance (+39K) trailing leisure & hospitality (+47K) adds this month. The breadth of the labor market remains narrow as December notched a very weak month for goods-producing categories. Durables and Nondurables were both negative for the month, so the manufacturing golden age certainly is not evident in the payroll counts.
We see the declines in retail trade (-25K) and transportation & warehousing (-7K) in contrast to the stronger leisure & hospitality trend. Though consumption and spending held up across the year in retail sales releases, the National Retail Federation reported a softer start to the holiday season, we await the key retail reporting season for earnings after January.
The payroll activity above signals that the trend may have held up well enough in December to push back on cyclical bears. The pullback in staffing activity can be read as a response to lower demand expectations. On the other hand, the bounce in leisure & hospitality leaves open the possibility that this is more about shifting demand on where the consumer spends their dollars.
Overall, the above continues the trend of the past few months even if the market was mired in shutdown distortions. A narrow set of services continues to prop up low payroll growth with a few bright spots as manufacturing continues to struggle.
The jury is still out on how many jobs AI has already displaced, but the recent payroll trend appears to reflect late cycle caution. Wear and tear from tariff impacts and sustained low confidence combined with sustained policy uncertainty has left employers and employees in a lower risk-taking mode that is showing up as much more defensive behavior.
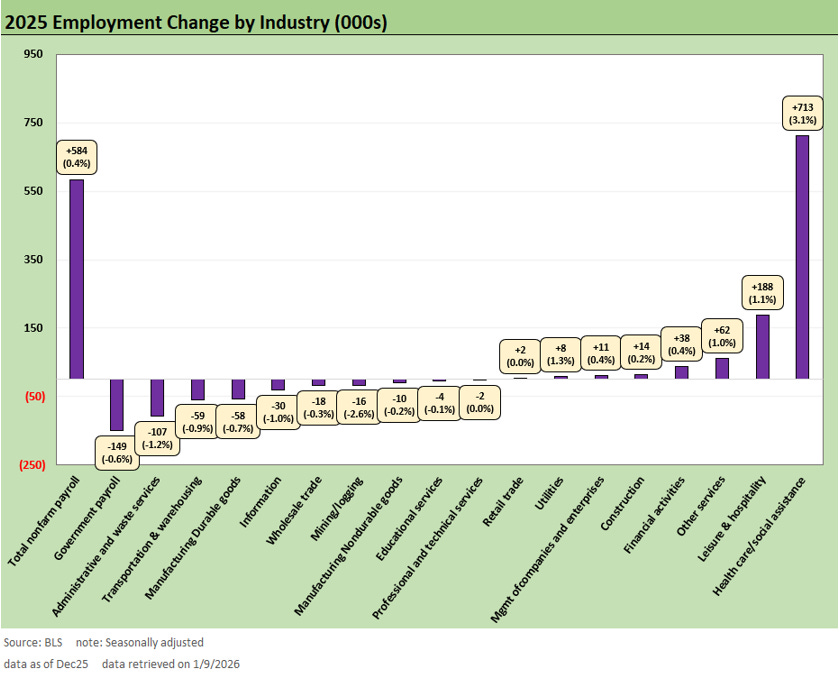
The total changes across the board for 2025 are shown above. This chart makes the concentration this year very clear, especially comparing the +713K healthcare & social assistance to a +584K annual total. The negative side sees Government at -149K total in 2025 after the -174K single month decline across the October shutdown month. The more cyclically relevant signs sit in administrative and waste (–107K), transportation and warehousing (–59K), and durable manufacturing (–58K). Those categories map closely to staffing flexibility, goods flow, and factory demand with weakness contrary to the broader positive economic story elsewhere.
Healthcare should continue to be a key driver for 2026 payroll growth based on demographics. However, we wonder about the sustainability of the pace of growth given several variables. First, the fate of ACA subsidy extensions remains uncertain. AI could also be a significant factor in streamlining efficiency and thus undermine payroll.
Since Jan 2020, healthcare has grown just shy of 3 million jobs, but the pace of healthcare adds is starting to slow. With the rest of the private sector labor market showing minimal growth, 2026 is facing a challenging environment.
Into the Weeds…
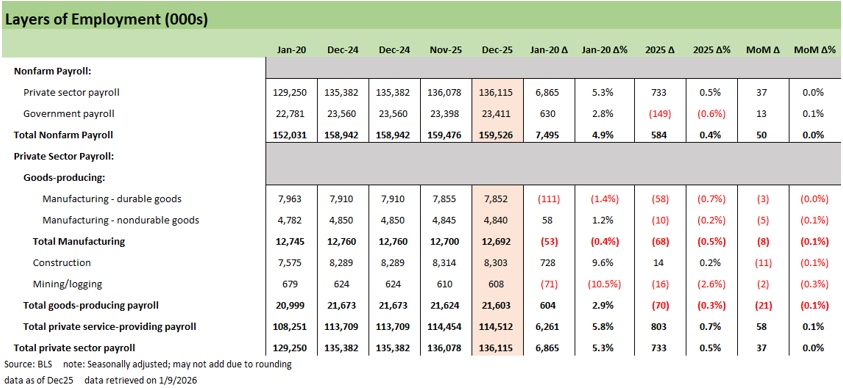
The above chart provides the big split across private vs. public and services vs. goods-producing. The Private services category remains the primary driver of job growth in the US, while goods-producing remains under pressure with 2025 only seeing Construction experiencing some incremental growth. Government came back as positive this month but the overall 2025 is deeply in the negative across DOGE and shutdown activity that was offset by state and local hiring.
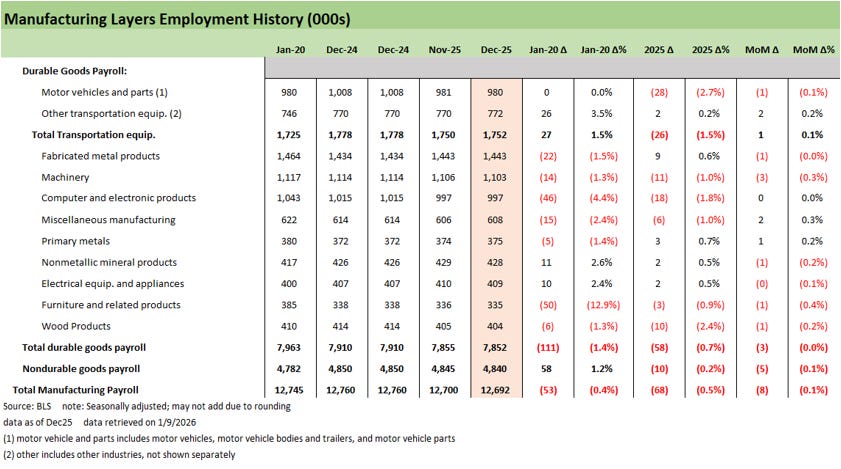
The manufacturing payroll mix is shown above. We see mixed results leading to -8K lower this month split across -3K durables and -5K nondurables. We focus on the durables details above with weakness for December spread across some larger core industrial areas in Fabricated metal products and Machinery. Motor vehicles and parts were down by -28K in 2025 and slightly negative in December.
Given the policy focus on reshoring manufacturing this year, the early results continue to signal how daunting a challenge that will be. Instead, a year with a -58K decline in durables goods headcount is much more in line with the broader manufacturing decline faced in past years.
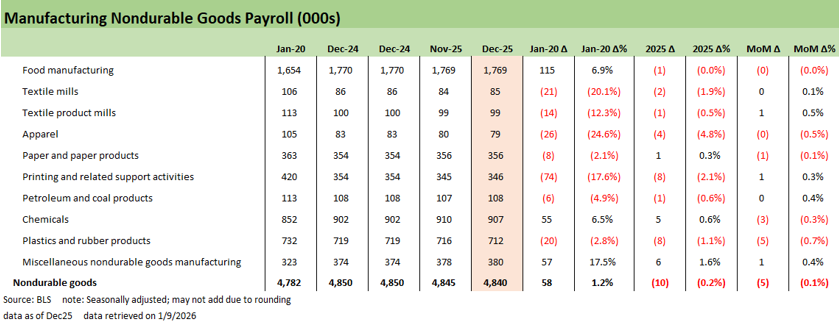
Nondurable manufacturing activity posted a typical mixed bag of results with relatively large declines across chemicals and plastic & rubber products. The above lines are not the growth engine of the manufacturing base, but there are some key support sectors. The -5K decline in December and -10K in 2025 continues the slow bleed trend in these areas with only Food Manufacturing and Chemicals in positive territory across longer time horizons.
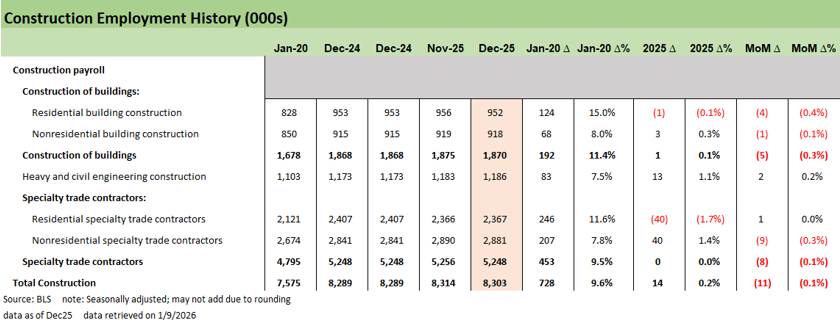
Construction has been a relatively bright spot for goods-producing industries across 2025 given a surge in data infrastructure buildout supporting the nonresidential numbers above. For the month of December, Construction declined -11K, leaving the full year 2025 results up +14K. The 2025 mix shows growth heavily slanted towards the nonresidential specialty trade contractors (+40K) and heavy & civil engineering (+13K) as total residential construction above saw a -41K contraction.
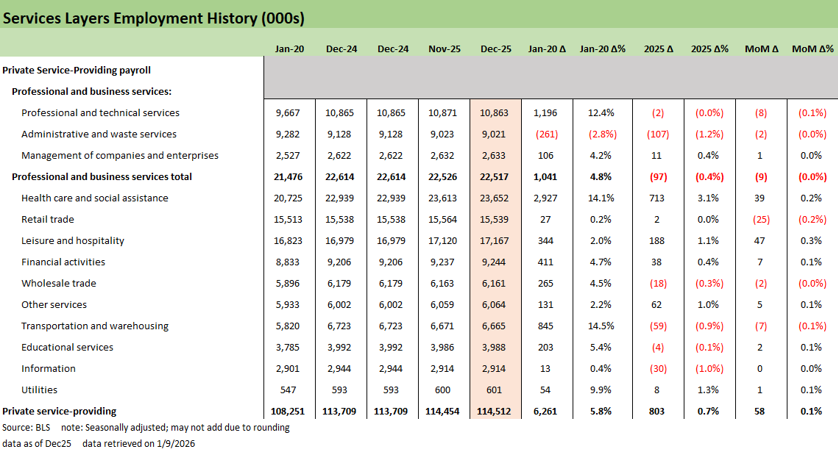
Services payroll numbers are still the core of the report from a gains perspective. This month healthcare shares the spotlight with leisure & hospitality. As we covered earlier, a stronger leisure & hospitality performance (+47K) contrasts with declines in retail trade (-25K) and with transportation & warehousing (-7K) overall providing some mixed signals.
There was not a lot of movement across other services categories in what was a fairly mixed December print. As we have tracked across the year, the rest of the Services sector saw very few sources of meaningful growth and both administrative & waste services and transportation & warehousing saw notable declines. Given the significance of services for the broader employment picture, watching these trends into 2026 will be key for the labor market picture as more cyclical lines continue to drift lower.
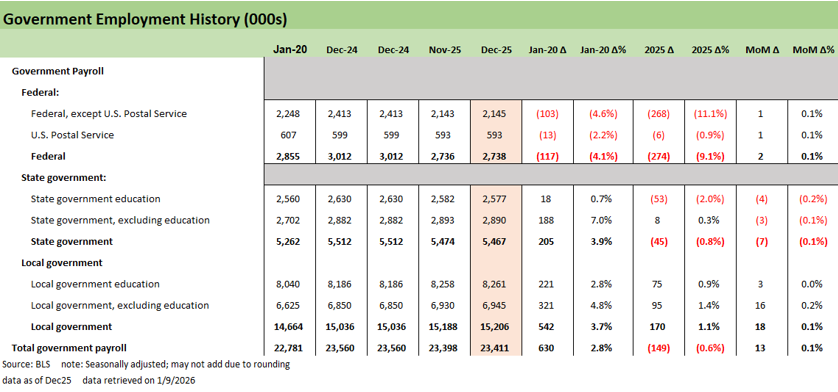
Finally, the Government lines above show the major shutdown distortions from the October numbers with Federal down -274K for 2025. Local hiring saw continued growth to the tune of another +18K more jobs added in December. Prior to October, local hiring had acted as a counterbalance for the sizable Federal cuts though now the year ends with Government hiring down -149K.
In the end, the practical way to look at this report is to exclude these government lines, as the cyclical signals are elsewhere and the shutdown numbers act as more of a mental adjustment for a while in framing YoY and running trendlines in historical context. That said, government retrenchment in payroll will flow into GDP lines depending on government consumption and investment. Many of the people are gone and more than a few department and agencies gutted or shutdown.
 |
|