
Existing Home Sales Dec 2025: Getting up off the Mat?
The existing home sales numbers end 2025 on a positive note with mortgage rates back around the Sept 2024 lows.


A few more rounds of lower mortgage rates would offer a second wind.
Dec 2025 existing single family home sales volumes hit the highest level of the year on the back of a strong performance in the South region, which comprises around 47% of the total for US. Total existing homes also hit a high with condos short of a high point.
Sequential inventory declines were meaningful at -18.1% for existing overall and -14.4% for single family. Inventory deltas whether up or down can be good or bad depending on the underlying drivers, and this current move reflects favorable sales trends.
The next leg into the spring will determine if affordability trends on monthly payments can get a more sustained recovery underway and generate some multiplier effects along the housing chain and related service industries.
The overriding variable is the direction mortgage rates and whether better consumer confidence could drive more activity and close the “bid-offer” gap in pricing expectations vs. reality. The market needs more first-time buyers. Rising existing home sales volume could benefit move-up trades in both new and existing home sales.
The rise in volume came alongside a small MoM decline in median prices for total existing to $405.4K, which is the lowest since March 2025. Single family prices also dipped sequentially to $409.5K, the lowest since March. The year 2025 began with single family prices at $398K in Jan 2025 after $408.5K in Dec 2024 with an asterisk for mix shifts by region and price tier.
The above chart shows the sales volume deltas by price tier for Dec 2025, and we see 5 of the 6 price tiers posting growth with only the $0 to $100K bucket in the red. That lowest price tier is 5% of industry sales. We look at this price tier mix from a different angle in the final chart in this collection.
With the Dec FOMC cut of -25 bps coming on the heels of the Sept and October actions, mortgage rates had been stubborn until this most recent rally even if still hovering in the low 6% area. The Freddie Mac 30Y benchmark released on Thursday hit the lowest level in over three years at 6.06% vs. 6.16% last week and 7.04% at this time last year (Source: Freddie Mac).
The three cuts in the fall of 2025 (-75 bps) followed 3 actions (50, 25, 25) in the fall of 2024 translated into UST curve steepening. Back in the fall of 2024, the UST rally along the curve saw mortgage rates right around today’s level after easing while the 10Y UST dropped down to around 3.6%. That soon gave way to a steepening and tough road for mortgages into early 2025.
Those expecting the 10Y UST to follow fed funds lower have been relatively disappointed since the easing cycle got underway, so this latest move lower sets off a fresh debate with the main question being “Will it translate out along the curve?” and allow mortgages to be more supportive and move down into the 5% handle zone.
UST steepening threats…
The threat of UST curve steepening and pushing rates higher in the long end in 2026 is not gone (see The Curve 12-15-25). That is especially the case given stubborn inflation and the gradual increase seen in numerous product groups in the CPI report. Headline inflation in December was somewhat of a nonevent with some product lines worse and some better but lower at the headline level (see CPI Dec 2025: Sideways Calms Nerves – For Now 1-13-26).
The risk of potential pressures on the long end has been beaten to death as a topic with supply-demand imbalances on record UST supply, record deficits, and the threat of Trump’s desire for negative real fed funds rate (below 1% fed funds vs. mid to high 2% inflation). The scenario is that negative real fed funds could set off fresh inflation pressures and undermine demand for duration. The increasingly toxic geopolitical backdrop could provide catalysts for pushing back on supporting the dollar and the UST as the holding of choice.
The Greenland insanity from Trump has caused EU and NATO nations to send troops to Greenland. Today Trump threatened them with more tariffs if they oppose. Many cannot step back from partisan “check the box” thinking, but this Greenland gambit is perhaps the strangest thing from Trump. Those of us who grew up around WWII and Korean War vets in the Cold War have a hard time with such reckless disregard for alliances and national security.
On the yield curve threat and macro risks, these “former allies” know their “weapons” are trade and UST holdings. These are amorphous risk variables and more about game theory uncertainty, but they are very real threats. The attacks on the Fed and attacks on allies are not risk free. For housing, steepening could send mortgage rates in the wrong direction.
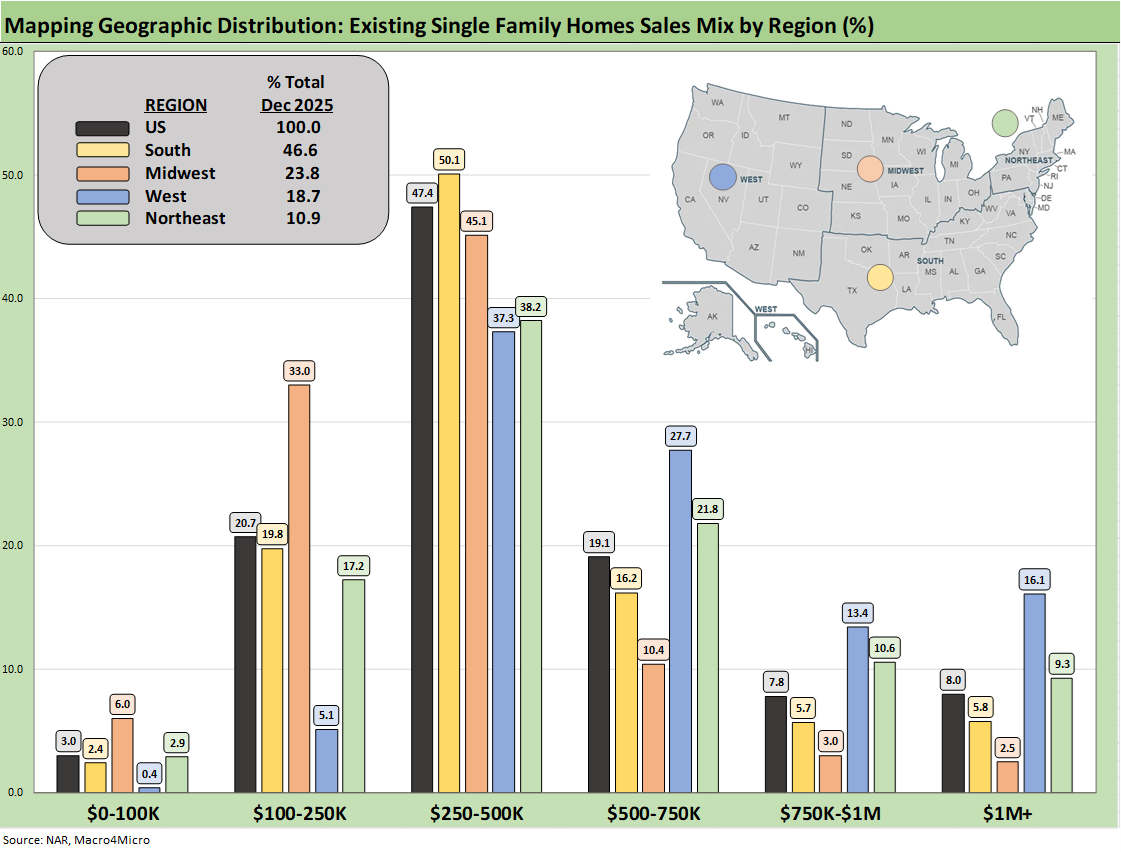
The above chart shows the geographic mix of volumes and details on price mix by region. The South is the main event in single family volumes whether new or existing at over 46%.
For the bar chart, we break out the mix for each region by price tier. For example, the South shows over 50% of its existing home sales volume in the $250k to $500K range and over 16% of its sales in the $500 to $750K bucket. The bars for each region add up to 100% (rounding).
The high cost of homes in the West (notably California) is clear enough just by glancing at the bar chart with 16% at prices over $1 million. The second highest in the $1 million club is the Northeast at over 9%. The market share of the $1 million tier started declining recently in a good sign for the tiers below that lofty level.
We see a big concentration in the $250K to $500K bracket for all regions at over 47% of the total and a heavy weighting in the $100K to $250K bracket for the Midwest at 33%. The map explains what states are in each Census region. There is a very wide range of home price profiles in the West and Midwest states.
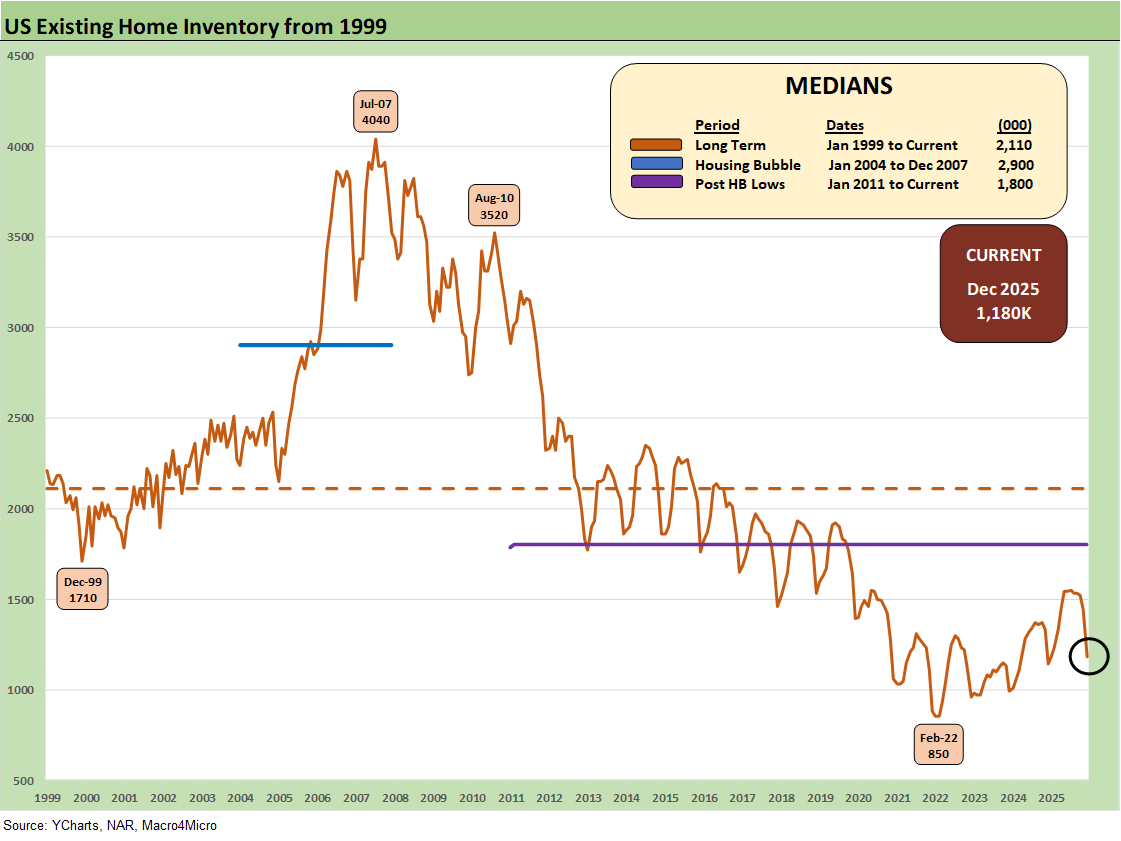
Inventory for total existing homes declined MoM to 1.18 million units for a -18.1%decline MoM but was still +3.5% higher YoY. Current inventory is well below longer term medians including 2.1 million for the post-1998 median. The median from Jan 2011 (homebuilding lows) to current times is 1.8 million. In other words, existing home sales inventory remains extremely low even if up from the stunning low 850K of Feb 2022 ahead of the end of ZIRP in March 2022.
The existing home inventory balance had shown a steady rise off the sub-1 million lows of 2022-2023. Inventory had risen to the 1.3 million handle range in 2024 before dipping back down to a recent low of 1.14 million to close out 2024. We bounced off those numbers in 2025 to get back above 1.5 million handles before the recent move lower to 1.4 million and now under 1.2 million.
The Feb 2022 lows at 850K occurred when demand was very high just before the tightening cycle kicked into gear in March 2022. Separately, single family home inventory in Dec 2025 is down MoM by -14.4% but up by +8.1% YoY. Condos and Coop inventory is down by -28.7% YoY and down by -42.5% MoM from Nov 2025. Condos and Coops are struggling.
Across 2025, the ability of prices to push higher in the face of rising YoY inventory had been less than intuitive and one of the more multilayered issues across price tiers and regions. We now see inventory shifting lower on rising sales volumes. We will also see the time-honored gap that often exists between seller and buyer, but the belief that a sharp yield curve move could favor lower rates might flesh out more sellers who have been on hold.
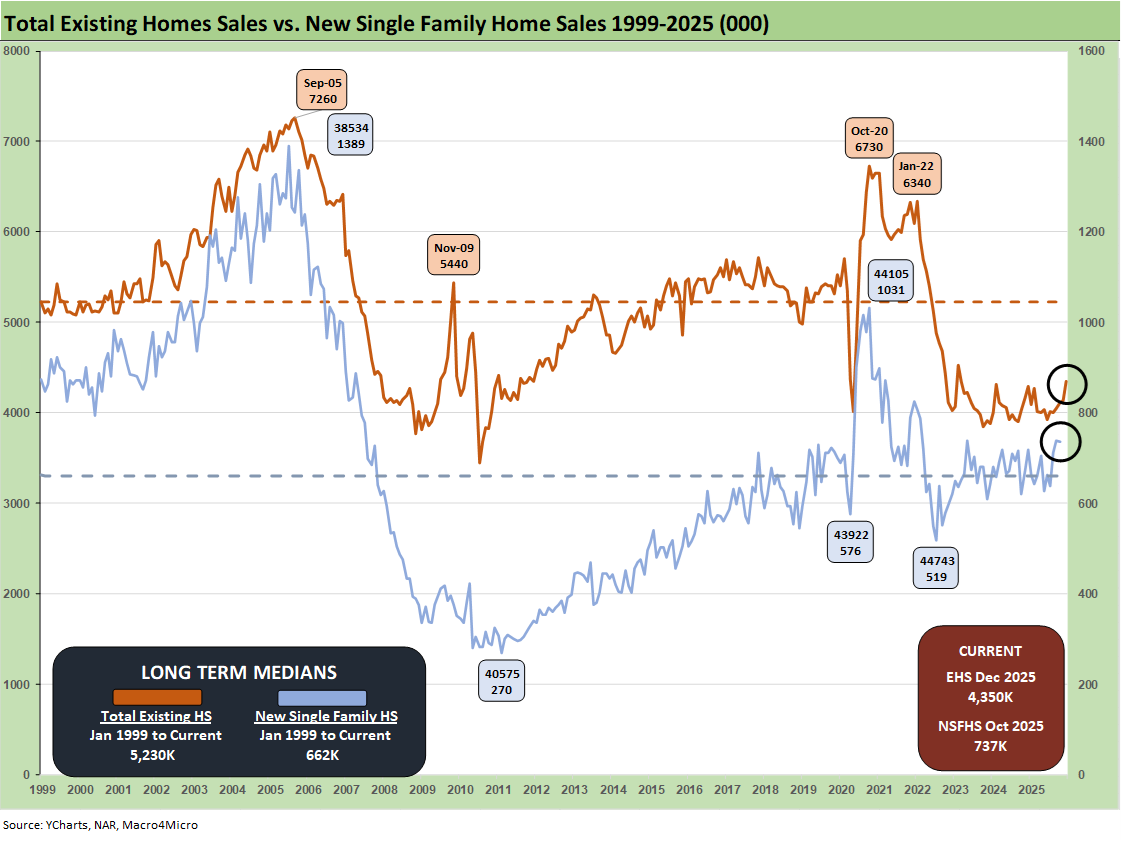
The above two-sided chart updates the trend line in total existing home sales vs. new single family homes. We had been operating without new home sales data from the Census since the shutdown, but we now have some updates (Note: the Jan 13,2026 release from the Census this past week covers through Oct 2025).
The existing single family MoM median price decreased to $409.5K in Dec 2025 from $415.1K in Nov 2025.
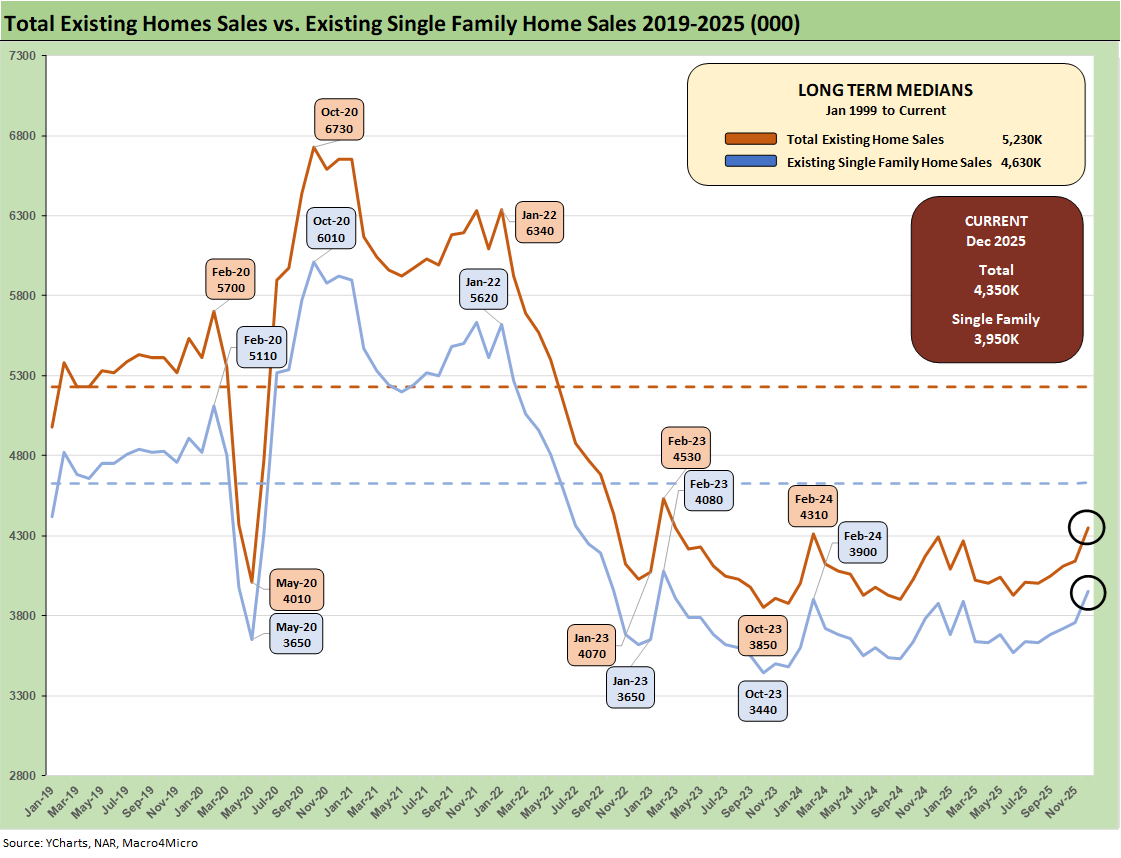
The above chart breaks out the timeline for existing single family alone of 3.95 million vs. total existing home sales of 4.35 million, which is well below the long-term median (from Jan 1999) of 5.23 million for total existing homes. Existing single family was +5.1% sequentially and +1.8% YoY (SAAR). The lower line is ex-condo/ex-coops. We saw 400K in condo and coop sales in Dec 2025, down from 410K YoY in Dec 2024 but up from 380K in Nov 2025.
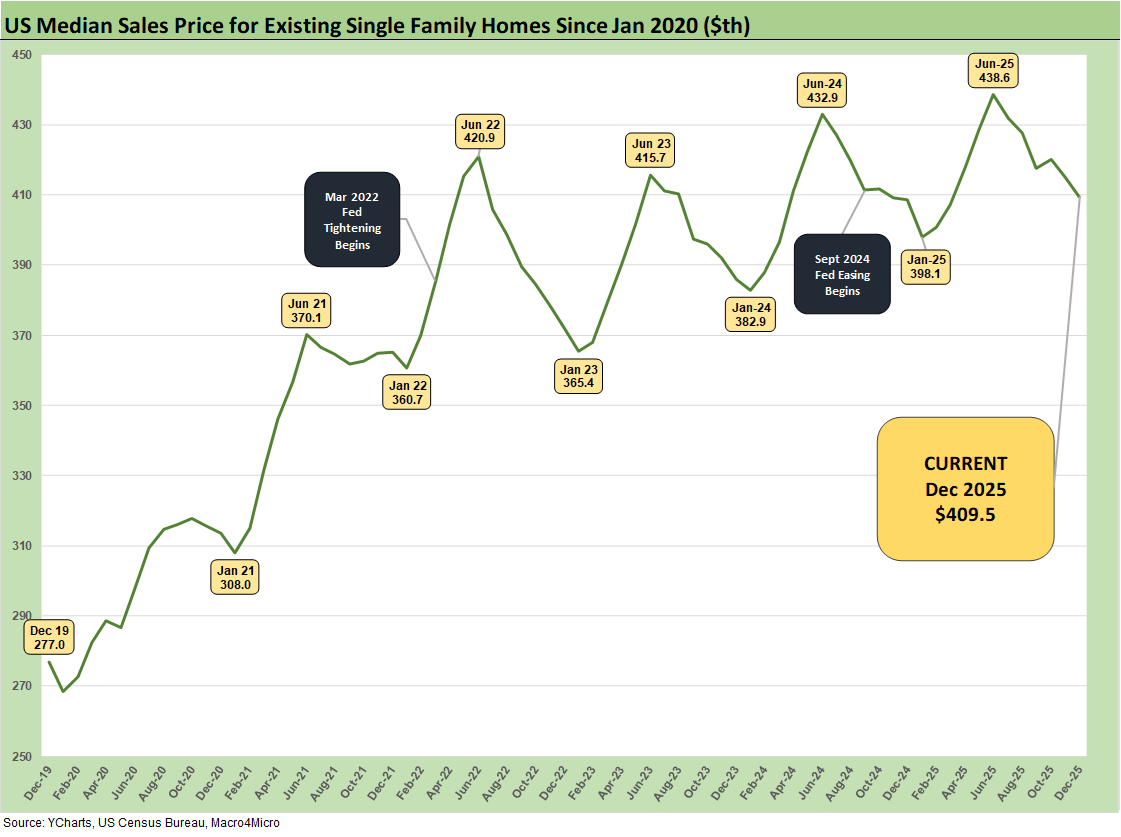
The above chart updates the median price for existing single-family homes at $409.5K after June 2025 hit a record $438.6K. The median price in Dec 2025 is dramatically above the $308K level back in Jan 2021 and $277K in Dec 2019 when mortgage rates were in a different zip code.
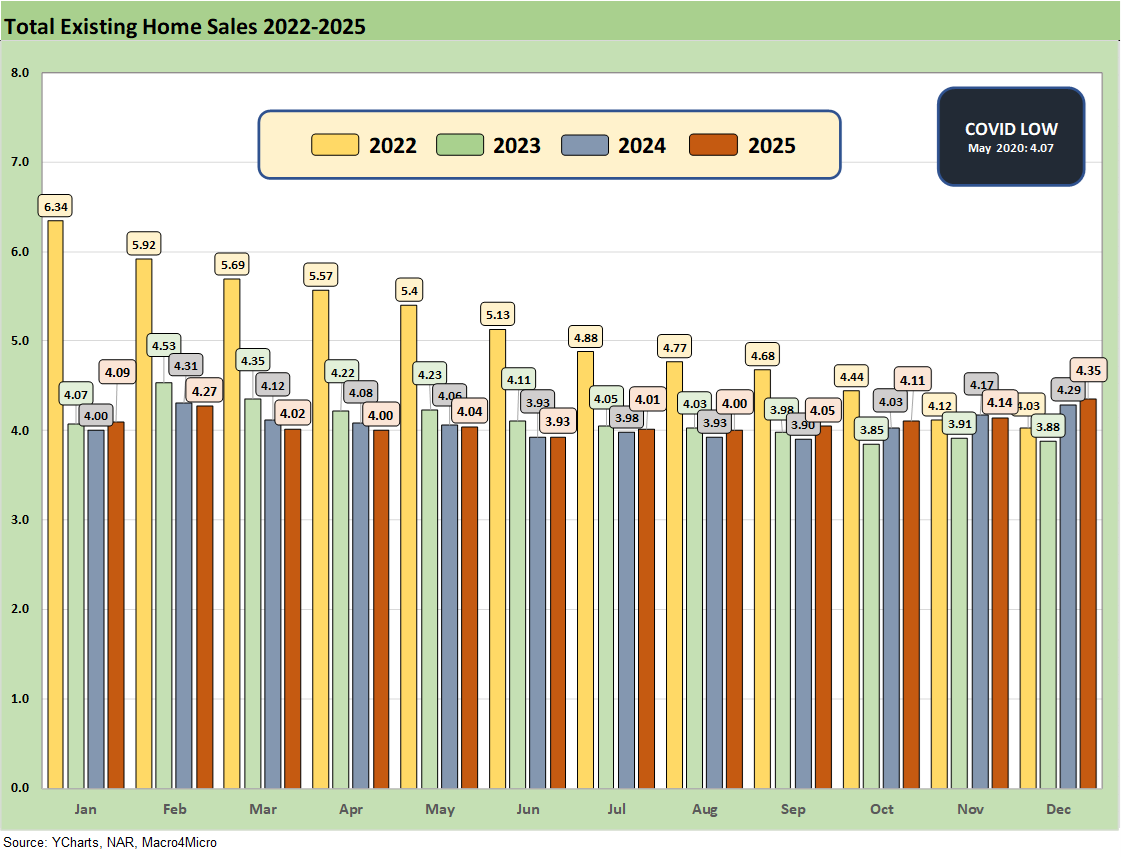
The above chart updates the monthly existing home sales across the timeline from Jan 2022 through Dec 2025. The existing home sales volume is a long way from the mid-6 and high 5 million handles of 2021 and then into early 2022 when many homeowners had refinanced and new buyers locked in low mortgages. ZIRP ended in March 2022 and then the UST migration began.
The Dec 2025 total of 4.35 million is comfortably above the May 2020 COVID trough of 4.07, but the current run rates remain quite low in cyclical context. We had a few more sub-4 million handles along the way as noted in the chart, so the 2023-2025 period has been brutal for real estate brokers.
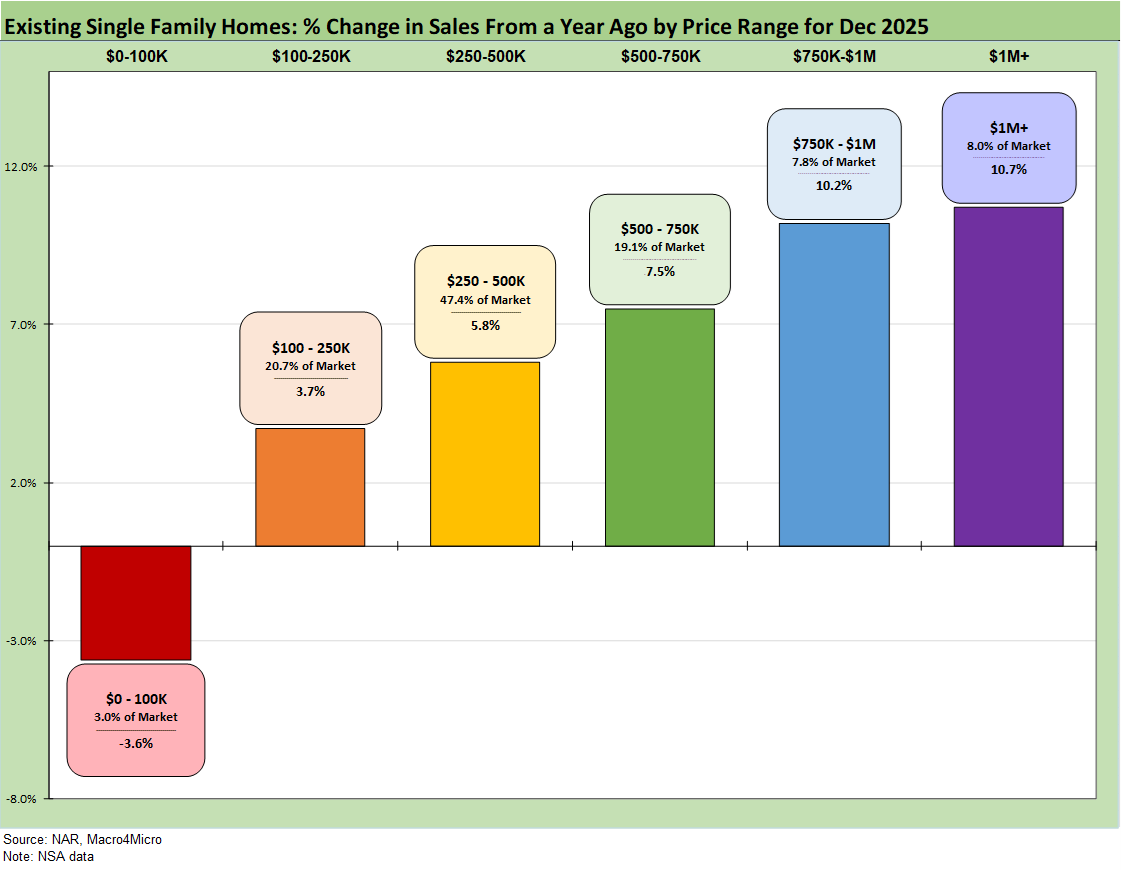
The above chart revisits the topical area addressed earlier on the existing home sales deltas by price tier. The largest tier is the $250K to $500K at over 47% of sales volumes, and that tier was +5.8% volume growth in a seasonally slow period. The seasons seem more wrapped around mortgage rates recently.
The affordability challenge for the lower tier buyers is evident with the $100K to $250K tier at +3.7% in a tier that comprises almost 21% of volume. The $500K to $750K tier is 19.1% of the market and was at +7.5% for Dec. For $750K to $1 million (7.8% of market), we see growth of +10.2%. The $1+ million tier was up by +10.7% for Dec. The highest price tier is 8.0% of the market.
The favorable trends in the above chart still get back to the reality of relatively low volumes in multicycle context. The chart also reinforces the obvious trend that homebuyers with more money are better off in such a market (not a new revelation).
See also:
Policy Mud on the Wall: Consumer Debt, Residential Mortgages 1-15-26
CPI Dec 2025: Sideways Calms Nerves – For Now 1-13-26
Payrolls Dec 2025 and FY 2025: Into the Weeds 1-10-26
JOLTS Nov 2025: Job Openings and Hires Down, Layoffs Lower 1-7-26
2025 Spread Walks and Multicycle Return Histories 1-5-26
Annual Return Differentials: HY vs. IG Across the Cycles 1-3-26
Total Return Quilt Across Asset Classes 2008-2025 1-2-26
Cyclical Histories: Will Facts Be in Vogue in 2026? 1-2-26
3Q25 GDP: Morning After Variables to Ponder 12-27-25
Durable Goods Oct25: Core Capex Still in Gear 12-23-25
Market Lookback: Last Call for Unusual Behavior 12-22-25
Existing Home Sales Nov 2025 12-21-25
November CPI: Tricky Navigation 12-18-25