
Footnotes & Flashbacks: Asset Returns 6-15-25
A mixed week for equities and favorable UST moves by bonds seemed mild in the face of the geopolitical backdrop.


Will the escalation bring even more damaging macro scenarios?
The week was divided on where the forward-looking risks would take us after the week’s sensory overload from the Middle East to LA. The curve rallied ahead of this week’s FOMC meeting after the May CPI metrics were reassuring (at least for a month). Tariff risk pricing remains a mix of timing, trade partner reactions, and political spin X factors. The Newtonian law of “the buyer writes the check for the tariff” means something is coming to the top line (price and/or volume) or the expense lines during earnings season (see Mini Market Lookback: Deus Vult or Deus Nobis Auxilium 6-14-25. CPI May 2025: The Slow Tariff Policy Grind 6-11-25).
The week had enough events and headline scares to undermine most any macro model that is forward-looking since the range of outcomes just got very wide and very quickly. Energy companies see their profits soar, but even that turns on the usual 6 standard deviation supply disruptions (Hormuz, mass destruction of Iranian infrastructure).
The most bullish view entails the miraculous surrender of Iranian fundamentalist leadership for the first time since the Shah fell in Jan 1979. For those keeping score at home, 1979 was the start of the inflation-to-stagflation timeline. The current market is looking at waves of tariffs underway and some major Section 232s in process along with a budget bill that has a swarm of flies around it. That is a UST curve buzz kill.
The toxic domestic political environment in the US today is also worse than it has been since the Vietnam War (some could argue 1860). The more transparent authoritarian motives do not help. The deployment of the military by a White House that ignores court rulings underscores how the markets have become dulled to such behavior. That is a risk below the asset performance lines in the realm of corporate sector planning and consumer behavior. Regardless, Israel vs. Iran will remain an all caps focus for the markets as events unfold.
The last time the US had such a confluence of events was in the fall of 1973, when Nixon brought the Saturday Night Massacre and a Middle East war brought the Arab Oil Embargo. That brought a protracted recession that lasted into early 1975 (see Misery Index: The Tracks of My Fears 10-6-22, Business Cycles: The Recession Dating Game 10-10-22). The range of potential setbacks in the Israel vs. Iran main event could spill over quickly into numerous oil price scenarios and the role of the US in the inevitable cycle of retaliation.
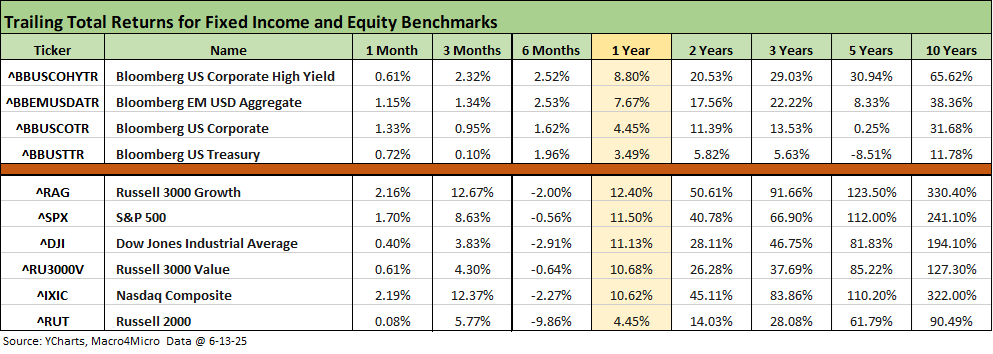
We reviewed some of the moving parts already in Mini Market Lookback: Deus Vult or Deus Nobis Auxilium (6-14-25), and it was quite a week for headlines. The net asset price moves across the trailing week was mild given the potential risks of the Middle East action. The 4 major benchmarks were negative for the week but with energy ETFs soaring. That feeds into trailing the trailing 1-month and 3-month periods that are back to all positive for the high-level debt and equity benchmarks we track in the above table each week.
The 6-month period has obviously been a very choppy one for the equity markets with all the tariff noise. The tariff impact is working its way into working capital cycles and will necessarily show up in margins or prices. We always recommend looking at releases like the Beige Book and ISM to get closer to sea level since the politicization of basic economic realities and hard facts has gone the same way as most other fact discussions in Washington (cue the sound of the garbage disposal).
We at least are slowly (not entirely) moving away from the second biggest lie, which is that the “seller pays the tariff.” Time will prove the obvious facts that an expense or a price and/or volume impact comes with tariffs. The White House has been pushing the “seller pays the tariff” theme for months, and it takes very little work to see that it is false. The fortunate history for Washington is that the little lies are quickly forgotten, but the really Big Lies can get sold to the public and last in the minds of many.
That concept of “big lie repetition” is not a new one. As many know, the big lie strategy was cooked up long ago by some short guy with a moustache. The seller pays the tariff is not a “big lie” (2020 election was a big lie), but the tariff falsehoods are also not a small lie since it is the foundation of current economic policies. The tariffs are straining relations with potentially “former allies” at a time of Middle East stress where allies can come in handy. The G7 tone this weekend and into Monday will be interesting to follow up on for trade.
The rolling return visual
In the next section, we get into the details of the 32 ETFs and benchmarks for a mix of trailing periods. Below we offer a condensed 4-chart view for an easy visual on how the mix of positive vs. negative returns shape up. This is a useful exercise we do each week looking for signals across industry groups and asset classes.
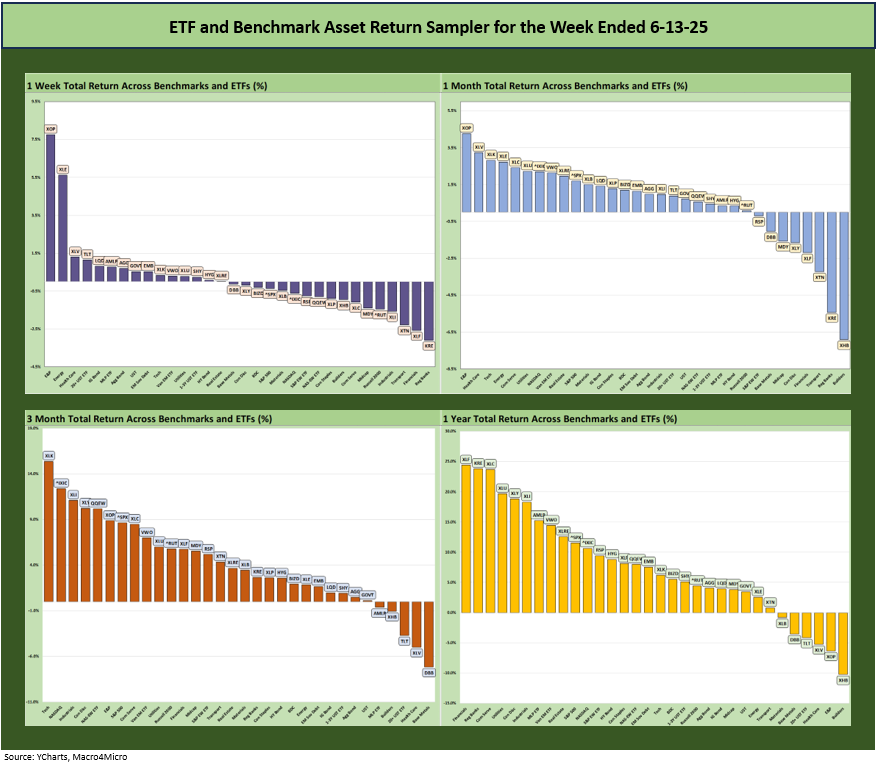
We see a heavy mix of positive bias in the scoresheets above and in the YTD chart (not shown above, but YTD is broken out below at a score of 23-9). The 1-week mix was an exception as it came in at 15-17. All 7 bond ETFs that we track were in positive range, so the week was more on the negative side for the group ex-fixed income.
The Magnificent 7 heavy ETFs…
Some of the benchmarks and industry ETFs we include have issuer concentration elements that leave them wagged by a few names. When looking across some of the bellwether industry and subsector ETFs in the rankings, it is good to keep in mind which narrow ETFs (vs. broad market benchmarks) get wagged more by the “Magnificent 7” including Consumer Discretionary (XLY) with Amazon and Tesla, Tech (XLK) with Microsoft, Apple, and NVIDIA, and Communications Services (XLC) with Alphabet and Meta.
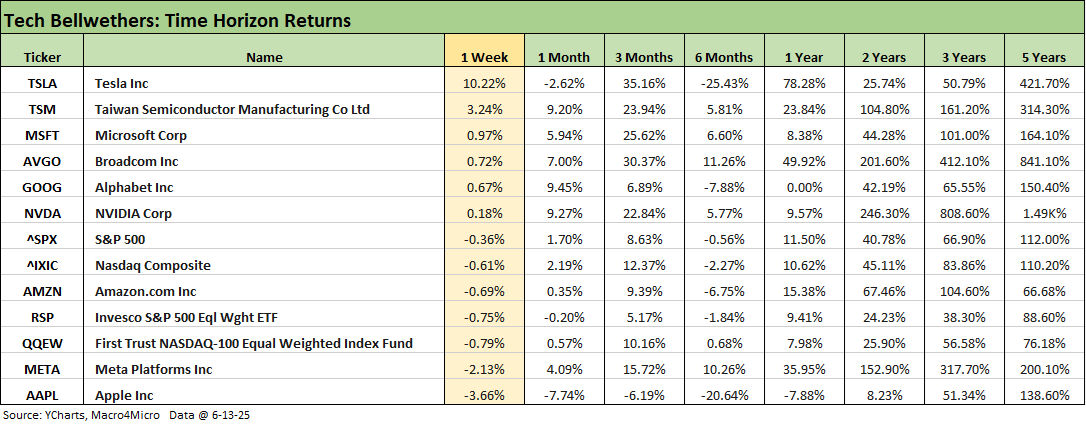
We looked at the tech bellwethers already in Mini Market Lookback: Deus Vult or Deus Nobis Auxilium (6-14-25) with 4 of the Mag 7 positive on the week and 5 of 7 positive for the 1-month. It is notable that the NASDAQ and equal weighted NASDAQ 100 ETF (QQEW) were in the red for the week. Tesla is mounting a comeback at +10% on the week, but it remains at -2.6% for 1 month and -25.4% at 6 months. The always-volatile TSLA is +35.2% for 3 months and +78.5% for one year.
Musk’s hair pulling contest with Trump does not seem to be going away with his weak admission this past week that he “went too far” on some comments (it does not take AI to figure that out). We see reports in the media indicating Trump is investigating some of Musk’s businesses with an eye on SpaceX. That is a small peer group with SpaceX a critical leader, so the human emotion factor still seems to rule policy actions.
Those dramas are idiosyncratic spectator sports for those who do not have “Musk exposure,” but the “Musk family tree” features a lot of vary valuable businesses in emerging spaces (literally). In other words, a less petulant President likely should be advised to let the genius do his thing with his businesses even if he is a singularly detestable human being. Findings someone in the sheep herd advising Trump on what he does not want to hear is unlikely. Finding a courageous policy adviser to serve this White House could require a Mars landing and search party, so Musk might be helpful.
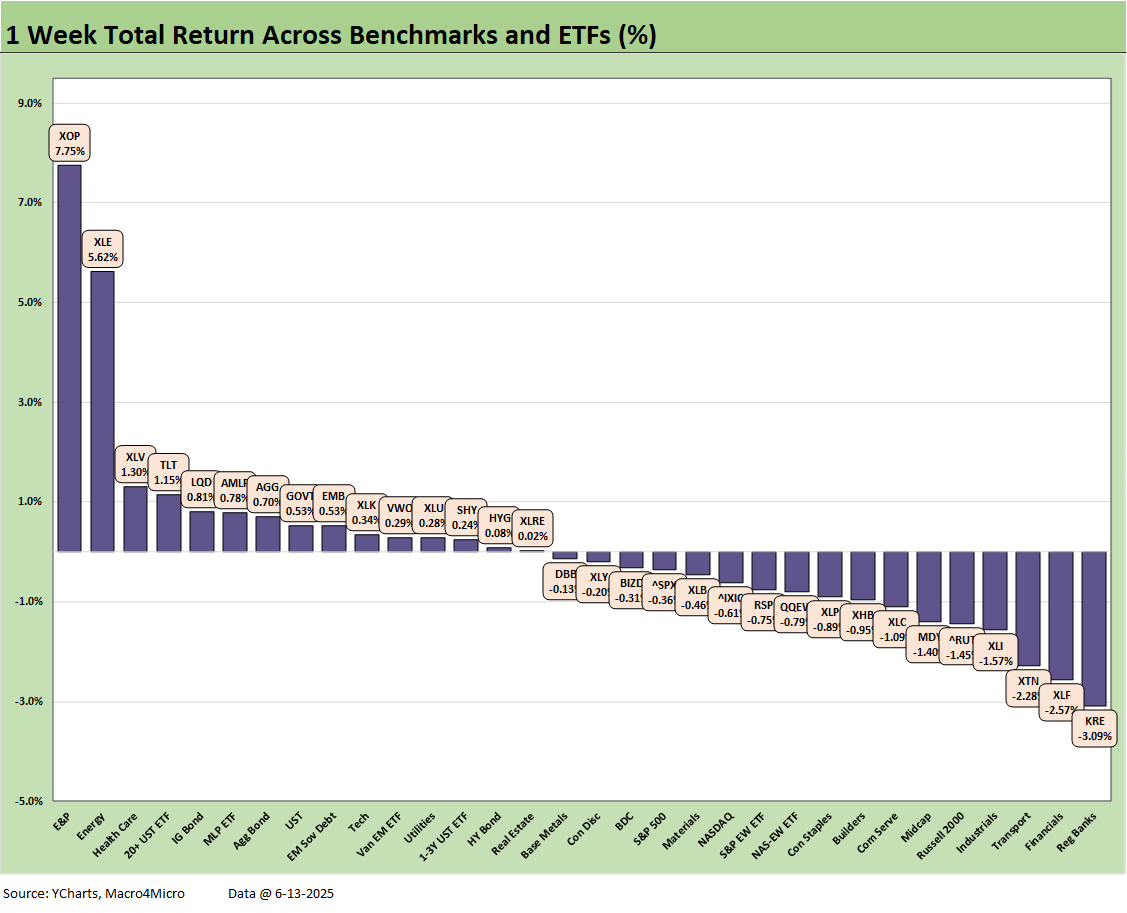
The 1-week groups of 32 benchmarks and ETFs put up a 15-17 score, but the adjusted score was 8-17 excluding bond ETFs. We see all 4 major benchmarks in the red across the S&P 500, NASDAQ, Midcaps, and Russell 2000 small caps. The top quartile included the long duration UST ETF (TLT), IG Corporates (LQD), the Aggregate Bond ETF (AGG), and GOVT.
Energy obviously soared with E&P (XOP at #1 and Energy (XLE) at #2 with the less price-sensitive AMLP also in the top quartile. A sustained spike in oil with severe disruptions in the Middle East (Strait of Hormuz setbacks, sustained bombing of Iran energy operations, etc.) could set off a new infrastructure wave in the US and Canada.
The bank ETFs (KRE, XLF) were on the bottom and definitely disliked the oil spike threat and potential for escalation. Transports (XTN), Industrials (XLI) and the US-centric small caps (RUT) also had plenty to get worried about when taken in tandem with rising tariff pressures.
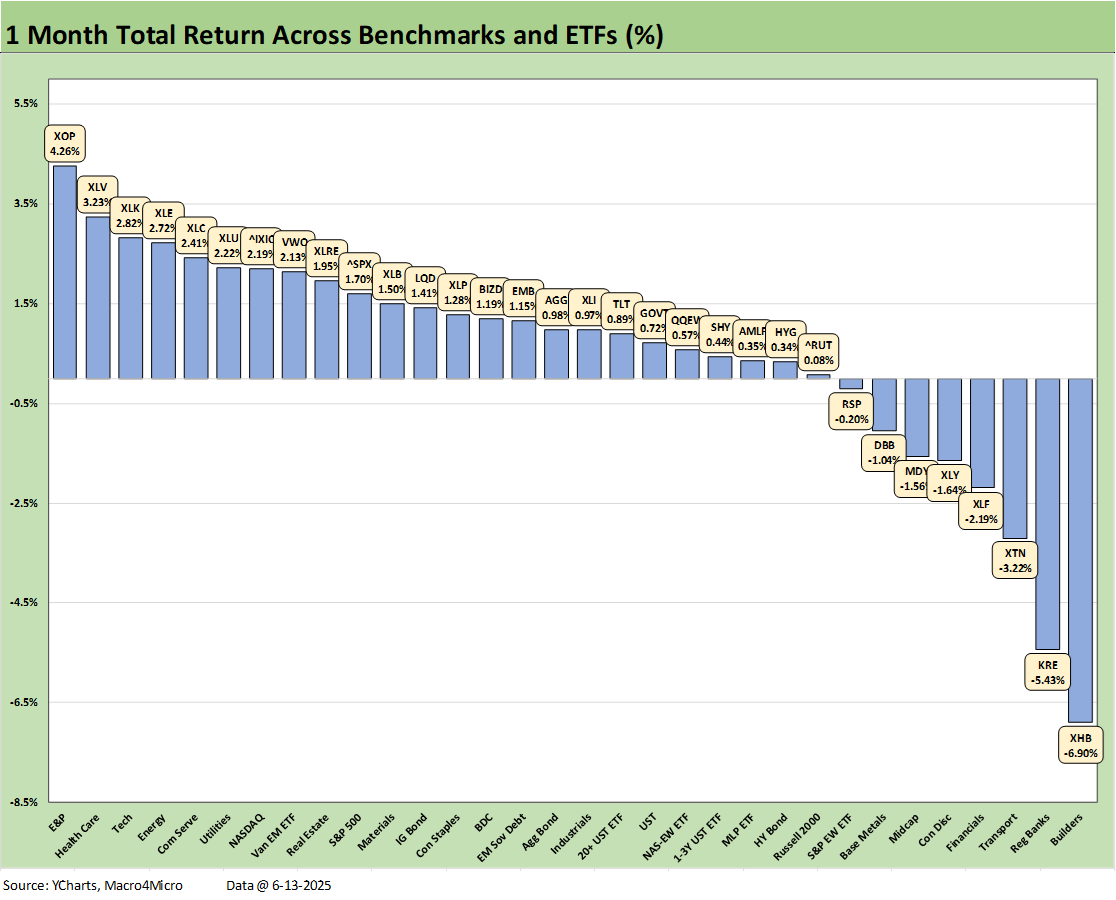
The 1-month numbers continued the bounce off the early April tariff panic and show a score of 24-8 with the bottom tier showing Homebuilders (XHB) in dead last just behind Regional Banks (KRE), Transports (XTN), Financials (XLF), and Consumer Discretionary (XLY) rounding out the bottom 5 asset lines.
That mix raises some flags and especially with financials since the fear for 2H25 is that the range of factors we have been reviewing each week could start to flow back into the need for higher loan loss provisions. Meanwhile, the stubborn front end of the UST curve may make policy change difficult for the FOMC as tariffs and now oil threaten an inflation cycle.
The interest rate sensitive and consumer-focused housing sector has been struggling mightily since the fall with margin pressure and dim views on mortgage rate progress. The Transports ETF (XTN) has been slammed by tariff-based trade disruptions. The softer results for financials will be something to watch closely when we get into 2Q25 earnings season and get more color from the banks on the various lending sectors and notably consumers and small businesses. The same will be true over in auto finance across the credit quality tiers. Right now, it is a mixed bag.
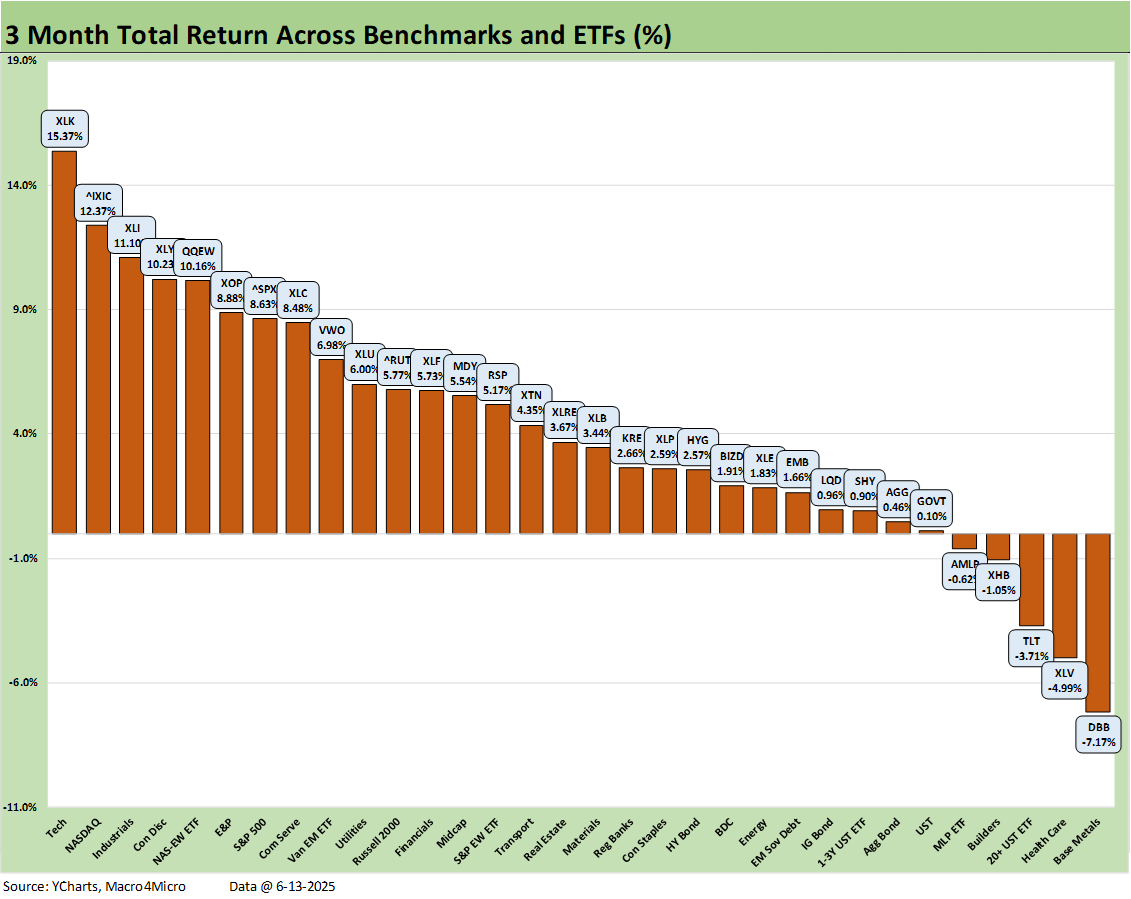
The 27-5 score for the rolling 3 months is enough to make you forget Liberation Day if it was not for the fact that the tariff pause is ticking, tariffs are currently at an all-time high and without question will be higher once the reciprocals are in place and the high volume Section 232 process continues (pharma, semis, aircraft/parts, copper, lumber). More trade partner retaliation will come at some point. Some might be waiting for the current crop to rattle markets before they fire a retaliation salvo. We pick EU as most likely to retaliate in scale once pharma gets hit.
The negative returns in the scoresheet include Base Metals (DBB), Health Care (XLV), the long duration UST 20+ years ETF (TLT), Homebuilders (XHB), and Midstream Energy (AMLP). We would expect AMLP to see a very different look in the months ahead given the Middle East war underway.
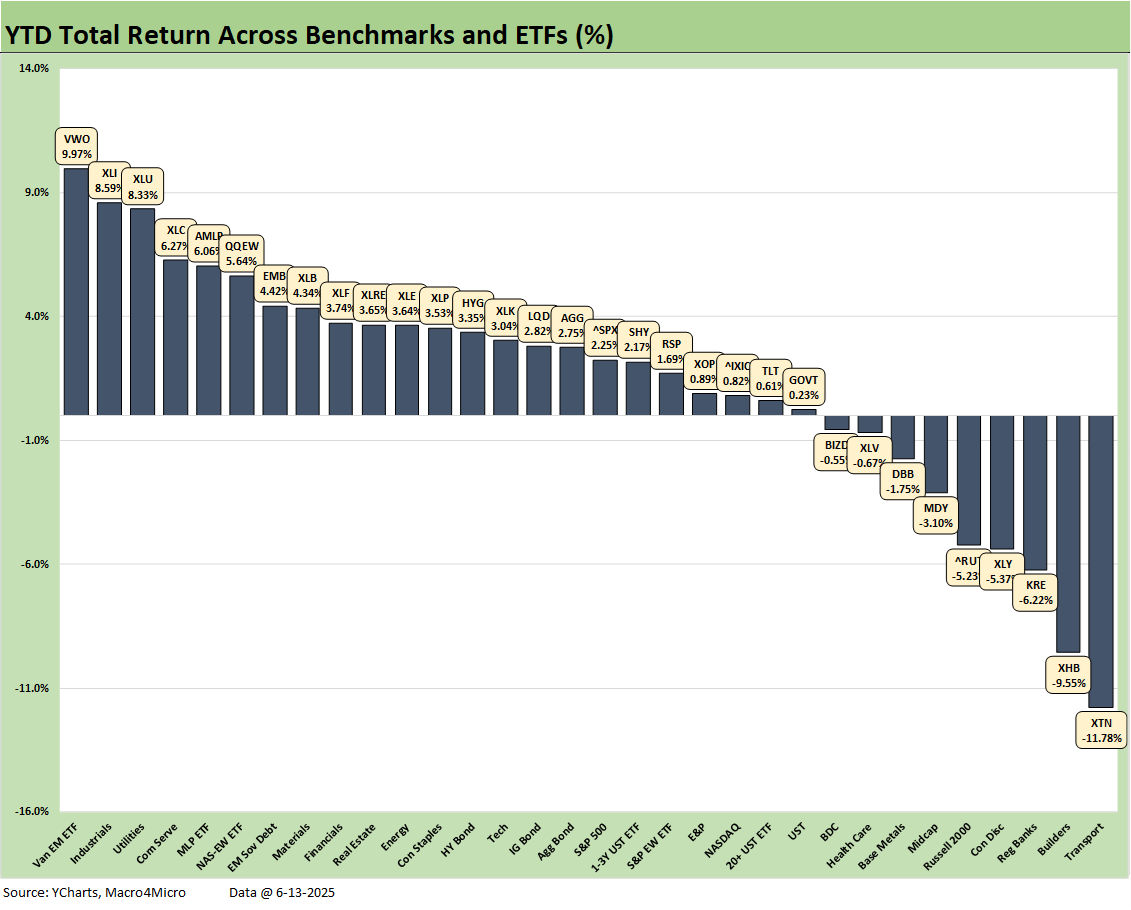
The YTD score is 23-9 with all bond ETFs positive. The flavor of the underperformers signal worries around interest rate sensitivity (XHB) and victims of tariff excess (XTN) but also the cyclical specter of weaker asset quality at Regional Banks (KRE). The Consumer Discretionary ETF (XLY) risks cut across tariffs as well as some signs of tempered Personal Consumption in recent PCE releases and 1Q25 GDP estimates. Small caps (RUT) and Midcaps (MDY) are in negative range YTD, and that is also a sign of mixed confidence by subsectors.
The winners YTD include EM Equities (VWO) at #1, Industrials (XLI), Utilities (XLU), Communications Services (XLC), and Midstream Energy (AMLP) in the Top 5. Those sectors have recurring themes that worked around the worst of the tariff threats except for the large cap industrials in the XLI bucket. The major industrials have more flexibility than small cap and mid cap manufacturers, and that will get put to the test across the 3Q25 period.
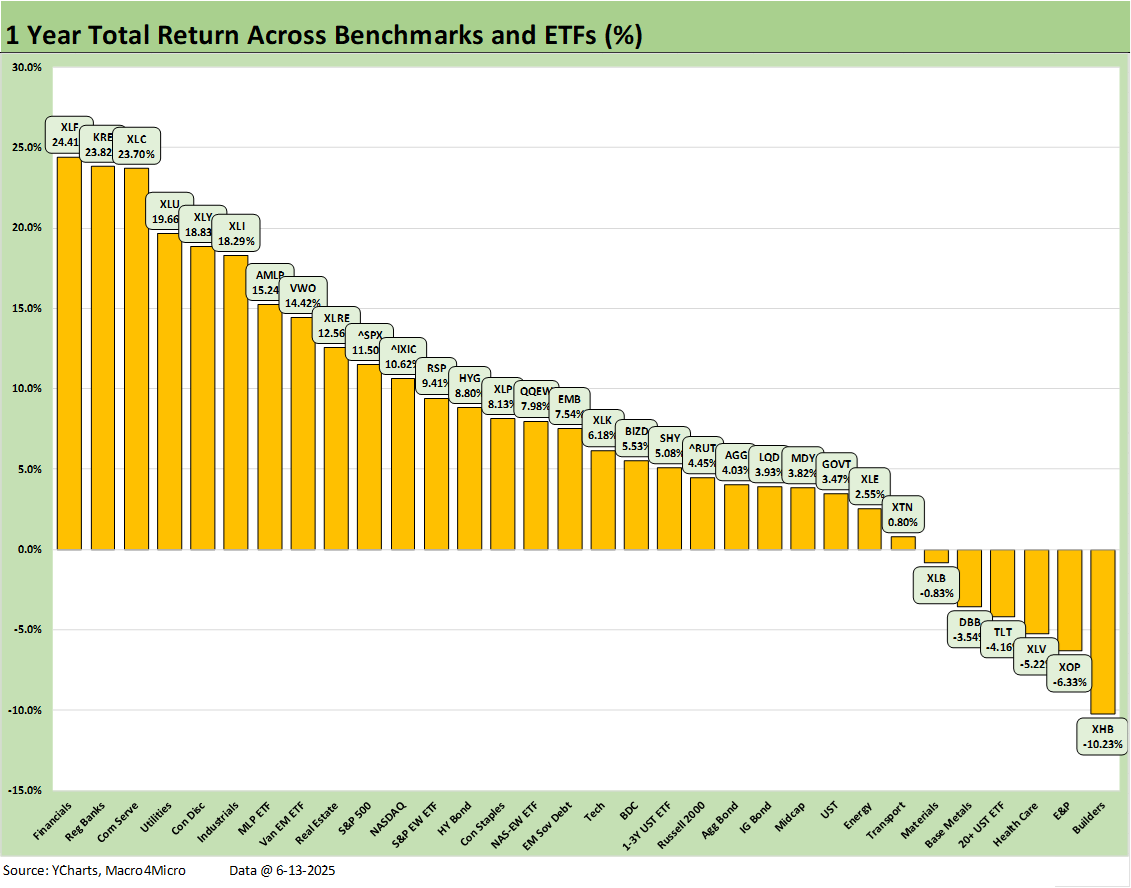
The trailing 1-year score of 26-6 has held in well with a few exceptions for companies hit by the stubborn curve (notably mortgage rates) and anxieties around protracted tariff fallout in 2H25. Meanwhile, the consumer cycle has been weakening as evident in PCE lines and mixed consumer credit quality metrics. The market also faces fear of a broader breakdown in global growth as underscored in recent OECD and World Bank studies and forecasts.
Among mitigating factors is the service-intensive mix of payrolls in the broader economy (AI-driven payroll cuts and related panic arguably are at least a handful of years away). Investors also can lean on the largest, most cyclically diverse US economy ever seen by market participants. That means less fixed cost intensity, less cyclical earnings volatility, and a broader base of payroll with more stability (for now).
The E&P ETF (XOP) stands out as a weak performer given the decline in oil prices, demand worries, and supply actions by OPEC. The moving parts in oil just saw a lot of change in a few days with some challenging handicapping ahead on Middle East outcomes.
See also:
Mini Market Lookback: Deus Vult or Deus Nobis Auxilium 6-14-25
Credit Snapshot: Hertz Global Holdings 6-12-23
CPI May 2025: The Slow Tariff Policy Grind 6-11-25
Footnotes & Flashbacks: Credit Markets 6-9-25
Footnotes & Flashbacks: State of Yields 6-8-25
Footnotes & Flashbacks: Asset Returns 6-8-25
Mini Market Lookback: Clash of the Titans 6-7-25
Payrolls May 2025: Into the Weeds 6-6-25
Employment May 2025: We’re Not There Yet 6-6-25
US Trade in Goods April 2025: Imports Be Damned 6-5-25
Past-Prologue Perspective for 2025: Memory Lane 2018 6-5-25
JOLTS April 2025: Slow Burn or Steady State? 6-3-25
Tariffs: Testing Trade Partner Mettle 6-3-25
Footnotes & Flashbacks: Credit Markets 6-2-25
Mini Market Lookback: Out of Tacos, Tariff Man Returns 5-31-25
PCE April 2025: Personal Income and Outlays 5-30-25
Credit Snapshot: Meritage Homes (MTH) 5-30-24
1Q25 GDP 2nd Estimate: Tariff and Courthouse Waiting Game 5-29-25
Homebuilder Rankings: Volumes, Market Caps, ASPs 5-28-25
Durable Goods Apr25: Hitting an Air Pocket 5-27-25
Mini Market Lookback: Tariff Excess N+1 5-24-25
New Home Sales April 2025: Waiting Game Does Not Help 5-23-25
Existing Home Sales April 2025: Soft but Steady 5-22-25
Credit Snapshot: Lithia Motors (LAD) 5-20-25
Home Starts April 2025: Metrics Show Wear and Tear 5-19-25
Industrial Production April 2025: CapUte Mixed but Time Will Tell 5-15-25