
Footnotes & Flashbacks: Credit Markets 6-16-25
Credit markets remained resilient last week even as the domestic and geopolitical risk landscape raised the stakes.


Middle East predictions can be rather tricky.
Spread moves were muted this past week across a busy week that included favorable May CPI numbers, continued domestic military deployment in LA, and most importantly a war breaking out in the Middle East. The forward-looking risk landscape became more complex, but US IG only moved +1 bp and US HY widened +9 bps.
The FOMC meeting this week will bring some hard data points for the market to consider with the dot plot shifts and the Fed views on the remaining 2025 economic outlook. They will be casting an important vote on how they see the eventual tariff effects playing out in their PCE inflation forecasts as well as in their GDP growth and unemployment medians.
Trump will continue to call for material FOMC easing (demanding 100 bps now) even as the tariff pipeline remains crowded with Section 232 actions and the paused reciprocal tariffs await next steps. News on China trade was positive in smaller context than it was packaged by the White House, but any peace with China is good news, Tariffs await a long list of framework details, and there have been zero trade deals in substance and in fact with any major trade partners at this point (even the UK was a framework only). Though the latest CPI and payroll prints only hinted at early tariff reactions, the eventual timing on macro weakness still lurks into 2H25.
The escalating war in the Middle East between Israel and Iran adds a new layer of risk on a renewed oil shock. The theoretically increasing risk to oil prices is seeing big swings already in how to price the risk premium in oil and in stock market valuations. The market is rallying on the idea that Iran will do a tactical retreat and lean on Trump’s desire to be a deal architect. That will buy time for the markets, but handicapping such a massive geopolitical wildcard is not going to be easy. That would at least mark a return to game theory from irreversible continued bombing – for a period TBD.
This week is relatively quiet on the econ front with Retail Sales and Industrial Production on Tuesday followed by Housing Starts and the FOMC meeting on Wednesday and a holiday (Juneteenth) on Thursday. There is plenty of scenario spinning to work through as the risk landscape gets a new set of variables with the Israel-Iran war and Trump’s much more aggressive tone on going after major blue cities with ICE and any troops he decides to deploy. Distractions from tariff economics are coming in waves.
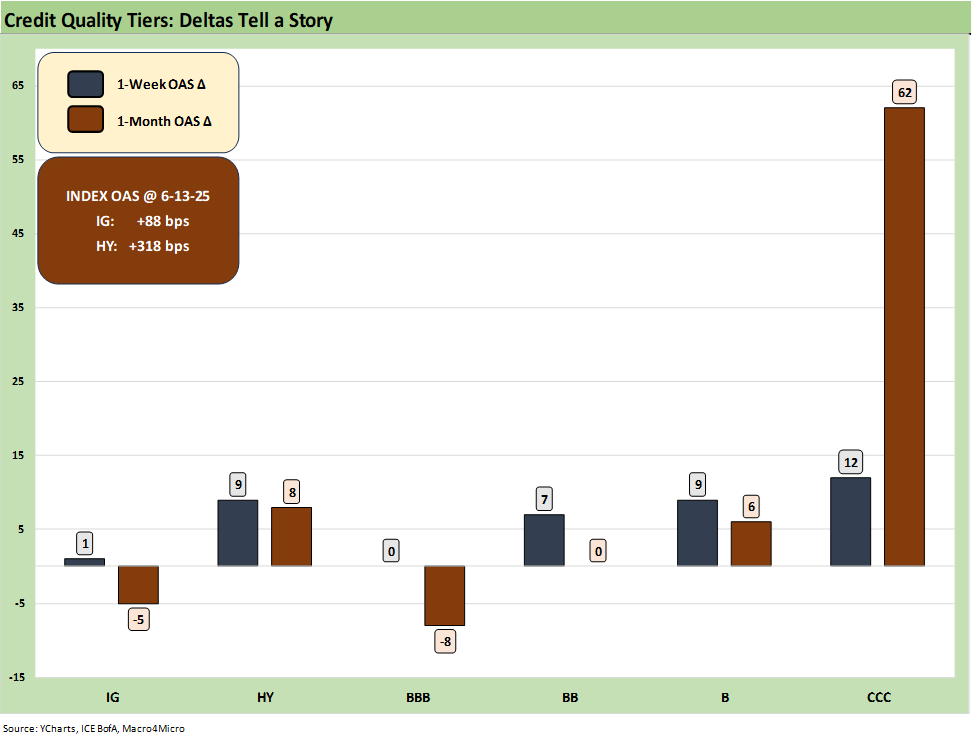
The above chart shows the much quieter 1-week and 1-month moves that we already discussed in the Mini Market Lookback this weekend. The last 2.5 months has been a wild ride of elevated volatility with such a rapid April spread spike and follow-on rally. This week was quiet in comparison with little upside reaction to modestly positive CPI news on Tuesday and a surprising lack of downside reaction to the escalation of Israel-Iran conflict on Friday.
The 1-month moves reflect what is now likely to be a bit more of a range bound market as many believe the worst of the tariff-driven volatility is behind the market. Spreads were as wide as +120 bps for US IG and +461 for US HY at the peak. The post-May rally sent IG spread to just under +90 bps range and low +300 range for US HY. The irony of too much “post tariff relief” that most of the actual economic impacts for tariffs are ahead and not behind the market. The most important trade war risk – China – is at least behind the markets as Trump et al tested their theories (and they did not work).
As we approach the end of a volatile 1H25 and new Washington policies, credit indices are only +6 bps wider for US IG and +26 bps for US HY. The market has very successfully digested a lot of new risks while posting a solid 1Q25 earnings season. The market has been navigating stubbornly high long rates (including mortgages) and dealing with a fed that remains disciplined, keeping floating rate debt more expensive for companies than would be the case without the tariff risk.
We replay commentary from earlier this weekend below as the rising tensions in the Middle East feed into a fresh round of oil price shocks:
Oil prices can flow into earnings trends very quickly and notably into the expense structure of energy intensive operations. Consumer discretionary cash flow can also take a hit during peak driving season. Headline CPI has been riding deflation in energy (notably gasoline) but that could change materially in coming weeks (see CPI May 2025: The Slow Tariff Policy Grind 6-11-25).
The oil crisis scenarios are easy enough to spin since the market has been there more than a few times across the decades. The tempering influence could be that the credit markets are in relatively good shape vs. such periods as 2008 (record summer oil spike) and fall 1990 when both markets had already seen the credit markets sliding (crashing) in dramatic fashion. The US has also been posting record oil production levels in recent years and Canada’s production capacity has soared since those prior cycles.
In the coming days, any sign of a return to negotiation such as what we see today on the screen will be celebrated. It is hard to shake decades of enmity since the fall of the Shah and the hostage crisis and the basic realities of fundamentalist hate toward Israel and the US. Most of that is basic old-time reality, but the end of the nuclear program is one that is hard to get past if a move to negotiations is perceived as stall. There will be a lot of action ahead.
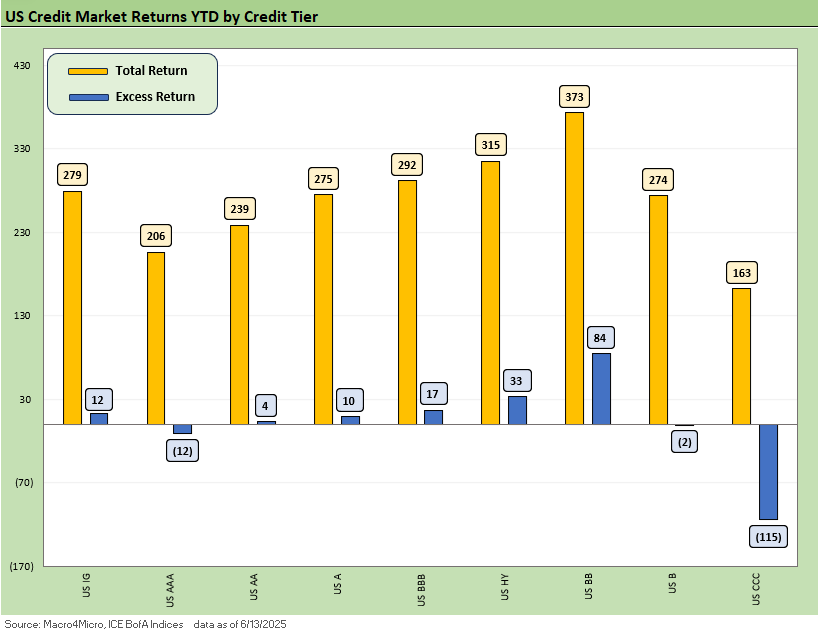
The return picture for the US credit markets is shown above and the relatively quiet week meant little movement above as the small spread widening was offset by the UST rally (see State of Yields). Excess returns remain barely positive across the board in the medium grade credit layers and HY tiers except for CCCs, which are now down at -115 bps YTD.
The BB tier remains the top of the group in total and excess returns as it is the only ratings tier with YTD spread compression. The BB tier also offers modest curve exposure relative to the BBB tier for those constructive on credit but who fear UST steepening. The overall picture for credit spreads is still showing unfavorable symmetry in our view with new risks to digest and the range of outcomes widening.
The total return picture this year has been anchored on the 2Y-10Y rally YTD on UST threats on record deficits and UST supply. Despite focus elsewhere last week, the Big Beautiful Bill still leaves a lot of room for bearish sentiment on the long end and the dollar. New oil price and inflation risks complicate that picture and the possibility of IG return volatility remains high on those curve risks.
UST supply and demand dynamics are still a key part of the equation. Though UST remains the premier flight-to-quality asset, foreign holders may not be so keen as trade talks continue to highlight stark differences and new threats trade partners. The reality is that UST markets need much more demand – not static demand.
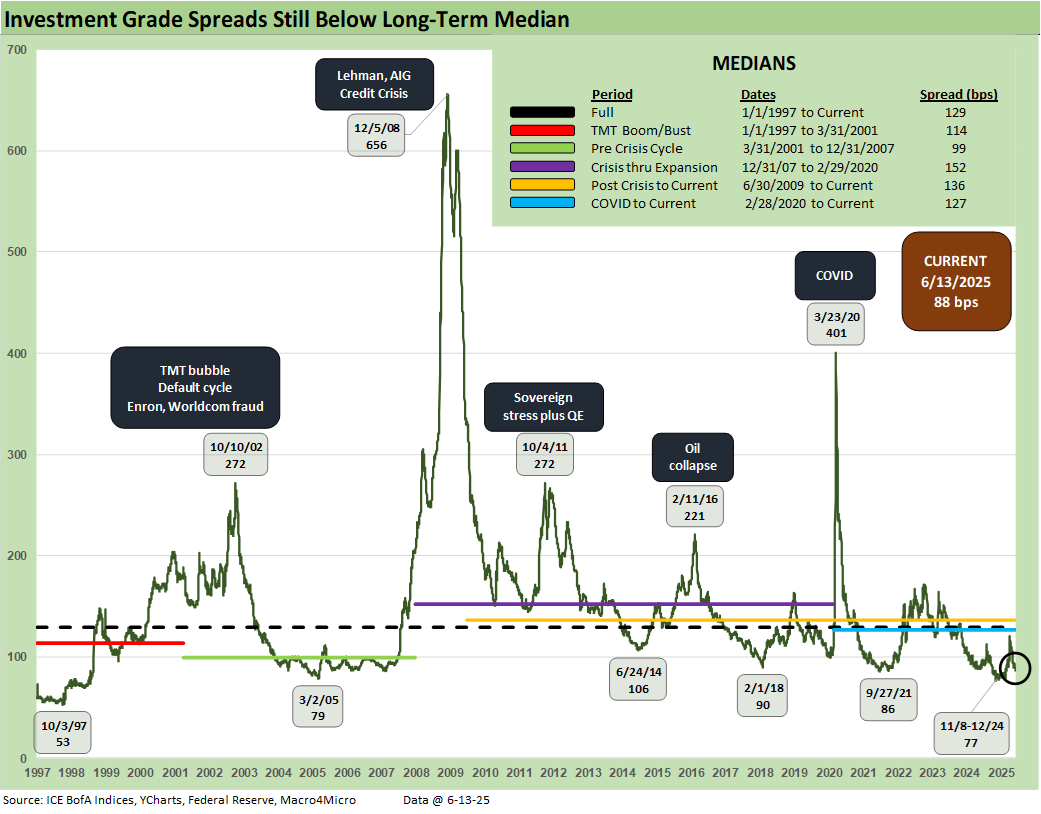
US IG spreads ended the week +1 bps wider, well into the double-digit territory and +6 bps wider YTD. Spread moves for IG were increasingly insulated from tariff driven volatility, and that resilience remained amidst the CPI and Middle East news flow last week. With so many risks cited around the long end of the curve (budget, lower growth, worsening demand, the dollar, etc.), one only needs to flash back to 2022 to remember what kind of pain could ensue.
The IG OAS level is likely a challenge to sustain later into this year with stagflationary risks heightened and new tariff headlines continuing to roll in (pharma, semis, aircraft/parts, lumber, copper etc.). In the meantime, spreads are likely to remain range bound for now even as the market awaits clarity on outstanding risks. The missing data and any exemptions in the tariff waves and uncertain timing are the enemy of FOMC capitulation to Trump’s easing demands. It is on him.
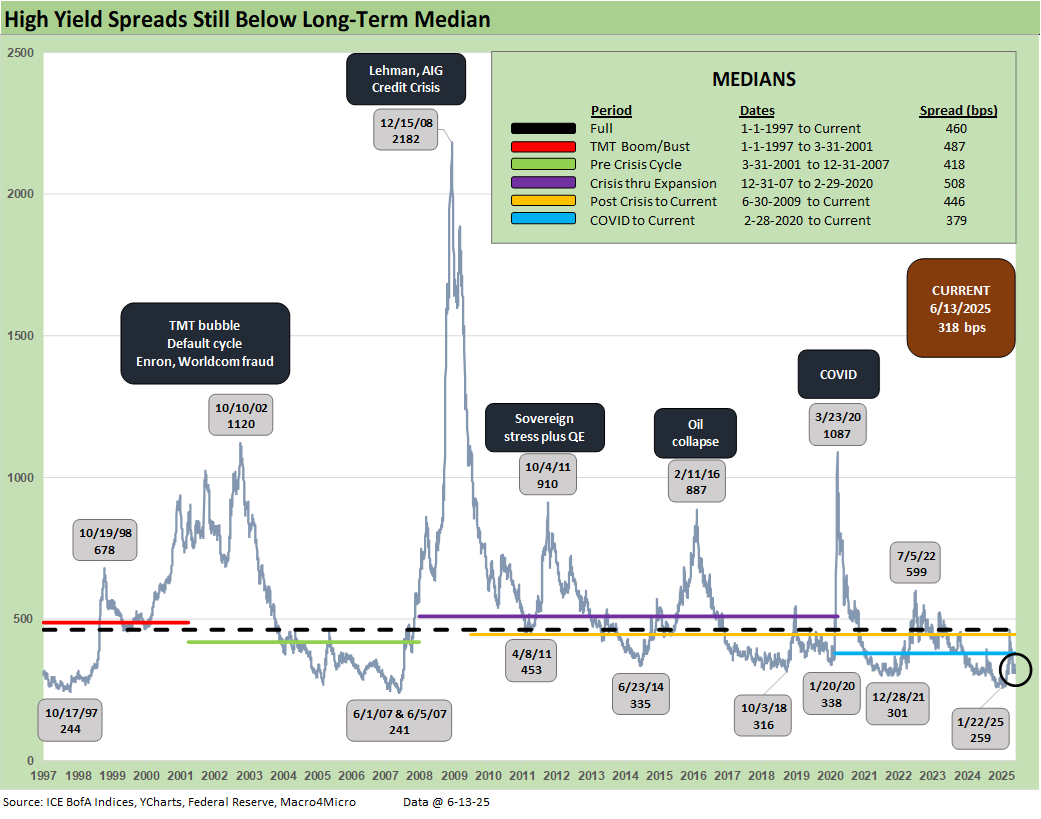
This week saw +9 bps of widening for US HY up to +318 bps with spreads remaining in the low +300 range. This week’s rally sees spreads still close to the 2014 and 2018 cyclical lows and need a lot to go right on the trade and energy front to remain at these compressed levels. The pain came quickly in late 2018 with the Fed having leeway to come to the rescue in 2019. The extent of inflationary pain may curb their ability to do the same this time around if payroll impact lags as the impact of tariff policies largely remains a question mark (see Past-Prologue Perspective for 2025: Memory Lane 2018 6-5-25).
As with US IG spreads, we struggle to see the resolution of trade issues without further hiccups. A path to resolution in the Middle East that does not face setbacks is a very optimistic scenario given the more distinct nature of this current clash. US HY spreads at these levels remain vulnerable to more volatility even if they remained largely on the sidelines as equity markets whipsaw from day to day on headlines.
The upcoming 2H25 period still sees at a minimum Section 232 actions and trade negotiations with key partners as the 90-day pause window lapses. Even if Trump extends pauses, the reality is that companies can also delay capital budgeting planning, and consumer demand can fade some more beyond what we already have seen.
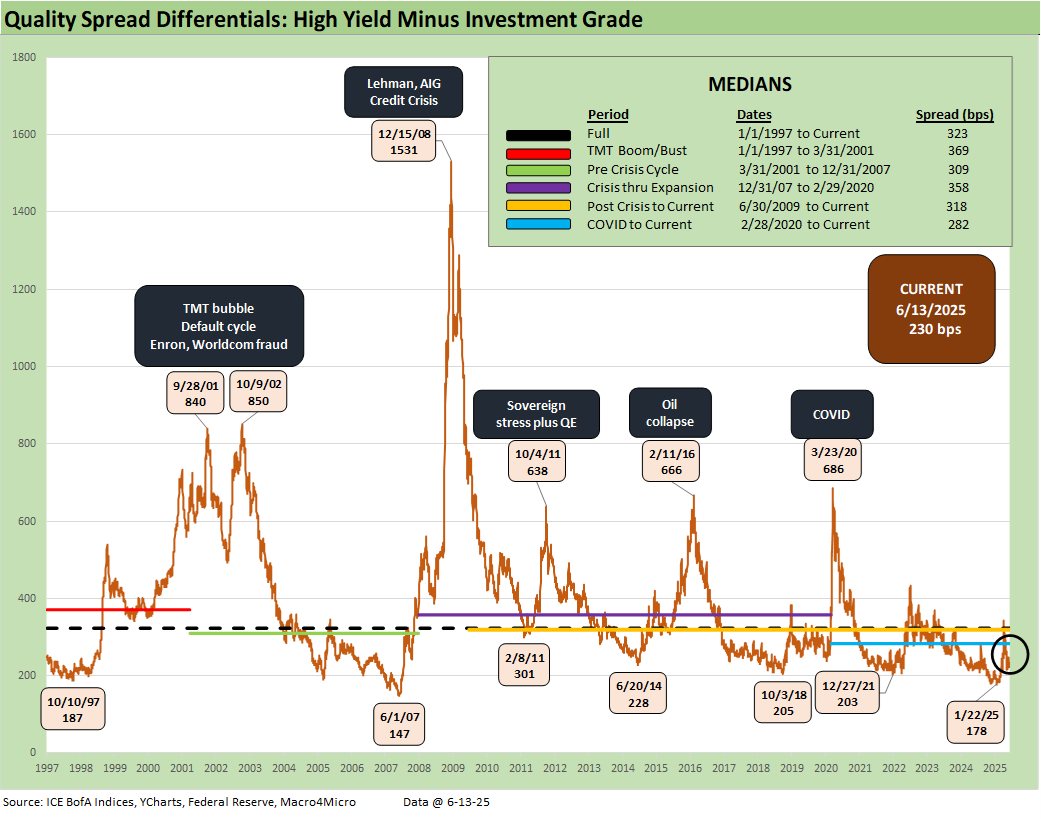
The differential between HY OAS and IG OAS (quality spreads) widened +8 bps this week in line with overall risk. This level remains tight in historical context, but the recent period sees IG and HY sharing a closer relationship given the IG quality shift towards BBB and HY quality skew towards BB. The increase this week leaves this measure well inside the post-COVID median and now in line with the 2014 low of +228 bps. There is still room relative to the frothiest periods of cyclical histories, and the market had cracked the +200 bps line earlier in 2025. The +147 bps in June 2007 in the chart was one for the ages.
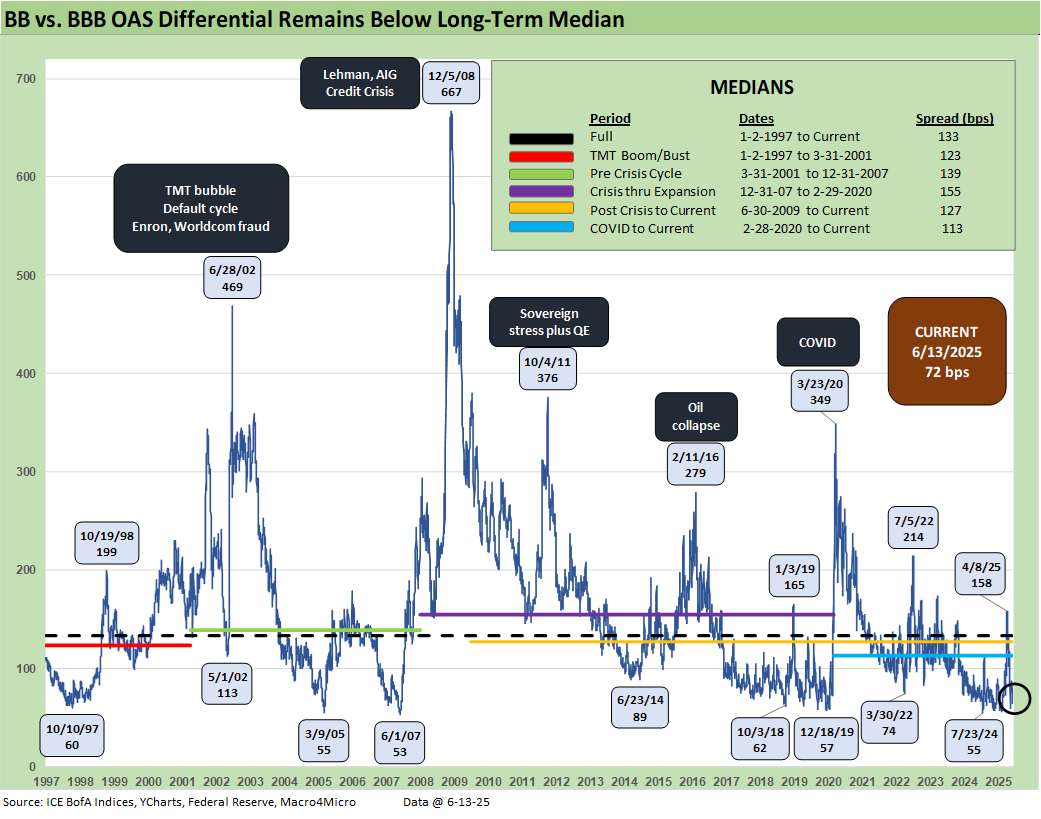
The “BB OAS minus BBB OAS” quality spread differential widened +7 bps this week on the modest quality spread decompression move. The move this week leaves this quality spread measure still in low territory and hovering near past cyclical lows. This metric has stayed lower in recent history given the convergence in credit quality of the tiers and the core investor base, as the post-COVID history shows. At current levels, we are still two good rally weeks in the BB tier away from record lows in this metric.
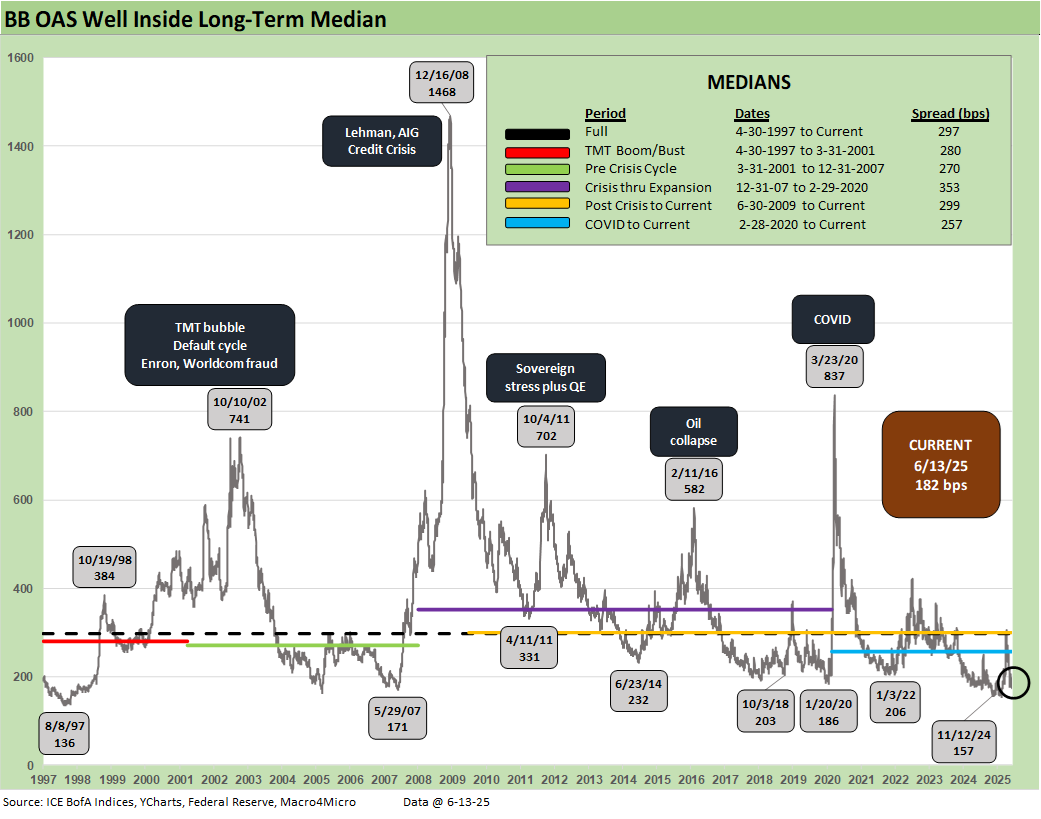
The BB tier tightened +7 bps since last week to +182 bps, well below the 2014 and 2018 cyclical lows and closer to levels seen in May 2007. The combination of low duration and a high-quality diverse mix of BB tier names leads to this being the best performer in credit this year. We had earlier addressed the decent total return performance and positive excess return given -4 bps of tightening YTD.
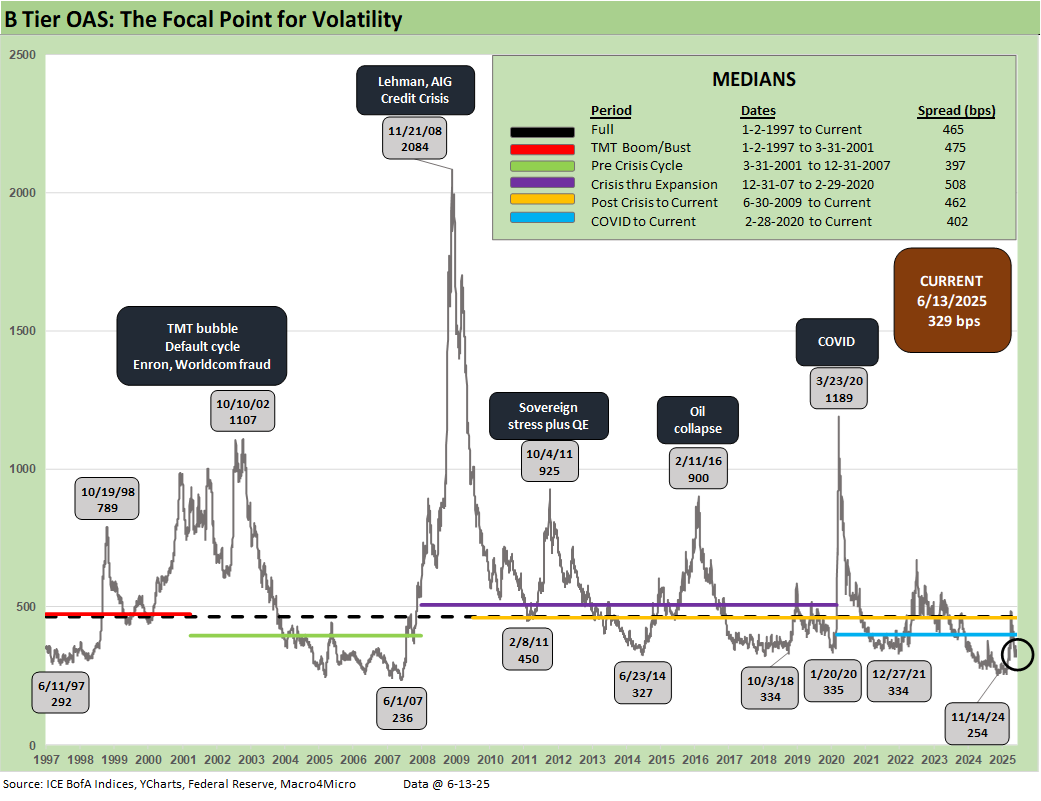
The B tier widened +9 bps this week up to +329 bps. The reciprocal tariff whipsaw reminded the market how volatile this layer of credit can be as spreads briefly moved above the long-term median at +486 bps. The relief rally has recovered -157 bps tighter since. The current level returns right back to the 2014 and 2018 lows. At only +33 bps wider YTD, the risks appear skewed to widening again with increasing layers of risk in the market, as we see these levels as offering inadequate compensation for the array of trade risks still in the market.
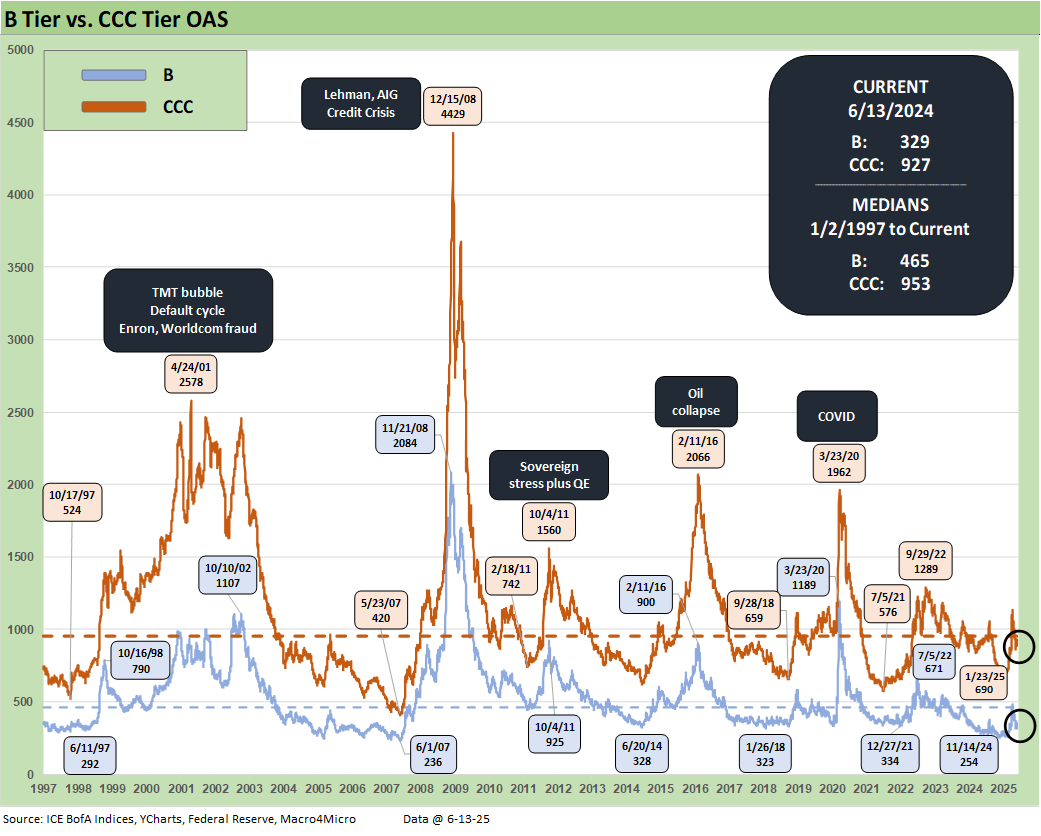
The B vs. CCC tier OAS time series is plotted above. The timeline for B and CCC spreads highlights the points of major divergence along the way (see The B vs. CCC Battle: Tough Neighborhood, Rough Players 7-7-24).
The current CCC tier OAS at +927 bps widened by +12 bps the past week though remained under the long-term median of +953 bps. The CCC YTW is still above 13%, at 13.37% after being above 14% just last month, but the underlying constituents are widely dispersed across an 81.37 composite dollar price. The CCC tier is still in the pricing zone of equity risk-returns with such yields.
CCC investing at this point demands careful capital structure analysis and rigorous issuer-level relative value research with DISH Network a prime example of that last week. Subject to how the tariff policies play out and how the stagflation wildcard unfolds, the distressed players are warming up. Costs will still be rising even as pauses and deals start to roll in at some point.
The tariff wildcards for spread decompression…
The recent volatility was a brief reminder of the kind of B vs. CCC divergence that can happen in a hurry as markets reprice. Further tariff chaos still has the potential to repeat that volatility with recent US-China truce and EU tariffs flashpoints that are avoided for now.
The US has been getting a taste of what China trade means as shipping and port activity was in semi-collapse and the countdown to empty shelves was highlighted by major retailers. More recently, the production chain warnings and rare earths and magnet shortages were showing alarming threats highlighted by numerous companies and in the auto trade literature. It was framed as more threatening than the post-COVID semiconductor shortages that reduced auto production by 17 million units from 2021 to 2023 (source: Automotive News). The fact that semis are on the Section 232 list will keep a lot of risk in the picture ahead.
The potential economic damage that could come in the summer and into the fall is still a gathering storm with the wide array of tariffs in the queue. The scale of the China shutdown was more immediate and far more serious, and you cannot rule out that chaos coming back. A 50% EU tariff could have seen similar dislocation for many industries. At least the more extreme outcomes are lower probability (for now), and those hits to prices and expense lines are mitigated (but can be revisited in a tit-for-tat retaliation scenario).
Another increase in Section 232 tariffs on Steel and Aluminum raised the bar again for retaliation from major partners, especially EU and Canada (see Tariffs: Testing Trade Partner Mettle 6-3-25). We would argue that there is nothing quite like the China risk that was in evidence before the truce even if China is the #4 trade partner and EU #1.
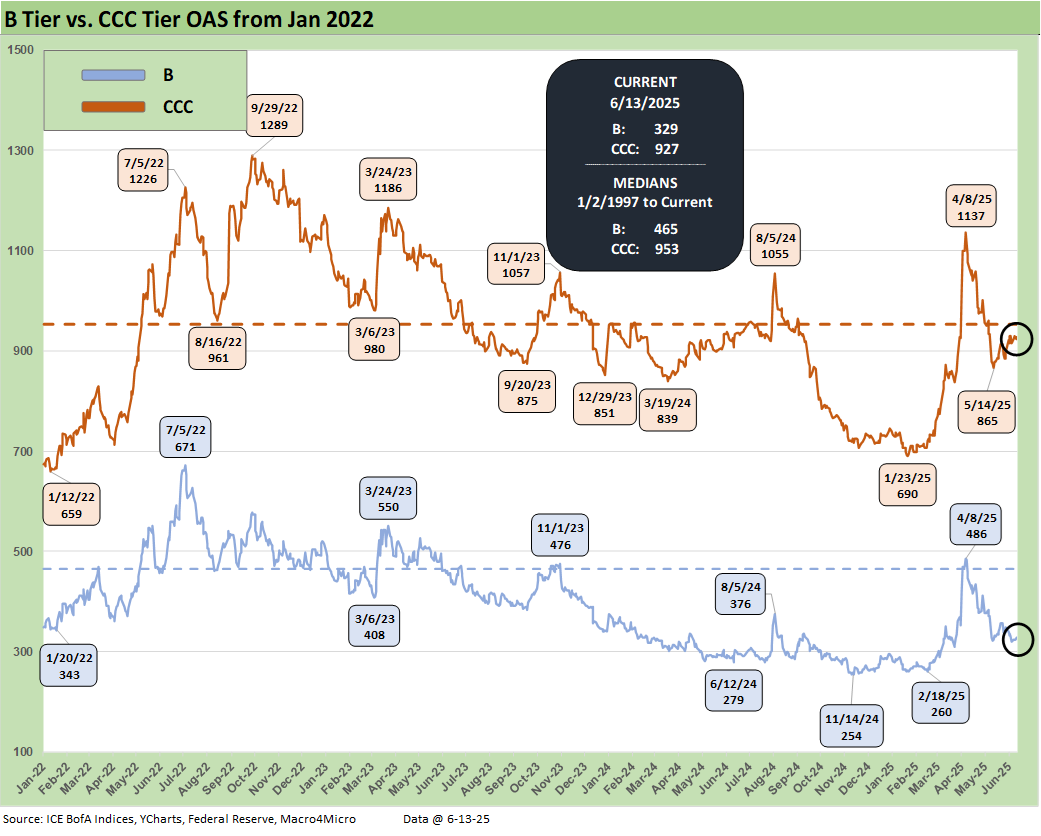
The shorter timeline from Jan 2022 just ahead of the end of ZIRP and start of the tightening cycle gives better granularity on the movements from a low for CCCs of +659 bps in Jan 2022 to a peak of +1226 bps in July 2022 and +1289 bps to end Sept 2022. Then spreads came down to the Jan 2025 tights of +690 bps ahead of the recent spike and whipsaw to current levels.
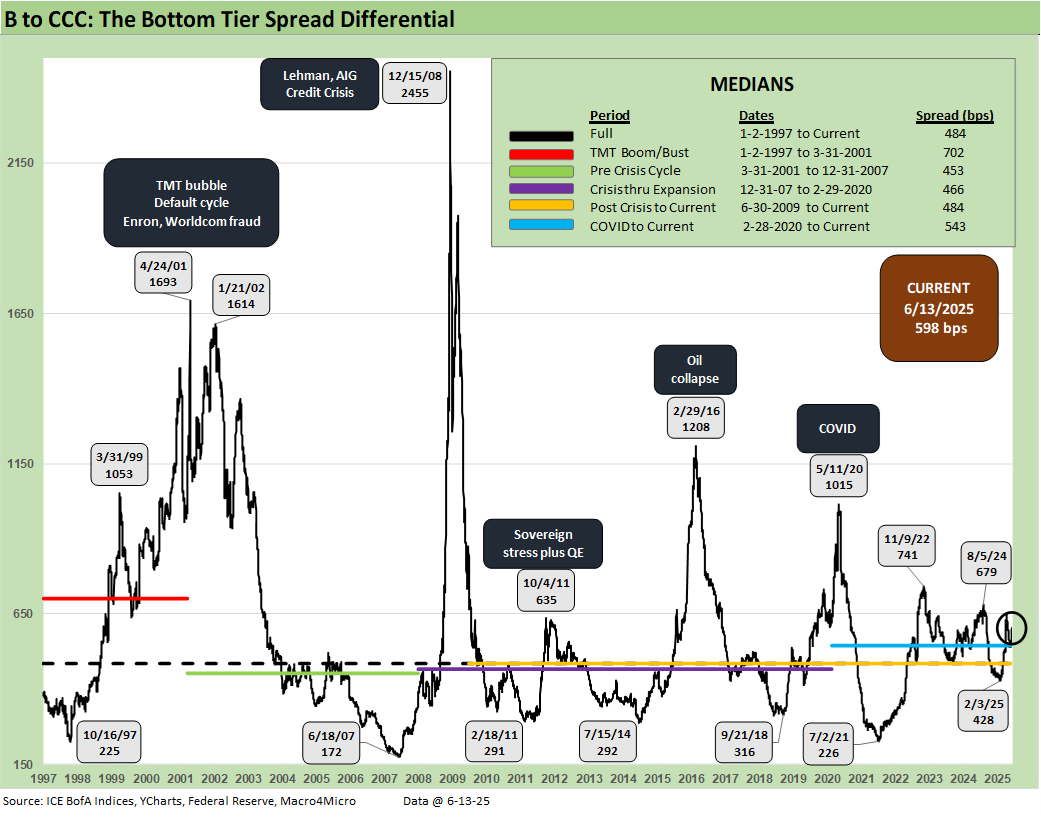
The B vs. CCC tier differential is broken out with the current +598 bps still higher than the long-term median and above the distinct market time horizons with the exception of the TMT HY credit cycle with its +702 bps median. The risks this year have seen CCC tier spreads remaining wider after the earlier whipsaw even as the rest of the tiers have rallied.
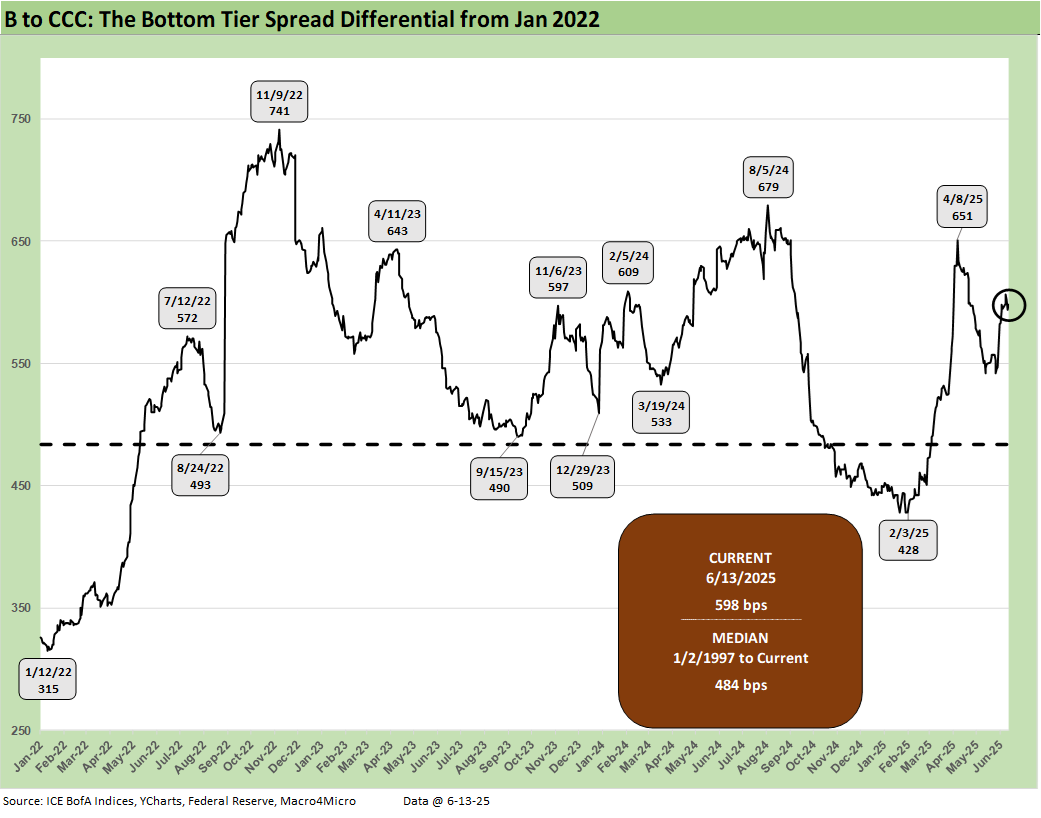
The above chart frames the “B vs. CCC tier” quality spread differential across the short timeline for better granularity. Spreads widened with a vengeance since the low of Feb 2025 at +428 bps even if quality spreads recovered from the early April spike to +651 bps on April 8.
A look at yields…
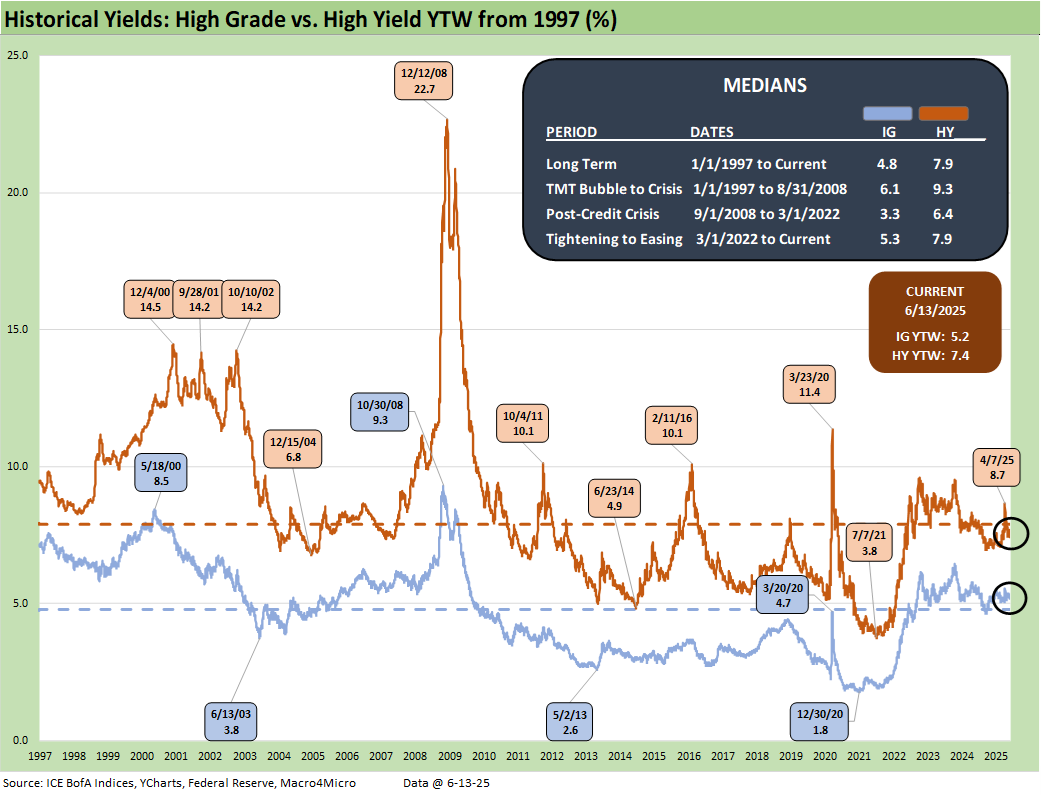
Moving away from spreads, which are well below long-term medians this week, yields for both IG and HY have a more complex story in historical context given the post-crisis distortions of ZIRP and “normalization.” The normalization period of Dec 2015 to Dec 2018 never really got on track with the economic weakness and Fed easing of 2019 followed by a COVID crisis and return to ZIRP in Mar 2020 (ZIRP ended March 2022).
The current IG YTW at 5.21% (vs. 5.30% last week) decreased as the UST decrease pushed yields lower and remains below the 6.1% pre-ZIRP median on overall YTD UST curve moves.
The HY YTW decreased to 7.43% (from 7.45%) vs. a pre-ZIRP 9.3% median. We consider the pre-ZIRP years the most rational frame of reference in light of the post-crisis ZIRP and QE as well as the COVID Fed reactions.
Spreads will remain a key swing factor for reaching those yield medians of pre-ZIRP years, and we just saw material volatility in credit risk pricing in HY since early April. UST yields are a tougher call with the tariff backdrop that still threatens stagflation as well as the potential for further technically driven upward UST curve shift on the supply-demand fears.
Stagflation risk remains in the debate. Away from stagnation + inflation, old fashioned recession risk would pressure UST rates lower and credit spreads higher, but this is no ordinary cyclical turn. We cover the UST shapeshifting in our separate Footnotes publication on yields as the UST curve lowered this week on the economic data.
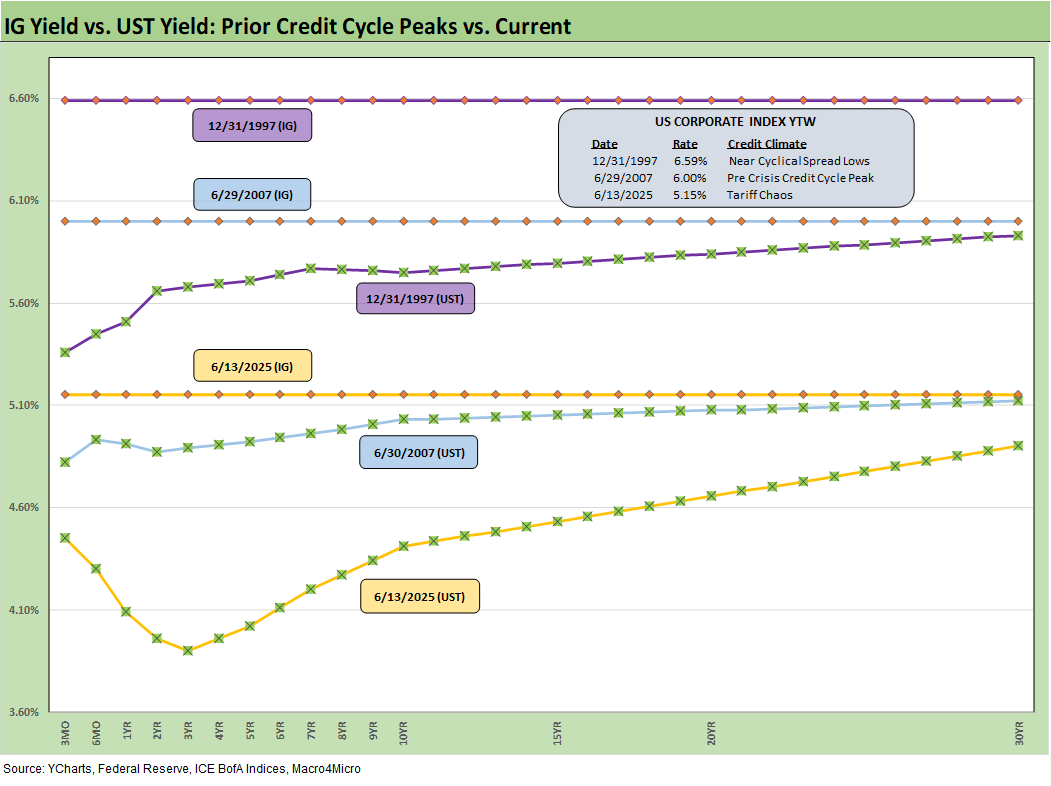
The above frames current IG index yields vs. previous credit peaks along with their respective UST curves. We include both prior credit peaks in June 2007 and Dec 1997 for context as prior peak credit cycles when high risk appetites saw investors chasing yields. Those 1997 and 2000 markets saw poor risk symmetry and low spreads.
Today’s UST curve is still low in those historical credit peak contexts. We just saw a glimpse recently of rising long yields and the return pain that comes with it. Continued focus on the budget this week will return that risk into focus given the possible size of deficit increase. Stagflation risks stay in the mix with the current market beyond the credit cycle peak after the tariffs, and long dated yields still could go higher with spreads widening again for another round of return pain.
The short to intermediate IG market is still the safest bond game for now. The funds that are asset class constrained to HY can take refuge in the higher quality layers, but overall corporate default risks in HY bonds remain in check (private credit is its own distinct story and mix).
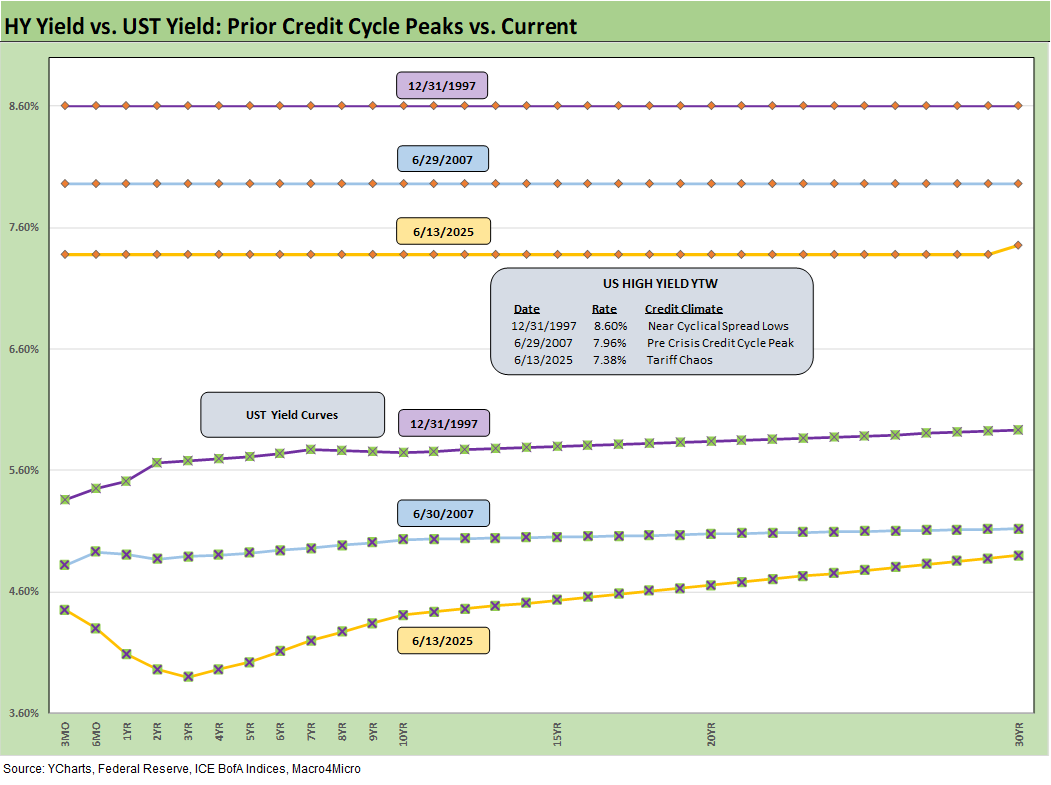
The final chart does the same 1997 and 2007 drill but for HY index yields. This week’s UST move leaves current HY index yields now below prior peak credit cycles at 7.43% vs. 7.96% in June 2007 and 8.60% in Dec 1997. The recent spread widening had moved HY index yields higher, but the recent reversal and rolling UST moves leave the current HY index YTW below both the 2007 peak and 1997 HY index levels.
The widening early this month gave flashbacks to the volatility and major spread moves of the 1997-98 and 2007-08 periods that also posted triple-digit widening months. The sheer speed of risk repricing has happened in earlier cycles even if those moves were for very different reasons.
Finding the catalyst for downside…
Below we roll forward some updated commentary on the credit cycle…
The challenge is identifying a fundamental transmission mechanism to more trouble for financial metrics and relative risks of default. Identifying a catalyst for pain now is easy with tariffs hitting the macro drivers (the consumer) and micro drivers (“buyer pays” hits margins or requires higher prices).
The recent tariff strategy is both unpredictable and unprecedented in modern capital markets, but at least the banks are much healthier. US-China trade talks on deck calm trade nerves again but the most recent Section 232 hike to 50% on steel and aluminum is still a fresh wound. Those are fighting words with key allies (see US Trade in Goods April 2025: Imports Be Damned 6-5-25, Tariffs: Testing Trade Partner Mettle 6-3-25).
The overall uncertainty in getting trade deals over the line remains a threat. Reciprocal tariffs could end up being “assigned” again rather than negotiated. The clock is ticking. Those tariffs will still need their day at SCOTUS based on the IEEPA challenge.
We also see higher quality levels in the HY bond index as a starting point vs. 2007 and the late 1990s TMT bubble years. The reality is the tariff impacts and supply-side disruptions are only now just beginning in substance. It is hard to reflect forward-looking risks when so few know (including the White House) what those risks will be as “pauses” start and could get better or worse. China was a rough lesson for the markets.
EU now joins China on the pause clock that can be terminated or extended with ease, but Mexico and Canada have outstanding trade war risk as the effects of the tariffs roll in and domestic political pressure picks up for leaders. It is useful for Trump to play his hand as the mood moves him in his own murky game theory plan, but corporate investment, big ticket purchase decisions by consumers, and FOMC policy setting can also take a protracted break beyond the pause.
The bad old days…
Looking back even more, the turn in the credit cycle always comes at some point and often with an external trigger or “assist” that can set it off. During 1990, securities firms started to collapse including Drexel’s Chapter 11 in Feb 1990 and bridge loan related bailouts of Shearson Lehman, First Boston, and Kidder Peabody. We do not face that type of financial intermediary meltdown risk here (at least not yet!). In a protracted stagflation bout, eyes will return to the regional banks.
The summer of 2007 was the start of major problems in the credit markets with asset risk and leveraged counterparty exposure and bank/broker interconnectedness risk soaring. Despite that backdrop that worsened in August 2007, the equity markets and S&P 500 and NASDAQ kept on rallying into Oct 2007. Later in the turmoil and well after the fact, the start of the recession was tagged as Dec 2007 (see Business Cycles: The Recession Dating Game 10-10-22).
The 2007 experience reminded the market that credit leads the cycle and equity lags. The same was true in 1999 with the HY default cycle underway and NASDAQ at +86% that year. This time around, the credit markets did not expect the tariff insanity and is still making up its mind. The real economic effects are more geared to the periods ahead when tariffs will be rolling in at the transaction level. That will be the reality point. We expect HY to stay unhappy and spreads to average wider as the tariffs roll into actual corporate fundamentals.
There are no frictionless wheels in high tariffs. The buyer pays the tariff at customs (literally writes the check). How that gets spread around the seller to buyer to customer chain has a lot of moving parts. The “seller pays” and “selling country pays” has been a clear lie from the Trump camp, and he admitted as much when he demanded that Walmart “eat” the tariff cost. Why would there be anything to eat if the seller pays? Shady and misleading discourse is never new to Washington.
The problem is that Trump recently highlighted yet again the hundreds of billions he collected from selling countries. We cannot tell what Trump remembers as a fact and what he made up. Until the tariff deals are put to bed, outsized “surprise risk” in tariffs remains high on the list. Since he breached the USMCA, even a deal is not a reliable deal. Congress has allowed him to declare an emergency at will. Now SCOTUS will need to decide.
See also:
Footnotes & Flashbacks: State of Yields 6-15-25
Footnotes & Flashbacks: Asset Returns 6-15-25
Mini Market Lookback: Deus Vult or Deus Nobis Auxilium 6-14-25
Credit Snapshot: Hertz Global Holdings 6-12-23
CPI May 2025: The Slow Tariff Policy Grind 6-11-25
Footnotes & Flashbacks: Credit Markets 6-9-25
Mini Market Lookback: Clash of the Titans 6-7-25
Payrolls May 2025: Into the Weeds 6-6-25
Employment May 2025: We’re Not There Yet 6-6-25
US Trade in Goods April 2025: Imports Be Damned 6-5-25
Past-Prologue Perspective for 2025: Memory Lane 2018 6-5-25
JOLTS April 2025: Slow Burn or Steady State? 6-3-25
Tariffs: Testing Trade Partner Mettle 6-3-25
Mini Market Lookback: Out of Tacos, Tariff Man Returns 5-31-25
PCE April 2025: Personal Income and Outlays 5-30-25
Credit Snapshot: Meritage Homes (MTH) 5-30-24
1Q25 GDP 2nd Estimate: Tariff and Courthouse Waiting Game 5-29-25
Homebuilder Rankings: Volumes, Market Caps, ASPs 5-28-25
Durable Goods Apr25: Hitting an Air Pocket 5-27-25
Mini Market Lookback: Tariff Excess N+1 5-24-25
New Home Sales April 2025: Waiting Game Does Not Help 5-23-25
Existing Home Sales April 2025: Soft but Steady 5-22-25
Credit Snapshot: Lithia Motors (LAD) 5-20-25
Home Starts April 2025: Metrics Show Wear and Tear 5-19-25
Industrial Production April 2025: CapUte Mixed but Time Will Tell 5-15-25
Retail Sales April 25: Shopping Spree Hangover 5-15-25
Credit Spreads: The Bounce is Back 5-13-25
 |
|