
Footnotes & Flashbacks: State of Yields 6-15-25
The UST curve has a big week ahead with an FOMC meeting, the busy tariff pipeline and now the Mideast oil price scenarios.


How about a game of unilateral nuclear disarmament?
The problem with game theory is that there comes a time when someone is no longer playing (or no one is playing). Israel has reached that point. Now the question on “no nukes” moves to Iran. The goal is clear in the Middle East war, and it comes down to how much destruction unfolds to get there. There is also the question of the US joining at some point.
The FOMC meeting will bring all eyes to the dot plot and the latest median views on year end 2025 PCE inflation, unemployment rates, and target fed funds. The GDP forecast is always in the mix, and it will be interesting to see if the Fed view follows the forecasts from the OECD (1.6% US GDP forecast for 2025) and World Bank (1.4% for 2025) or if they will move the current FOMC median lower from the 1.7% posted in the March 2025 forecast (down from 2.1% in Dec 2024).
The troubling mix of variables for the UST curve includes soaring tariffs into 2H25 including the wave of Section 232 proposals. The curve now also faces the rising risk of an oil shock or at least a material increase in prices near term, and all of that is set against modestly slowing overall macro data. The balance of releases so far do not scream “easing” but might be enough if the tariff threat did not lurk.
Trump will keep raging for -100 bps (4 cuts), but it would help if he admitted the buyer “writes the check” to customs on the tariffs and that he never collected hundreds of billions from selling countries (in recent weeks, during live comments, he even stated $600 billion was collected from selling countries). That admission of fact will not happen, so his macro views lack any factual and conceptual substance apart from the power of the seat.
Below we update our rolling State of Yields footnotes with data updates and some new commentary woven in.
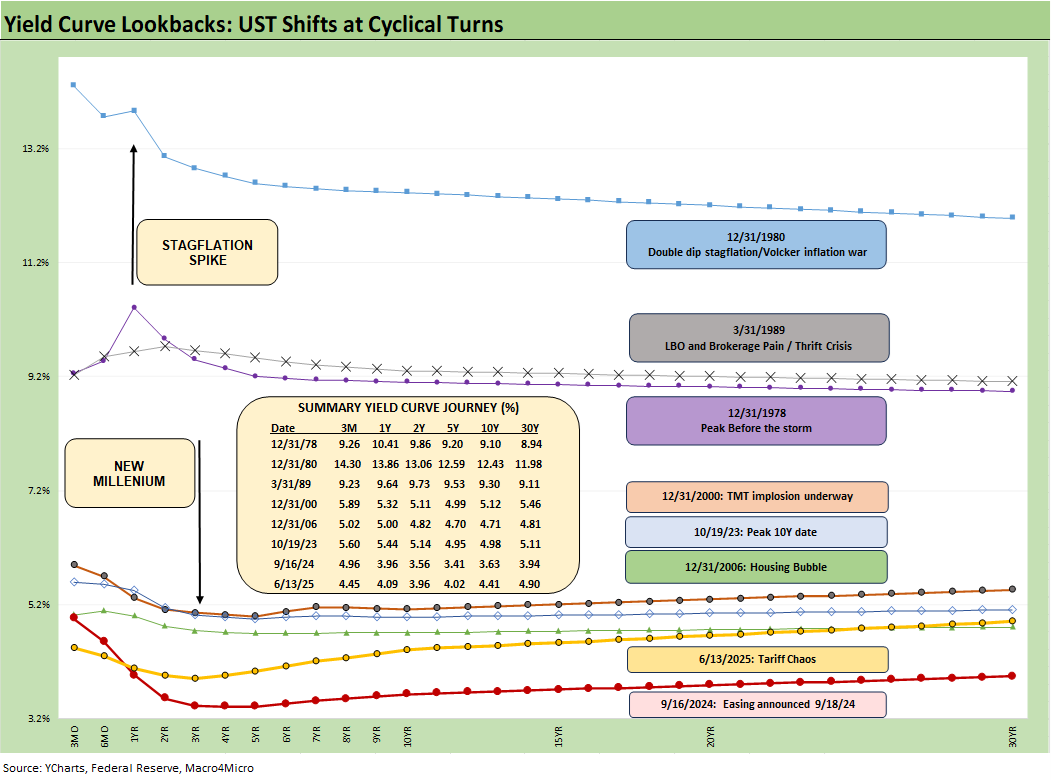
The above chart plots some key cyclical transition periods from the Carter inversion of 1978 across the Volcker years, the1980s credit cycle peak in 1989 (note the 9.2% 3M UST), the TMT cycle faltering in 2000 (on the way to a massive Greenspan easing in 2001), and the housing bubble in 2006. During the 2004 to 2007 period, leveraged derivative exposure and structured credit was out of control and counterparty risk was soaring.
The chart then jumps from 2006 to 2023 beyond the crisis period and the ZIRP years and COVID after the Fed went wild to save the capital markets and support the banks. That brought plenty of QE and normalization distortions of the curve shape. Steeper and higher was not the forecast to start 2024, and the curve has moved in an adverse direction since the Sept 2024 easing even with the modest YTD rally.
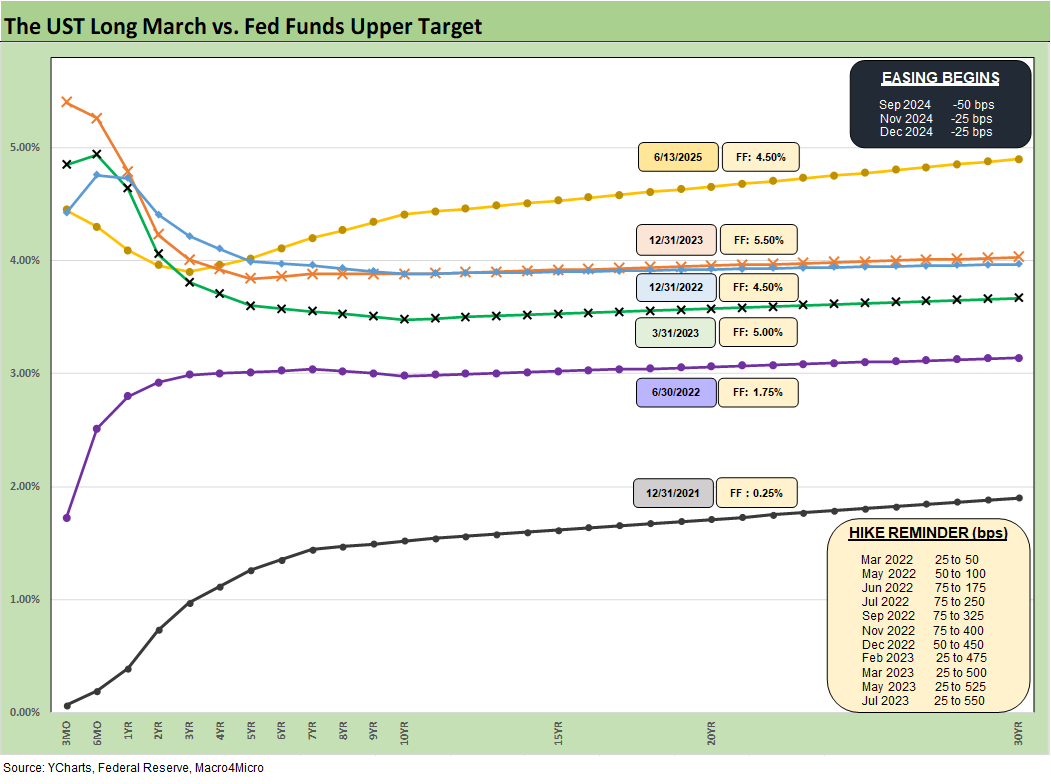
The above replays our weekly chart detailing the migration of the UST curve from 12-31-21 with memory boxes detailing the tightening dates and magnitude and more recently the easing. The UST curve seems to intermittently mix bear steepening patterns and flattening rallies since the Sept 2024 lows, but market fear was creeping into the shapeshifting after Liberation Day before calming down with the pause.
We shifted back into the bear steepening along the way while mixing in some mini rallies. The UST curve will not be helped by record supply and shrinking demand, fears around the dollar, and diminished confidence in US governance. We are looking at the highest risk of stagflation since the1980-1982 double dip, and tariffs will certainly not help.
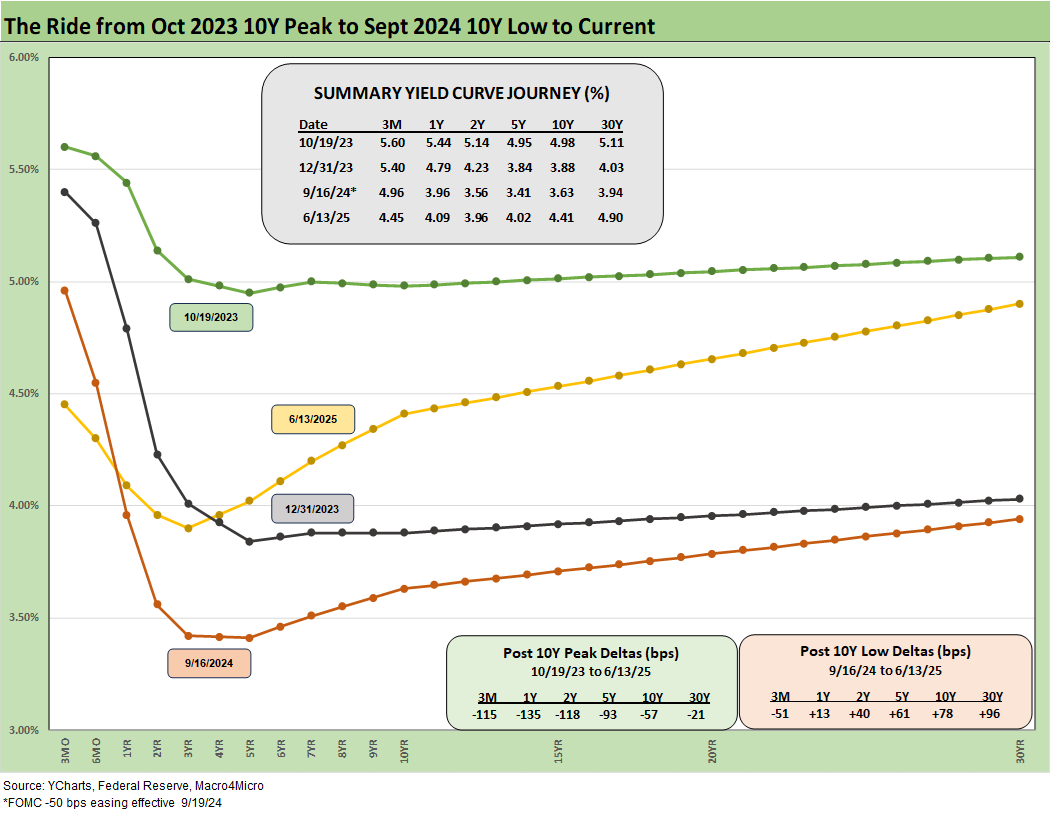
The above chart details the material move from the peak UST curve of 10-19-23 down into the UST bull rally of Nov-Dec 2023 and then eventually into the lows of Sept 2024. The Sept 2024 low tick only came after a bear steepener hit the curve through the summer of 2024. We then moved back into the bear steepener mode until the tariffs roiled the UST markets and initially sent 2Y to 30Y lower on cyclical fears.
The shift higher from Sept 2024 lows and the steepening from the low point at the end of 2023 is in the chart. We see the 10Y and 30Y notably higher with a more normal shape from 2Y out to 30Y. The challenge is still that front end inversion from 3M. This week we look at the 3M to 5Y to UST slope history further below. The inversion anomaly during a protracted expansion has been hard to shake with the FOMC holding the line over tariff-related inflation questions.
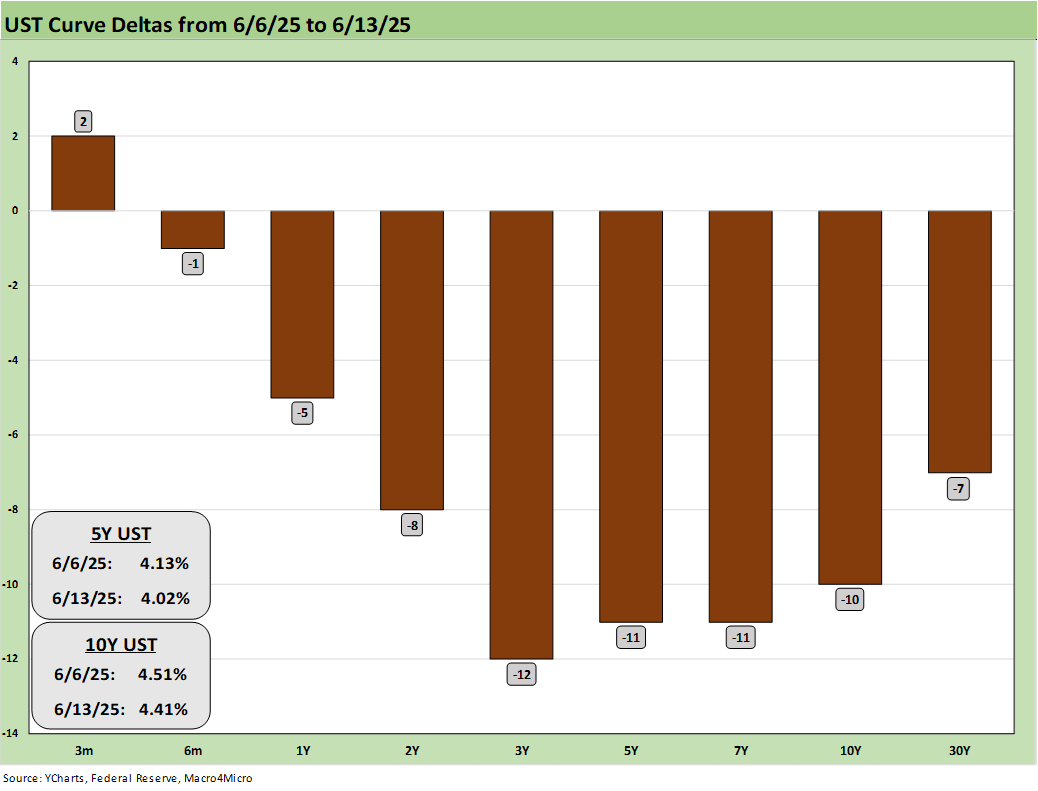
The above breaks out the weekly UST deltas that we already looked at in Mini Market Lookback: Deus Vult or Deus Nobis Auxilium 6-14-25). The UST curve pushed higher during the prior week on good economic news with JOLTS and the Payroll numbers both constructive (Payrolls May 2025: Into the Weeds 6-6-25, Employment May 2025: We’re Not There Yet 6-6-25, JOLTS April 2025: Slow Burn or Steady State? 6-3-2). Then this week reversed and rallied with support from decent CPI and PPI numbers.
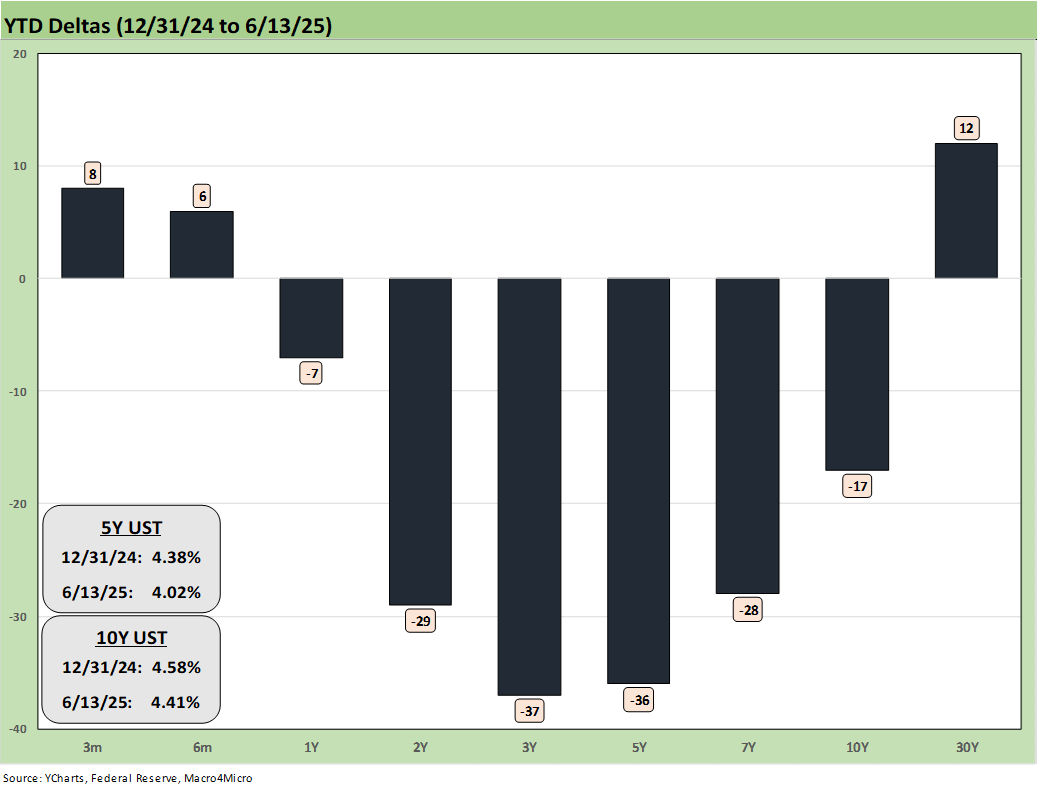
The YTD UST deltas are broken out above. We still see a rally from 2Y to 10Y, but the 30Y relationship had been breaking down in recent weeks before this week’s rally. All 7 bond ETFs are in positive range YTD (see Footnotes & Flashbacks: Asset Returns 6-15-25).
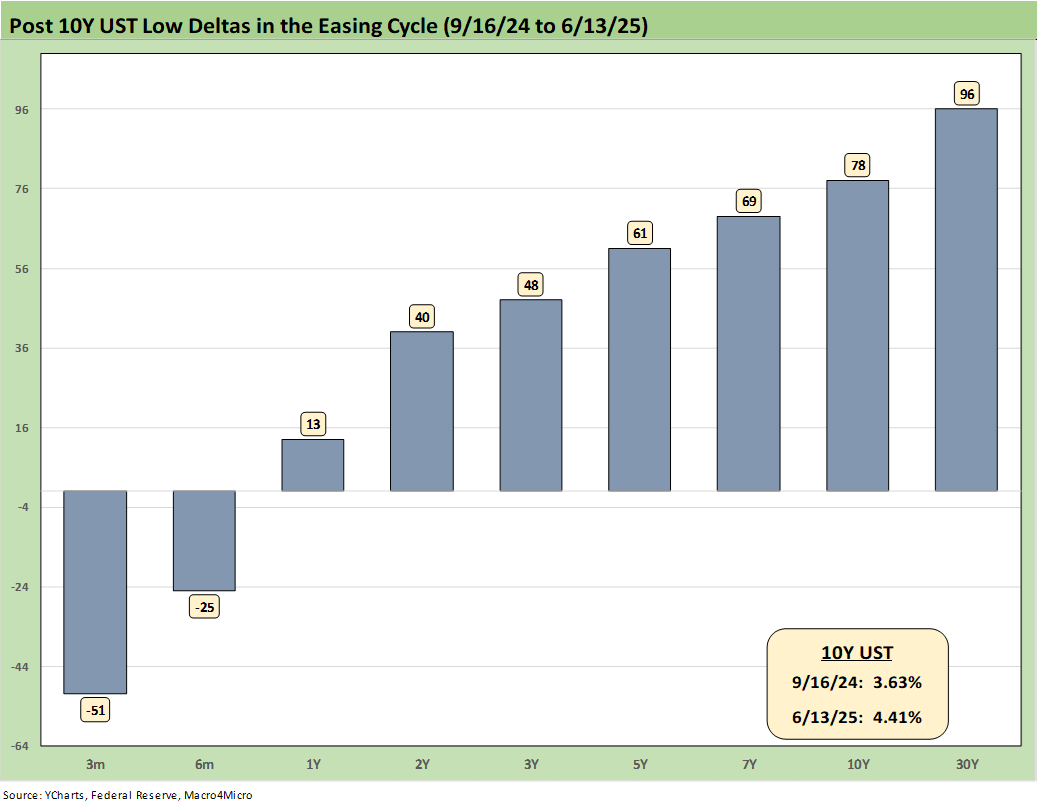
The above chart updates the UST deltas since the 9-16-24 lows that came alongside the easing. That has not worked as many market watchers predicted on the shape of the UST curve and number and pace of easing that was supposed to follow. While Trump continues to rail at the Fed and Powell, demanding 100 bps in cuts, the FOMC would likely be easing if it was not for Trump’s over-the-top and unprecedented tariff game plan. Easing would appear to need a jobs setback that has not appeared in recent releases. The summer period should answer some questions on the initial price vs. cost impacts of tariffs.
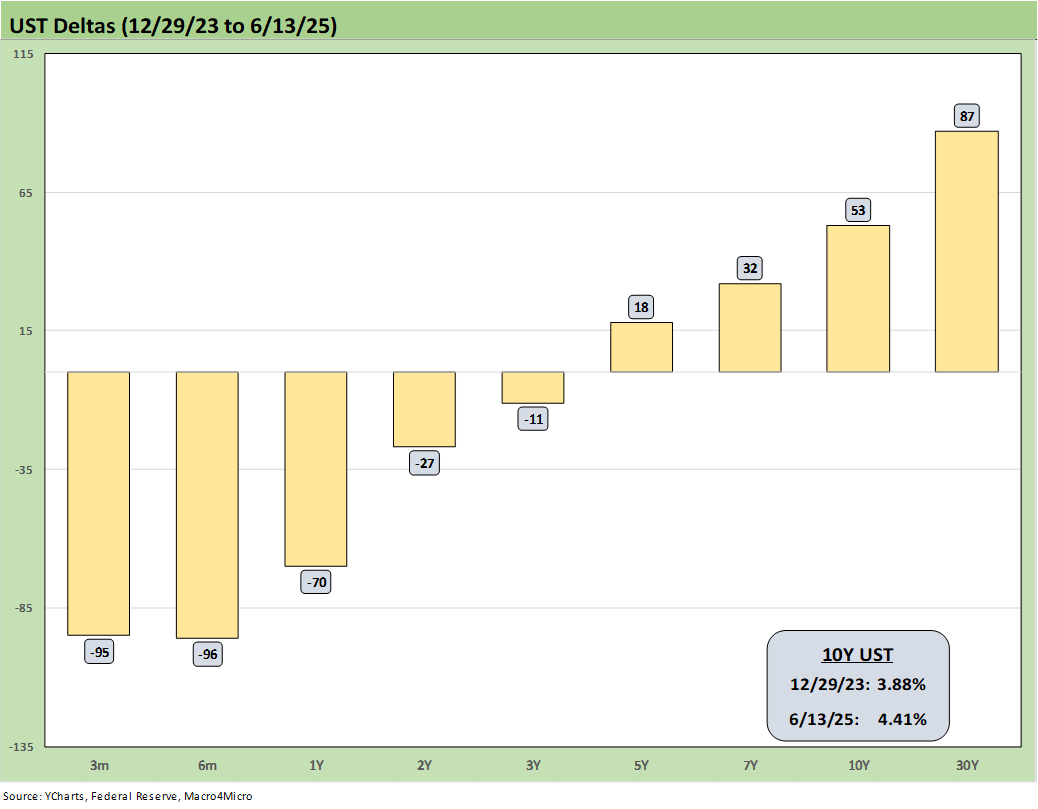
The above chart updates the UST deltas from the end of 2023 after a massive rally in rates and risk in Nov-Dec 2023. The follow-on in 2024 per the consensus mildly disappointed the UST bulls in the number of FOMC cuts (the market got 4 x 25 but not the number of 5 to 6 FOMC 25 bps cuts expected). The expectation of a pronounced bull flattening during 2024 also did not play out when a bear steepener prevailed by the end of the year. As detailed in the earlier chart, the 2025 period has fared better for bonds on a modest bull steepener.
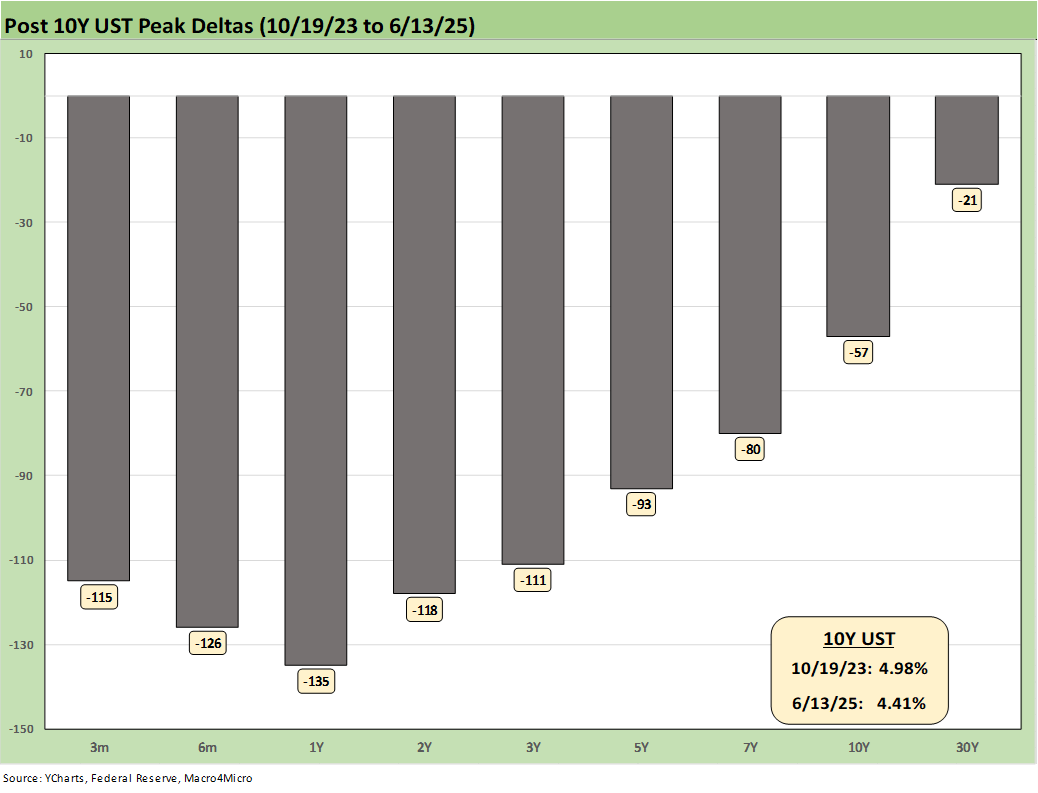
The above chart updates the running UST deltas from the 10-19-23 peak date of the UST 10Y when it barely missed the 5.0% line. For those looking for a frame of reference on what a bad move in inflation metrics might mean, these deltas at least offer a recent set of data points during an inflation fighting year such as late 2023 and into 2024 (until Sept 2024 began the easing process). That is why we keep revisiting that timeline. It reminds us what reversion could mean.
These rally deltas could reverse in part or in whole with the wrong inflation outcomes. We don’t need to see 2022 again, but the old saying “It happened before, it can happen again” resonates for many.
Losing a rally of -57 bps in the 10Y UST above would hurt the mortgage market and would lead to a material valuation headache in equities, M&A economics, and capital project planning. Mortgages have been a drag on housing for both new and existing home sales. The risk of inflation heading the wrong way would do more damage. Stubborn rates or higher rates in the short end to 5Y would damage consumer durables financing and related volumes.
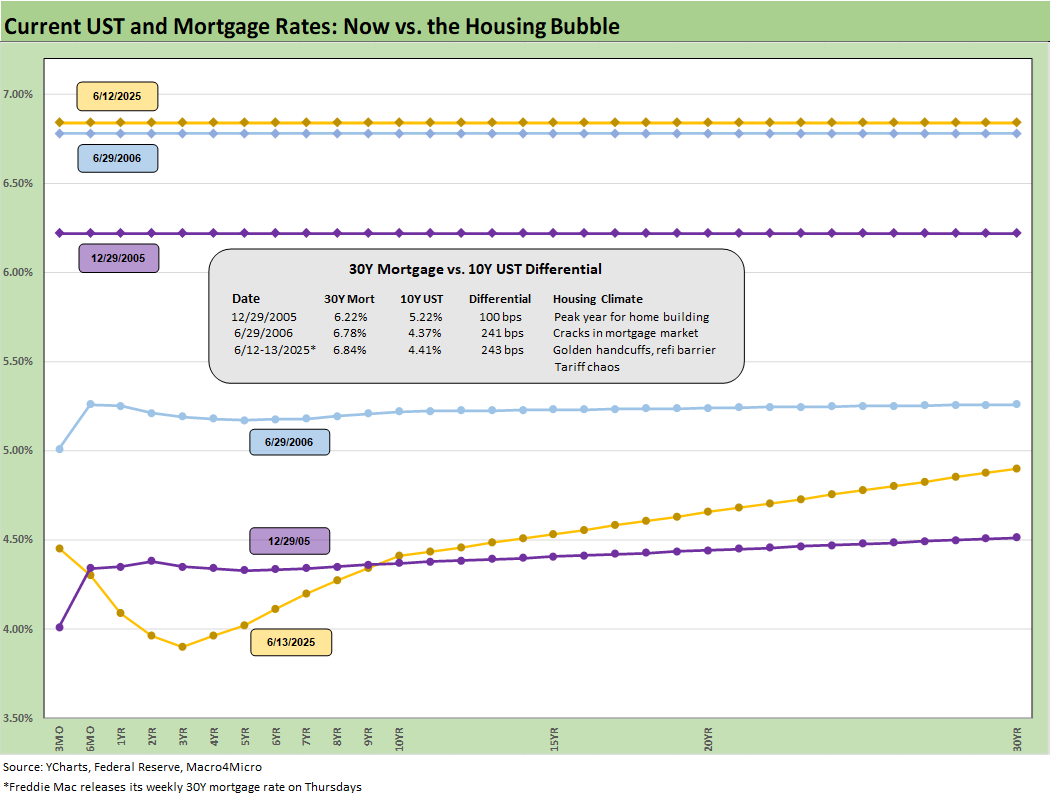
The above chart is one of those replay slides we update each week. This one posts the UST curve for this past Friday and the Freddie Mac 30Y Mortgage benchmark rate (noon Thursday release). We include two useful historical periods including the peak homebuilder year end of 2005 and mid-2006 when RMBS quality concerns were catching headlines as the housing bubble was peaking.
We post UST curves for each period in the chart. The past week saw rates move lower to 6.84% from 6.85% after 6.89% the prior week. We have seen minor moves recently after a 200 bps range since fall 2023. The Mortgage News Daily survey ended Friday at +6.89%.
We include a column above detailing the differential between the Freddie Mac 30Y and the 10Y UST. That differential moved higher this week to+243 bps from +234 bps last week. The year 2005 posted a differential of only +100 bps and makes a statement on what the mortgage market was like in 2005. The mortgage market was very hot back then in the housing bubble as mortgage volumes soared during that peak homebuilding year and a very busy period of refinancing was running alongside as a source of funds for homeowners.
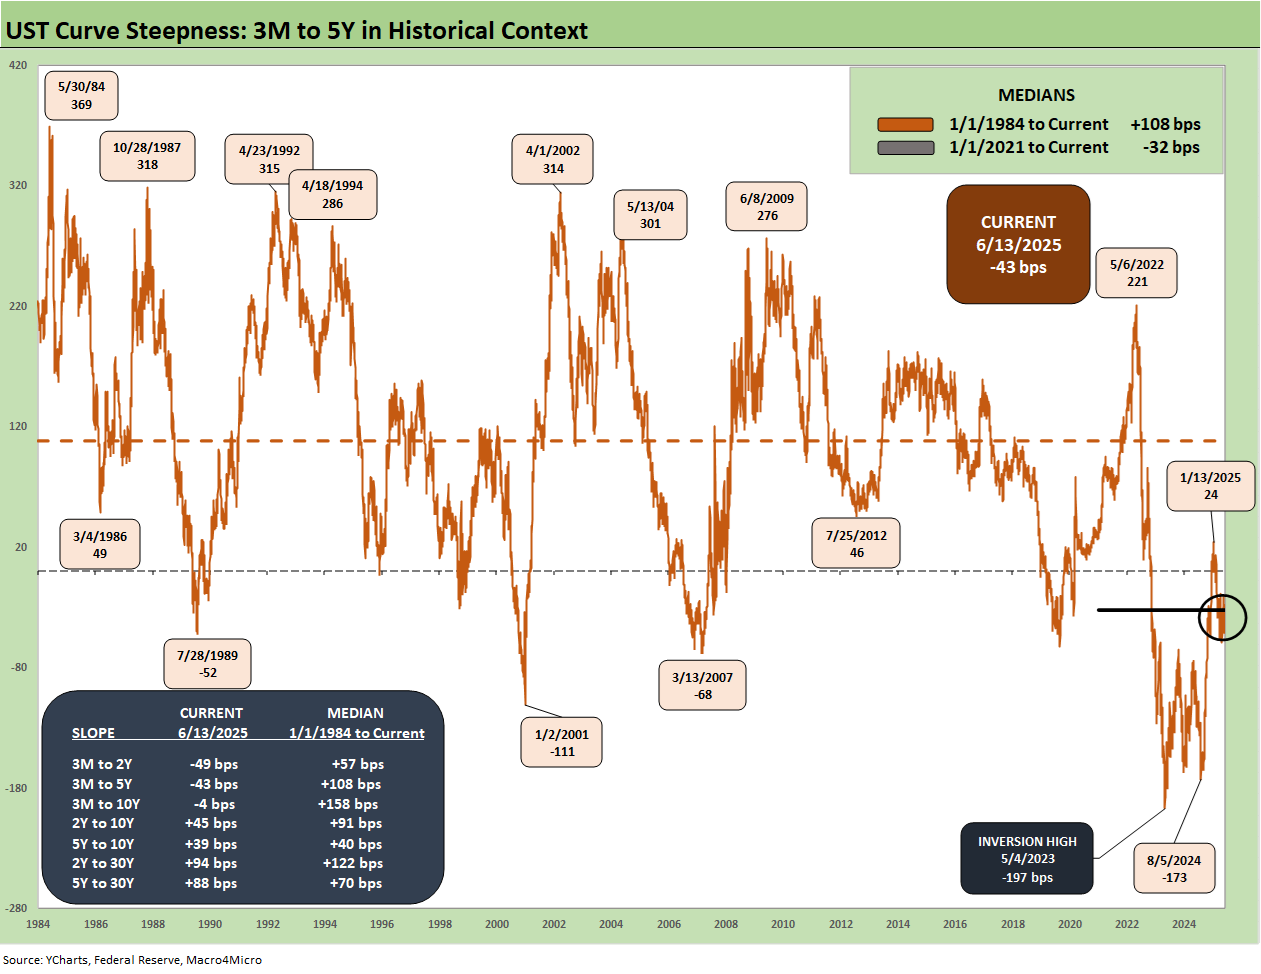
We update the 3M to 5Y UST curve slope above since 1984 with the current inversion of -43 bps radically different from the long-term median of +108 bps. We also include the slopes and long-term medians of the other curve segments we watch.
The inversion remains an anomaly, but the market is also coming off the first inflation spike since the early 1980s. Another anomaly is the phase-in of widespread high tariffs with many more to come. The policy in process has never happened in the modern capital markets era. The FOMC needs to exercise caution to deal with such a threat to goods pricing.
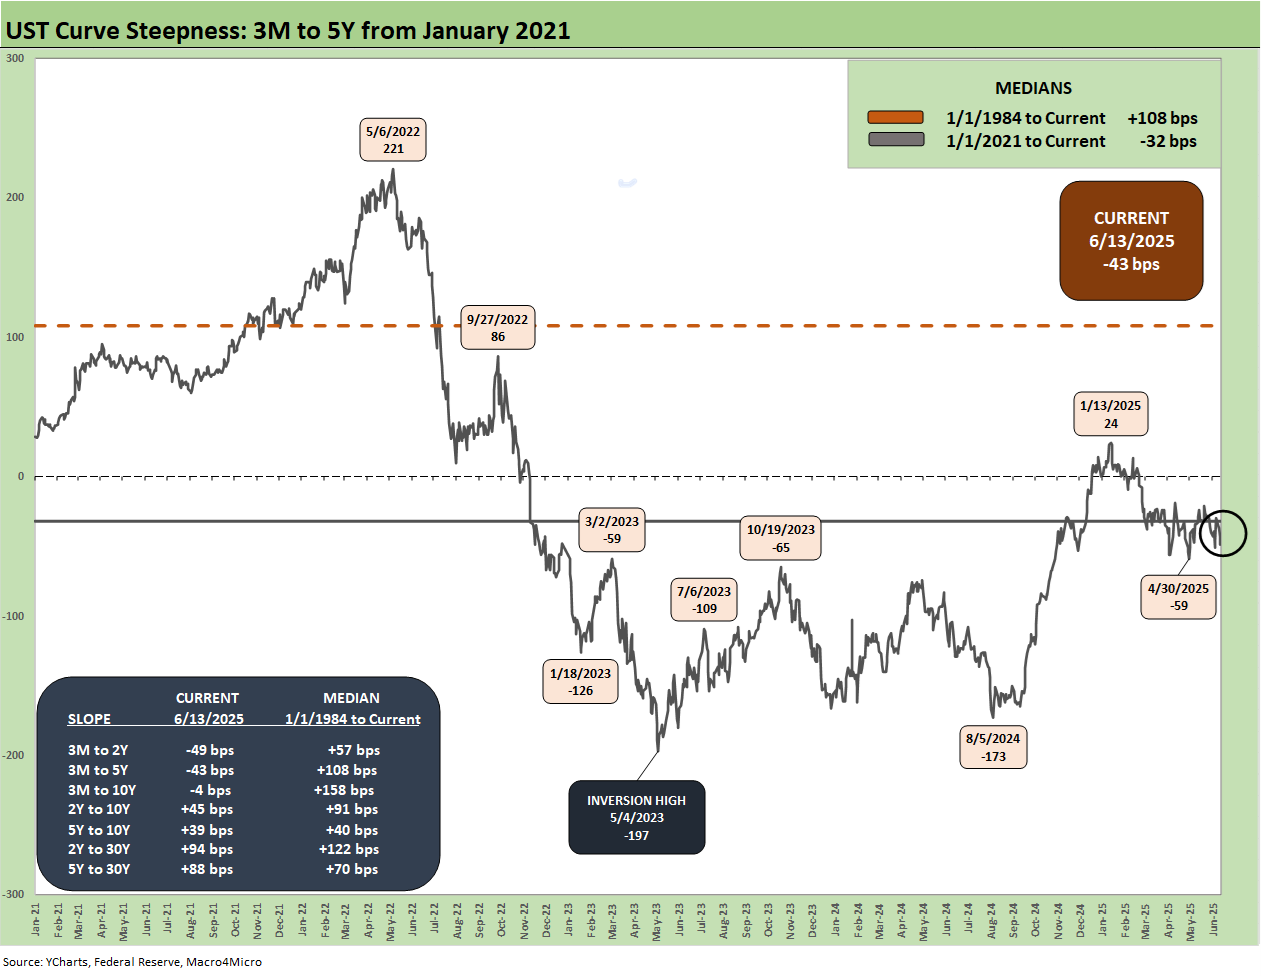
The above chart shortens the time horizon from early 2021 and ZIRP on through the tightening cycle and into the easing period and recent moves. We see a peak slope of +221 bps in May 2022 down to a peak inversion of -197 bps in May 2023 and then the swing back to positive and back down to the current -43 bps.
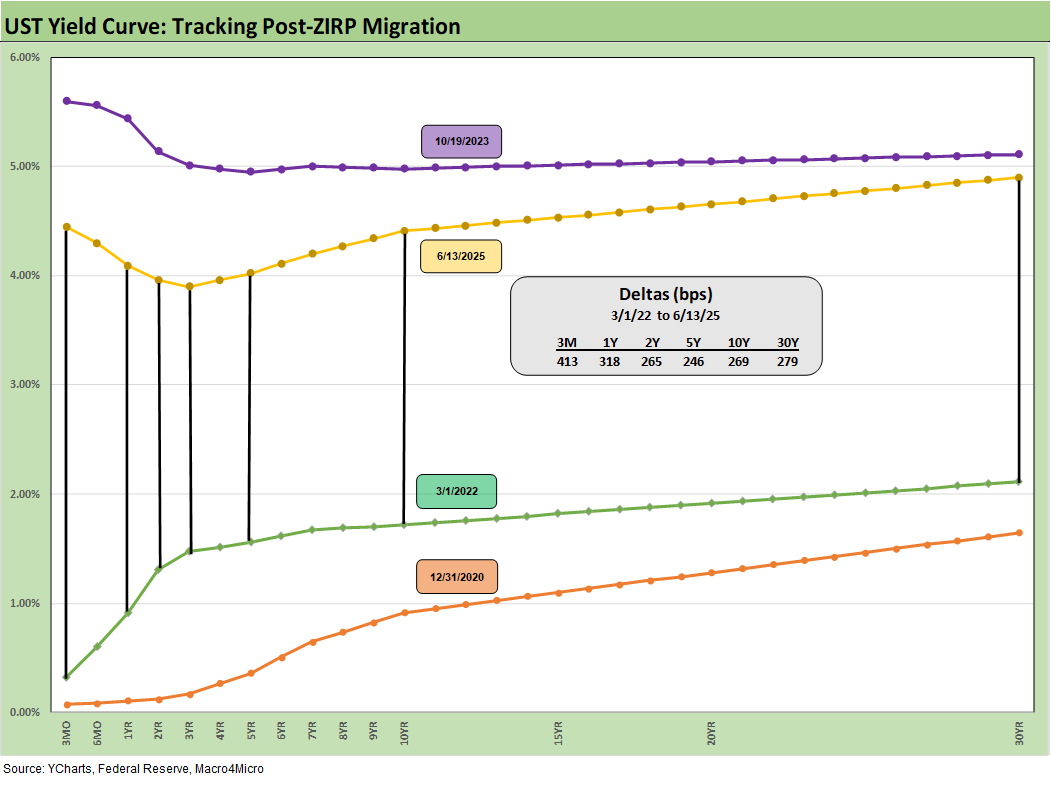
We wrap this week’s State of Yields with an update of the running UST deltas since March 1, 2022 just ahead of the end of ZIRP (effective 3-17-22). We include the 12-31-20 UST curve and 10-19-23 peak UST curve as frames of reference.
See also:
Footnotes & Flashbacks: Asset Returns 6-15-25
Mini Market Lookback: Deus Vult or Deus Nobis Auxilium 6-14-25
Credit Snapshot: Hertz Global Holdings 6-12-23
CPI May 2025: The Slow Tariff Policy Grind 6-11-25
Footnotes & Flashbacks: Credit Markets 6-9-25
Mini Market Lookback: Clash of the Titans 6-7-25
Payrolls May 2025: Into the Weeds 6-6-25
Employment May 2025: We’re Not There Yet 6-6-25
US Trade in Goods April 2025: Imports Be Damned 6-5-25
Past-Prologue Perspective for 2025: Memory Lane 2018 6-5-25
JOLTS April 2025: Slow Burn or Steady State? 6-3-25
Tariffs: Testing Trade Partner Mettle 6-3-25
Mini Market Lookback: Out of Tacos, Tariff Man Returns 5-31-25
PCE April 2025: Personal Income and Outlays 5-30-25
Credit Snapshot: Meritage Homes (MTH) 5-30-24
1Q25 GDP 2nd Estimate: Tariff and Courthouse Waiting Game 5-29-25
Homebuilder Rankings: Volumes, Market Caps, ASPs 5-28-25
Durable Goods Apr25: Hitting an Air Pocket 5-27-25
Mini Market Lookback: Tariff Excess N+1 5-24-25
New Home Sales April 2025: Waiting Game Does Not Help 5-23-25
Existing Home Sales April 2025: Soft but Steady 5-22-25
Credit Snapshot: Lithia Motors (LAD) 5-20-25
Home Starts April 2025: Metrics Show Wear and Tear 5-19-25
Industrial Production April 2025: CapUte Mixed but Time Will Tell 5-15-25