
Payroll Jan 2025: Staying the Course, Supports FOMC Hold
We look at steady jobs and wage growth that will not make life easier for the FOMC.


Tell Musk to slow down the deliveries…
We see a solid enough jobs report of +143K at a time when tariff chatter and the trade policy “misdirection play” still loom large and make life more challenging for anyone trying to read the UST trend as UST supply will soar alongside a massive spike in the deficits.
The payroll line items show zero adds in goods-producing occupations, only 3K in manufacturing, +111K in private services with a subpar quality mix, and +32K in Government.
The unemployment rate has ticked lower to 4.0%, payrolls moved higher for January, payroll revisions were positive for Nov-Dec (+100K total), and hourly earnings weighed in at +4.1%. That hourly wage number will be important to monitor as deportations pick up the pace.
While Trump claimed he would “demand” lower rates, the market will make up its own mind once a debt ceiling deal is struck, a budget gets closer to reality, the tariff clock stops ticking (gonging?), and the fallout in payroll from the federal level carnage and any tariff fallout gets cleared up.
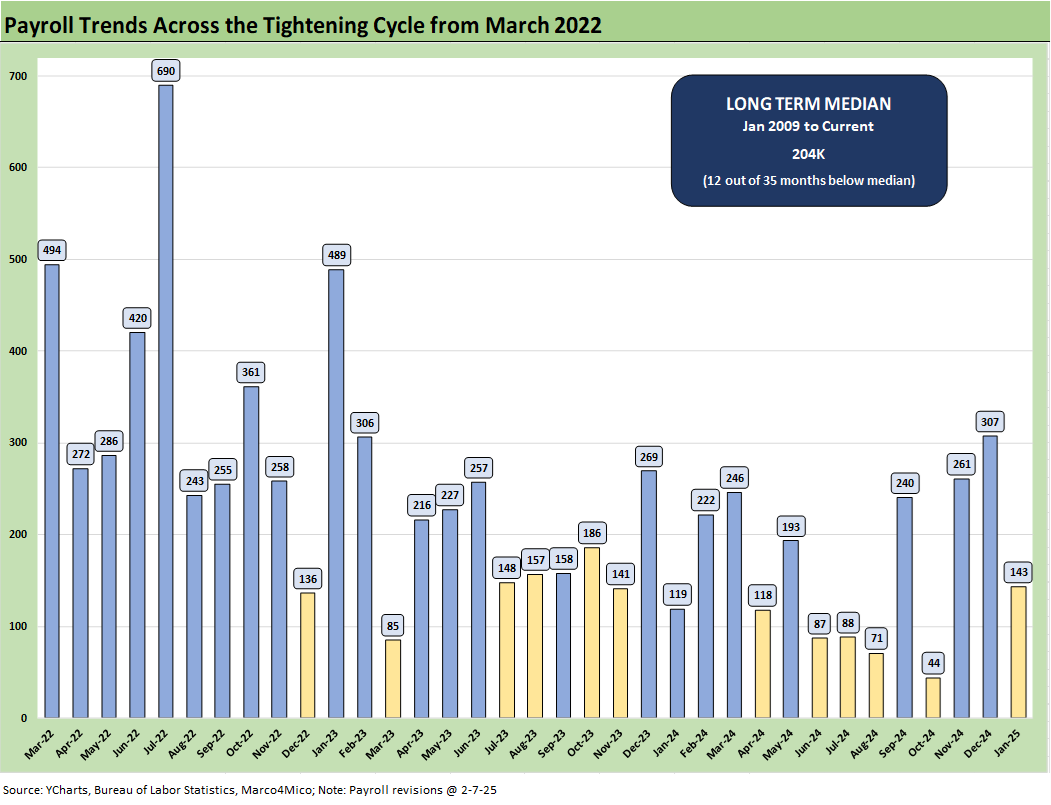
The above chart runs across the job adds for each month since the start of the tightening cycle. The steady stream of positive payroll months even in the face of the 2022 energy volatility, inflation pain, and tightening cycle certainly present a contrast with the earlier inflation cycles of the 1970s and early 1980s.
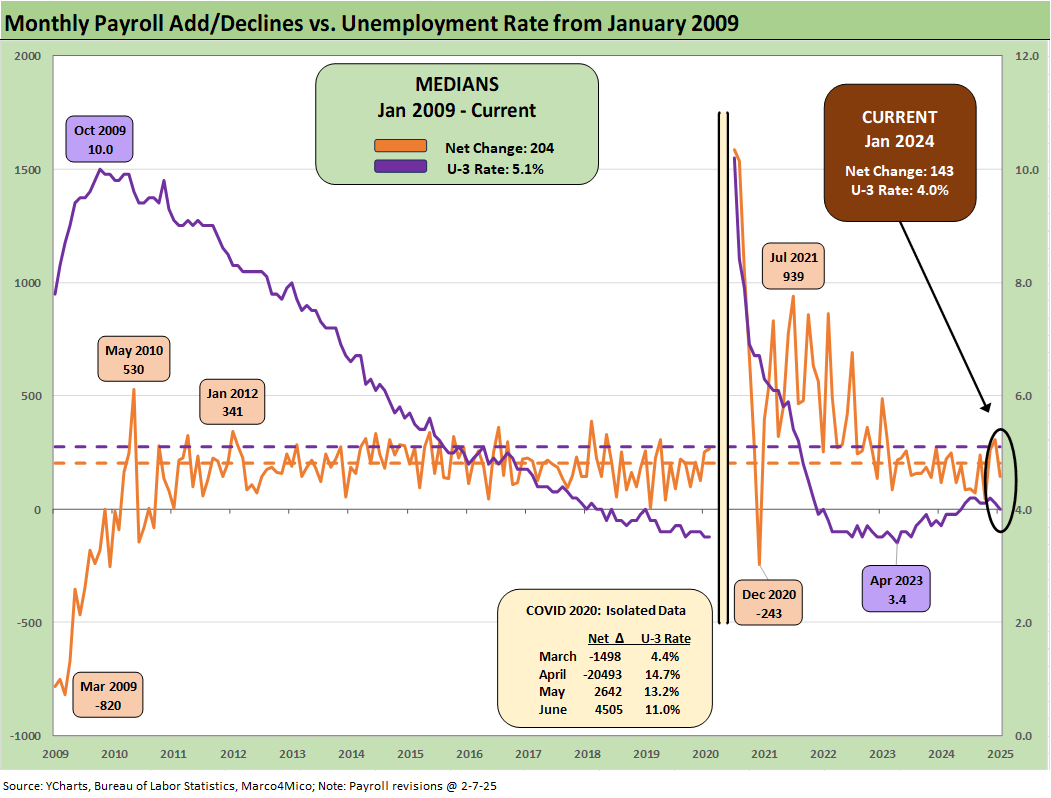
The above chart plots the unemployment rate vs. the monthly job adds since Jan 2009 as the fallout from the systemic crisis took a brutal toll on payroll and slowed the pace of rehiring. We remove the distortions of the COVID period in the interest of chart visuals and include those details in the box. The dip to 4.0% in the unemployment rate in Jan 2025 is lower than the fall 2024 levels although we are up 3 ticks from the 3.7% of Jan 2024.
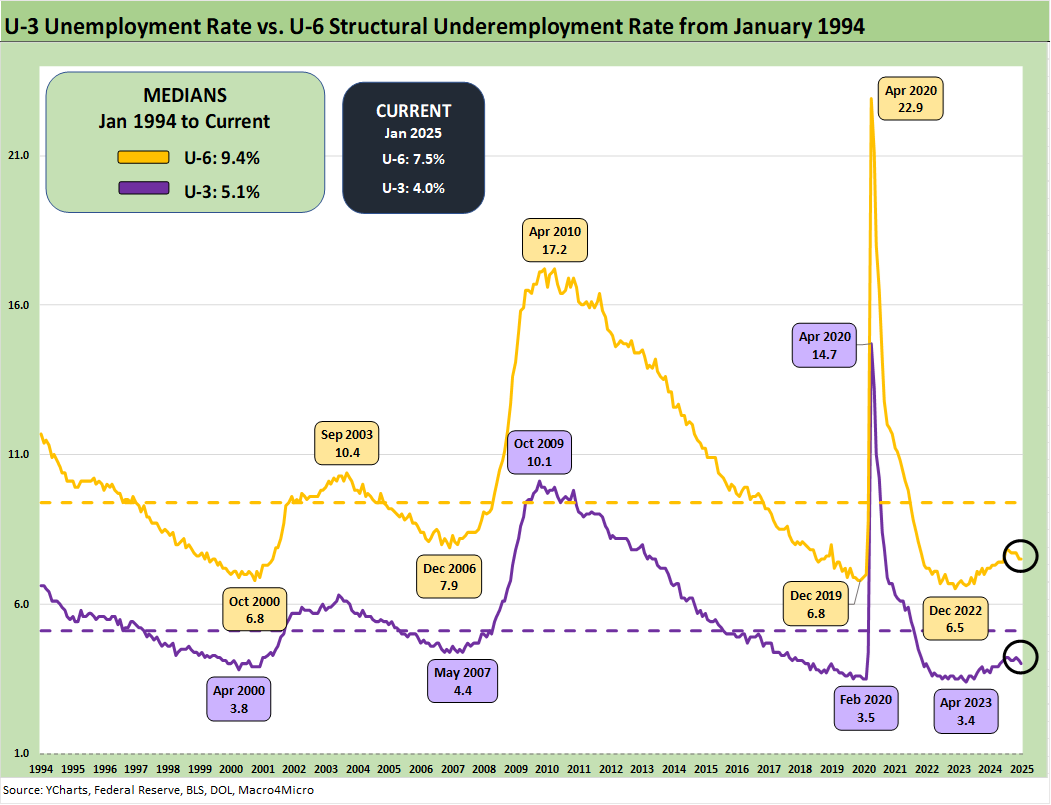
The above chart updates the time series for the U-3 unemployment rate and U-6 structural underemployment rate across the years from 1994. The current U-3 rate of +4.0% is down sequentially from 4.1%. The U-3 is up from +3.7% last year on a SAAR basis.
As a reminder, the U-6 metric is defined with the numerator as “total unemployed + persons marginally attached to the labor force + total employed part time for economic reasons.” The denominator is “civilian labor force + workers marginally attached to the labor force.”
The U-6 was flat sequentially at +7.5%. That is below recent levels in the 7.7% area but well above the 6% handles seen in spring of 2023. The U-6 is also up from the 7.2% level of last year during Jan 2024.
Overall, payrolls are not flagging recession risk. Low 4% unemployment rates in the 1990s would be considered full employment. That estimate of full employment has been all over the map in recent years for a range of reasons including the immigration question. It is safe to say that 4.0% is “low.”
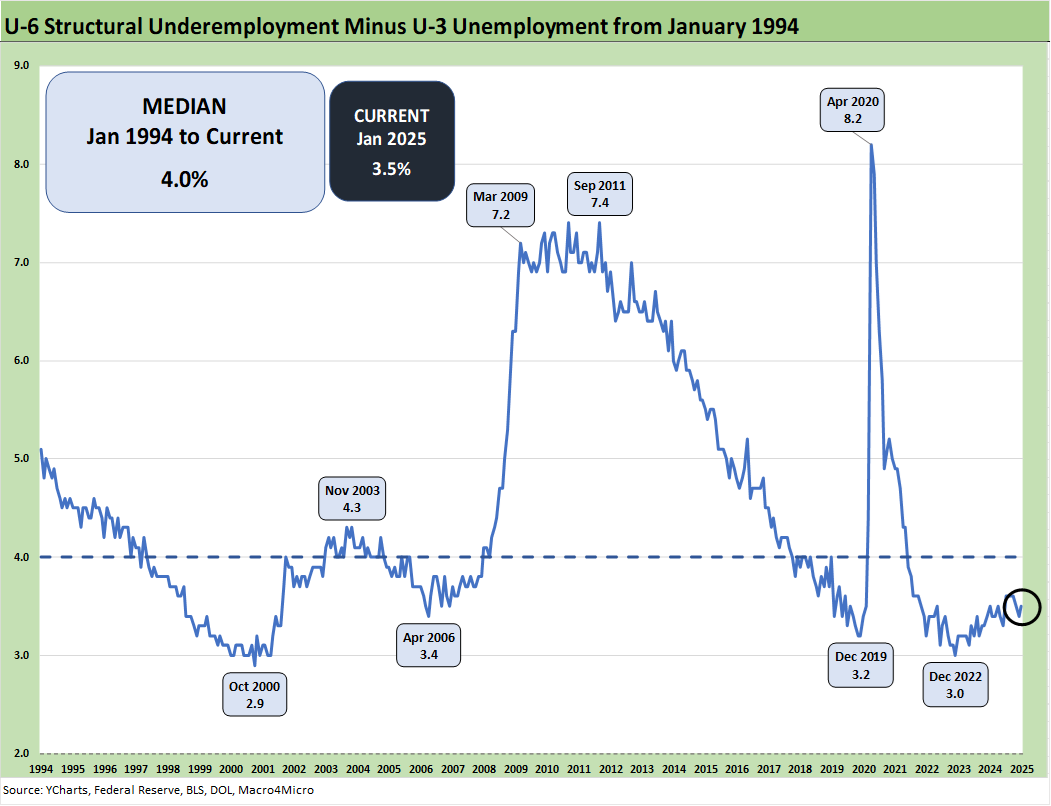
This time series updates the U-6 minus U-3 differential as a measure of relative employment quality and to flag risks of major dislocations in large swaths of the economy (think oil patch in the late 1980s, automotive regions 2009, or tech bubble imploding 2001-2002). The current 3.5% is well inside the long-term median of 4.0%. The dislocations are hard to find in that historical context even if candidates can find them in an election year. This is 2025, and facts don’t always matter.
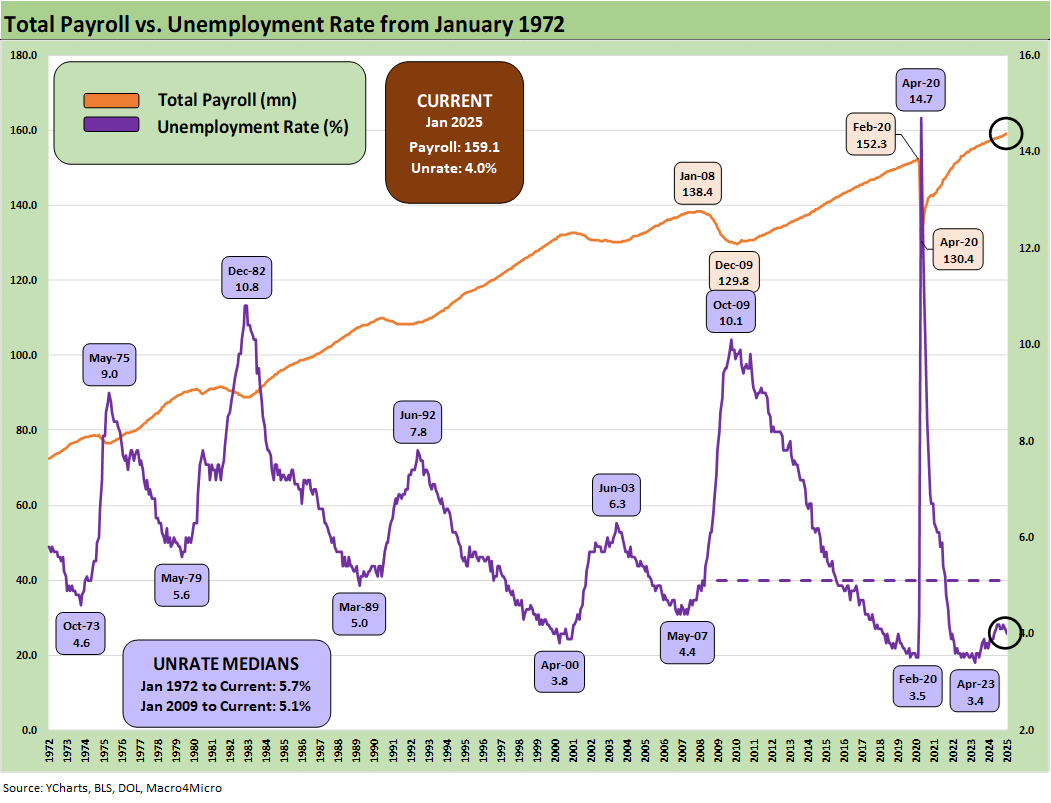
The above chart updates the total payroll headcount vs. the unemployment rate. The chart offers an easy reminder of the “Mo bodies, Mo paychecks, Mo spending” rule and makes it easier to ignore the constant debates over methodologies and unemployment rates.
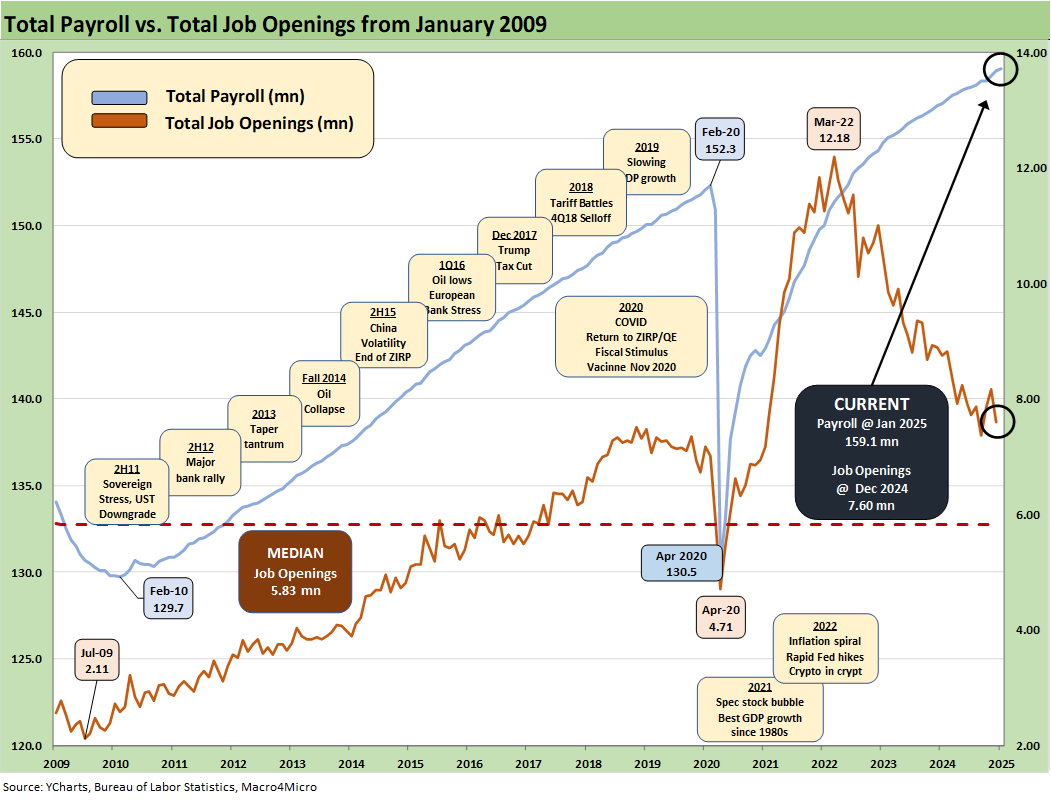
The above chart updates the total payroll number vs. job openings. The most recent JOLTS number was higher than the highest under Trump in his first term when he saw 7.5 million in Nov 2018 (see JOLTS Dec 2024: Before the Tariff JOLT Strikes 2-4-25). The job openings number for Dec 2024 (1-month lag in that data) and now the payroll number for Jan 2025 are steady and solid.
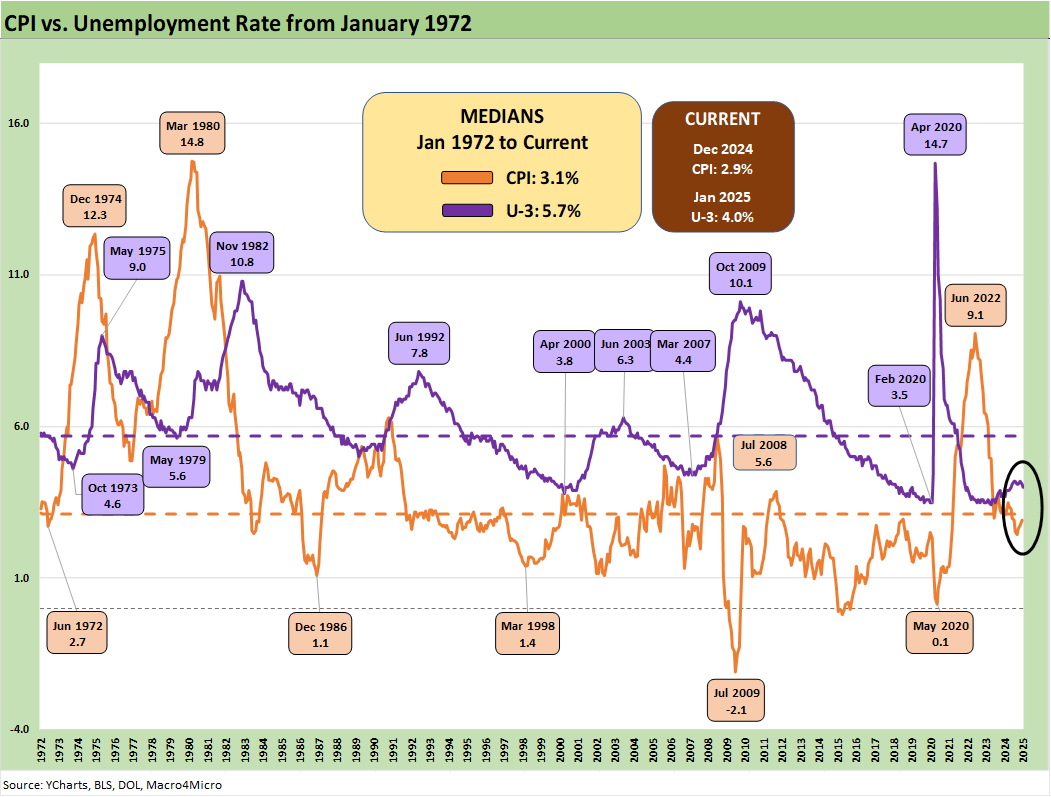
The above time series just adds one more angle looking back from the early 1970s and follows CPI vs. unemployment across the decades. Those were dark stagflation years in the late 1973 to 1975 period and again in the 1980-1982 double dip. The 2022 inflation spike and tightening cycle was not one of those “walking to school in the snow, uphill in both directions, etc.” moments old people whine about.
Those who came of working age in those stagflation years and had Depression era parents have some sense of proportion. We did not even come close to a recession in this recent inflation wave (see Unemployment, Recessions, and the Potter Stewart Rule10-27-22). It was fair to expect one, but it never came. That did not stop Trump from using the word “Depression” in Oct 2024.
The resilience of the consumer is tied to jobs – even with structural underemployment and too many 2-3 jobs households. PCE stayed high, inflation was brief, unemployment was low, investment ran well on stimulus actions, and demographics remain favorable. That was one where the market got a pleasant surprise for many.
The post-2000 economies have been slow-growth periods with 2% average growth (including Trump’s 2% economy while his minions keep saying 3%). Clinton and Reagan had very good economies (see Presidential GDP Dance Off: Clinton vs. Trump 7-27-24, Presidential GDP Dance Off: Reagan vs. Trump 7-27-24 ). Bush, Obama, Trump, and Biden did not in that context (2021 was a post-COVID rebound with great numbers but comes with an asterisk). Trump promised 4% during Trump 1.0, and he delivered mid 2% ex-COVID.
See also:
Trade Exposure: US-Canada Import/Export Mix 2024 2-7-25
US Trade with the World: Import and Export Mix 2-6-25
The Trade Picture: Facts to Respect, Topics to Ponder 2-5-25
JOLTS Dec 2024: Before the Tariff JOLT Strikes 2-4-25
Footnotes & Flashbacks: Credit Markets 2-3-25
Footnotes & Flashbacks: State of Yields 2-2-25
Footnotes & Flashbacks: Asset Returns 2-2-25
Tariffs: Questions to Ponder, Part 1 2-2-25
Mini Market Lookback: Surreal Week, AI Worries about “A” 2-1-25
PCE: Inflation, Personal Income & Outlays 1-31-25
Employment Cost Index 4Q24: Labor Crossroad Dead Ahead 1-31-25
4Q24 GDP: Into the Investment Weeds 1-30-25
4Q24 GDP: Inventory Liquidation Rules 1-30-25
Credit Crib Note: Lennar Corp 1-30-25
D.R. Horton: #1 Homebuilder as a Sector Proxy 1-28-25
Durable Goods Dec 2024: Respectable ex-Transport Numbers 1-28-25
New Home Sales Dec 2024: Decent Finish, Strange Year 1-28-25