
JOLTS Dec 2024: Before the Tariff JOLT Strikes
Dec 2024 JOLTS (1-month lag) at 7.6 million are still above the pre-COVID peak of 7.5 mn in Nov 2018 but below the March 2022 12.2 mn.


What could possibly go wrong on the labor front?
The JOLTS numbers were down sharply from November’s 8.2 million (revised up from 8.1 million) to 7.6 million as some jobs get filled but some other openings may get reconsidered with the Tariff of Damocles hanging over the markets for at least 30 more days.
We get the January payroll numbers later this week, and there may be some outliers to report before “former federal workers” (or “former FBI agents?) might need their own line next month.
The payroll numbers get reported as “nonfarm” which also begs the question of how many agricultural sector workers will be targets for deportation now and in the coming months and labor supply-demand dislocations get framed.

The 7.60 million openings for Dec 2024 is down from 8.16 million in Nov 2024 and 8.89 million in Dec 2023 as jobs get filled and employers assess their needs. For those keeping score, that 7.6 million in openings is higher than the highest under Trump1.0, which hit 7.5 million in Nov 2018 (back during the “greatest economy ever” in the history of the cosmos).

The above chart plots Hires vs. Layoff/Discharges on a SAAR basis. We remove the COVID numbers from this chart to support the visual value for “normal” periods. Those COVID impacts are detailed further below.
Hires ticked up during the month by 89K or by 1.6%, weighted toward the private sector. Finance and insurance lead at the industry level (those inflationary insurance premiums help!) while Retail and Health Care and Social Assistance lines were solid.
Layoffs and Discharges ticked lower by -29K or by -1.6% on lower numbers in Professional and Business Services and in Leisure and Hospitality. Dec 2024 saw Transportation, Warehousing and Utilities post a material increase in layoffs. Such numbers can move around when mergers lead to rationalization of personnel as part of the deal. That means the excitement around more M&A is a double-edged sword for the economy.
Government layoff/discharge numbers at the Federal level weighed in at zero (hold that thought). The quality of these JOLTS numbers will get gut checked in 1Q25 on the layoff and discharge side of the equation and especially at the Federal level. Musk is looking to browbeat more Fed employees into the “Quits” category.

The above chart updates the ratio of Hires to Layoffs/Discharges. The relationship improved this month and is slightly above the long-term median presented from 2007. That post-2007 period includes the longest recession since the Great Depression and the COVID pandemic.

The above chart updates the time series for Hires vs. Total Separations. The “Separations” bucket includes Layoffs/Discharges, Quits and “Other Separations.” We will remain intrigued to see how the BLS handles the deportation numbers that in theory would fall under “Other Separations” or “Layoffs/Discharges.”
We imagine there would be some hesitancy of employers to cite the exit of undocumented workers in a deportation action. Capturing the labor supply-demand imbalances that are unfolding in some industries and regions might be hard to assess.
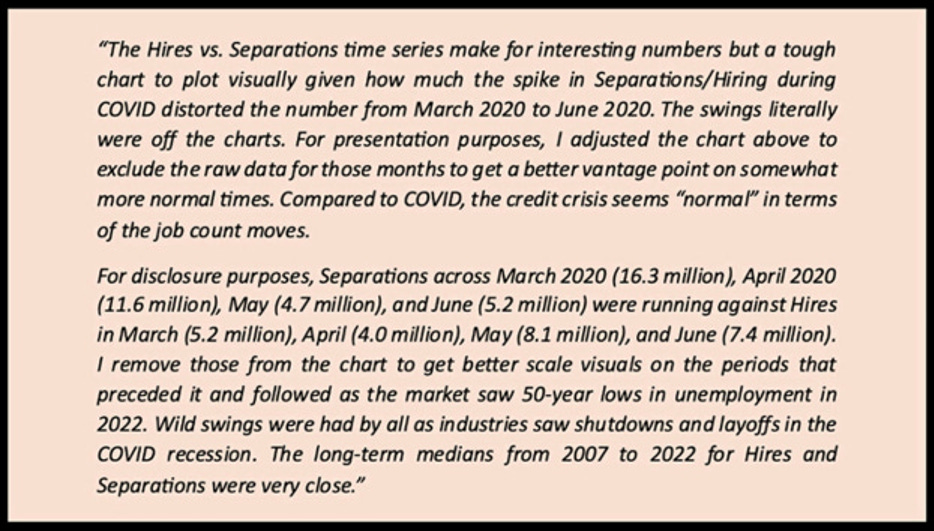
The above text box is our recurring recap of the COVID period. Almost 28 million Separations combined in March-April 2020 is a brutal reminder of that period. That hopefully will be the last time we ever see that.

The Hires minus Total Separations differential is plotted above. That number moved higher sequentially and is now back in line with the long-term median.

The time series for Total Quits as a % of Separations (SAAR basis) ticked slightly higher this month to 60.7% and is still close to the long-term median. The classic “Quits Rate” is measured by Total Quits as a % Total Employment, and that metric moved sideways on the month at 2.0%, unchanged from Nov 2024 (as revised). The Quits rate is down from 2.2% in Dec 2023.
See also:
Footnotes & Flashbacks: Credit Markets 2-3-25
Footnotes & Flashbacks: State of Yields 2-2-25
Footnotes & Flashbacks: Asset Returns 2-2-25
Tariffs: Questions to Ponder, Part 1 2-2-25
Mini Market Lookback: Surreal Week, AI Worries about “A” 2-1-25
PCE: Inflation, Personal Income & Outlays 1-31-25
Employment Cost Index 4Q24: Labor Crossroad Dead Ahead 1-31-25
4Q24 GDP: Into the Investment Weeds 1-30-25
4Q24 GDP: Inventory Liquidation Rules 1-30-25
Credit Crib Note: Lennar Corp 1-30-25
D.R. Horton: #1 Homebuilder as a Sector Proxy 1-28-25
Durable Goods Dec 2024: Respectable ex-Transport Numbers 1-28-25
New Home Sales Dec 2024: Decent Finish, Strange Year 1-28-25
Footnotes & Flashbacks: Credit Markets 1-27-25
Footnotes & Flashbacks: State of Yields 1-26-25
Footnotes & Flashbacks: Asset Returns 1-26-25
Mini Market Lookback: Policy Blitz Formation 1-25-25
Existing Home Sales Dec 2024: Another “Worst Since” Milestone 1-24-25
Top 10 Fun Facts on Past Presidents and their Economies 1-20-25
Industrial Production Dec 2024: Capacity Utilization 1-17-25
Housing Starts Dec 2024: Good Numbers, Multifamily Ricochet 1-17-25
Retail Sales Dec 2024: A Steady Finish 1-16-25
CPI Dec 2024: Mixed = Relief These Days 1-15-25
KB Home 4Q24: Strong Finish Despite Mortgage Rates 1-14-25
United Rentals: Bigger Meal, Same Recipe 1-14-25
Mini Market Lookback: Sloppy Start 1-11-25
Payroll Dec 2024: Back to Good is Bad? 1-10-25
Payroll % Additions: Carter vs. Trump vs. Biden…just for fun 1-8-25
JOLTS: A Strong Handoff 1-7-25
Annual GDP Growth: Jimmy Carter v. Trump v. Biden…just for fun 1-6-25
Mini Market Lookback: Mixed Start, Deep Breaths 1-5-25